It's Wednesday and we have discussion on a few topics today. The first relates to…
Ireland – not as rosy as the official story might suggest
During the crisis, I traced the evolution of the Irish economy. It was clear that the nation took a very big hit in the downturn – between 2007 and 2010 the economy shrunk by 15 per cent. Evidence also makes it clear that before the crisis, the narrative about the so-called Celtic Tiger miracle ignored the fact that a substantial portion of the growth was captured by foreign interests such are the taxation arrangements that attract foreign companies. Ireland also benefitted substantially from the growth in China and the US, and then the UK, all products of extended fiscal deficits. More recently, the impacts of the global tax structures and accounting nuances have significantly distorted the growth estimates for Ireland. In that context, to avoid becoming a laughing stock, the Irish Central Statistics Office (CSO) initiated a review of its national accounts framework and have now started to produce modified estimates of Gross National Income and some of the affected expenditure aggregates (Gross Fixed Capital Formation), which provide a very different picture indeed. While the official data suggests that the Irish economy grew by 39.7 per cent between 2007 and 2016, once the modifications were made to eliminate the distortions arising from these extraordinary global capital shifts, the Modified Gross National Income measure showed growth of only 12.2 per cent. In fact, the Irish economy in total is only 68 per cent the size that the GDP data would suggest – around a third smaller. Further, the modified Gross National Income series has barely grown since the crisis indicating that the Irish population has not received much in return for the hardships the austerity has inflicted upon them.
A brief Irish crisis and post-crisis history via my blogs
The following blogs tracked the Irish experience since the onset of the crisis:
1. The sick Celtic Tiger getting sicker (May 24, 2010) – Ireland imposed fiscal austerity early under pressure from the IMF and the Eurogroup. Its banking system basically collapsed and its economy continued to nose-dive with net emigration rates (particularly among the education and 25-34 years old rose significantly). Further, we learned that the so-called “Celtic Tiger” growth miracle was an illusion and was driven by major US corporations evading US tax liabilities by exploiting massive tax breaks supplied to them by the Irish government.
2. The Celtic Tiger is not a good example (July 10, 2010) – while Ireland was the first nation to really embrace fiscal austerity any early growth that followed was driven largely by the growth in the US economy through trade linkages. Exports were growing but the growth dividend was largely expatriated to foreigners as rising income. Domestic demand continued to contract.
3. How’s poor old Ireland, and how does she stand? (December 19, 2011) – by 2011 there was some growth mostly driven by a fall in Net Financial Income flows while the domestic economy was still declining and unemployment rising further.
4. Oh Ireland, if only you were growing (May 4, 2012) – Ireland was still going backwards and its people were becoming poorer. While GDP was showing the slightest signs of growth, the local residents in Ireland went backwards over 2011 because what growth there was was expropriated by foreigners.
5. Ireland still located in the Irish Sea despite multibillion-euro austerity drive (July 1, 2013) – Real GDP continued to decrease. It was also clear that while exports showed some growth signs courtesy of the renewed growth in the UK and the on-going US growth, any growth dividend was being expatriated to foreigners as rising income. Further, we documented that the Irish labour force shrank dramatically following the onset of the crisis in 2007, which had the effect of attenuating the already massive rise in unemployment.
6. Ireland national accounts and inversion (July 7, 2014) – the tax inversion made it hard to disentangle what is actually happening with the Irish National Accounts.
7. Ireland – the quantity-adjusting recovery (August 10, 2015) – the growth data showed that Ireland was not an example of a “supply-side” internal devaluation inspired recovery. Rather, its growth was an example of a straightforward “Keynesian” quantity adjustment aided by Ireland’s very open economy and the fact that is has been favourably disposed to growth elsewhere supported by on-going fiscal deficits. Further, favourable shifts in the US dollar dominated external competitiveness improvements rather than anything Ireland had done by way of internal devaluation.
8. Ireland demonstrates that fiscal deficits promote growth (December 24, 2015) – analysed the implications of Ireland as a rather strange Eurozone Member State, given that it is more firmly plugged in to the Anglo world than other Eurozone nations. While the Irish government was suppressing domestic demand through austerity from as early as 2009, significant trading partners (such as, Britain, the US and China) were maintaining expansionary fiscal positions, which allowed Ireland to resume growth. Further, a narrow focus on the growth cycle misses significant aspects of national prosperity. Even with two years of economic growth, real earnings growth was flat to negative, the rate of enforced deprivation remains around 30 per cent, and there was a rising proportion of people at risk of poverty. On top of that, net emigration of skilled workers continued, which means that the official unemployment rate was much lower than it would have been if these workers had not left the country.
9. Irish national accounts – smoke and mirrors really (July 20, 2016) – documented the ridiculous data release which showed that between 2014 and 2015, Ireland grew by a staggering 26.3 per cent. Apparently, exports grew by 34.4 per cent and Gross physical capital formation grew by 26.7 per cent, which had to be a data fudge. There had been a rise in the number of aircrafts that have been sent to Ireland to be leased back to international carriers. Further, the tax inversion distortions continued – several large corporation relocated their ‘legal domicile’ to Ireland as a tax haven while leaving their main operations somewhere else where they actually produce things and employ people. The shifting balance sheet is recorded as production (capital formation) in the Irish National Accounts.
Formal inquiry into the data problem launched
It was clear that the 26 per cent growth rate recorded in 2015 made Ireland the laughing stock among analysts. No other developed nation went close to achieving that growth rate and the huge fluctuations that were occurring in successive national account releases made it hard for researchers and policy makers to know what, in fact, was going on.
At that stage, even the Irish government knew something had to be done to provide more realistic national accounts data.
To remedy the situation, the Irish Central Statistics Office (CSO) established an internal review and its final analysis – Report of the Economic Statistics Review Group (ESRG) was published on December 23, 2016.
Its mission was to establish:
… how best to meet the statistical needs of users of CSO statistics, in particular national users, and to provide guidance on the development of a broader suite of domestically-focused economic indicators and information to supplement internationally agreed measures of economic activity (GDP, GNP).
In other words, to provide more realistic data in the context of the massive global capital flows between Ireland and the rest of the world that had severely distorted the published data and given the impression that Ireland was growing very quickly.
Politically this was important because many commentators who had advocated the harsh austerity were using the growth results as alleged ‘vindication’ for their position.
Personally, I was often vilified in the public debate (via comments left on videos, tweets etc) and via countless unsolicited E-mails as being incompetent because I had questioned the ‘growth miracle’ in the face of the austerity.
Well it turns out that my scepticism was warranted.
On February 3, 2017, the CSO) provided a formal – CSO Response to the ESRG Report.
The basic outcomes are as follows:
1. “The focus of the ESRG working group was to identify a suite of analyses or indicators that would provide a better understanding of the domestic components of our highly globalised economy.”
2. “While GDP and GNP continue to be the international standard indicators, the development of a new level indicator, GNI*, has been proposed to address the specific nature of the Irish economy. GNI* is designed to exclude the depreciation attributable to relocated capital assets and the impact of re-domiciled firms.”
3. Combining GNI* with the other measures to be implemented by the CSO, users will be provided with more broad-based information on the Irish economy for decision making purposes.
There were other recommendations which are outside the ambit of today’s blog.
The CSO undertook to develop the new “An adjusted indicator, Gross National Income* (GNI*) of the size of the economy” during 2017 which would be “appropriately adjusted for the retained earnings of re-domiciled firms and depreciation on foreign-owned domestic capital assets.”
The results – Ireland’s economy grew much less than the standard data shows
What we now know as a result of these new modified indicators, is that, while the Irish economy grew by 39.7 per cent between 2007 and 2016 based on standard Gross Domestic Product measures, once the modifications were made to eliminate the distortions arising from these extraordinary global capital shifts, the Modified Gross National Income measure showed growth of 12.2 per cent.
In fact, the Irish economy in total is only 68 per cent the size that the GDP data would suggest – around a third smaller.
That result forces us to significantly reassess the post-crisis experience of the Irish economy.
If you then consider what that means for the levels of debt ratios – you realise that Irish debt to modified GNI is more than 25 per cent higher than the official data shows.
Gross National Income and modified GNI
CSO has not yet fully updated their quarterly series to take into account the modifications they have been making.
But they published – Annual Data – for GDP and GNI*, which allows us to get a good impression of the aggregate impact of the changes.
Gross national income provides an estimate of the income accruing to domestic residents and firms, including income earned abroad.
It excludes income earned by foreigners located in the nation.
The CSO produces the modified GNI estimate (GNI*) by subtracting “Factor income of re-domiciled companies”, “Depreciation on research & development related intellectual property (IP) imports” and “Depreciation on aircraft leasing” all components of GNI that are distorted by the global accounting tricks we have discussed previously.
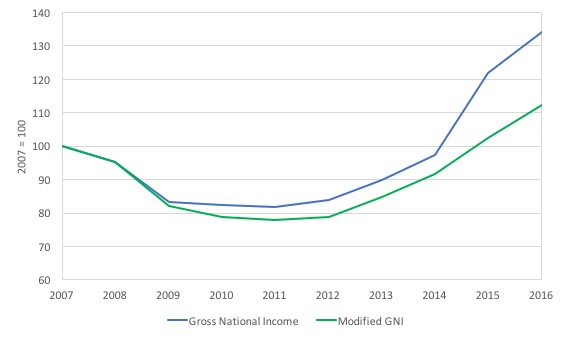
The next graph shows the official national accounts estimate of GNI and the modified estimate (GNI*) for annual data from 2007 to 2016 – indexed at 100 in 2007.
You can see that while GNI has grown by 33.5 per cent over that period, GNI* has grown by just 12.2 per cent. A major difference. The Irish population and firms have enjoyed much smaller gains in income over the period than the official national accounts data would suggest.
And the GNI* series only passed the previous peak in 2015, some 8 years after the crash.
If we express that in Per Capita terms (taking into account population movements) then GNI per capita was estimated to have grown by 23 per cent, which would be a relatively good outcome.
But the modified GNI* per capita growth has been just 3.5 per cent since 2007 – hardly any growth and certainly not sufficient to justify the damaging impacts on services and non-material well-being of the extended period of fiscal austerity.
Fixed Capital Formation – Official and Modified
The adjustments made by CSO impact significantly on the estimates of the flow of Gross Fixed Capital Formation expenditure.
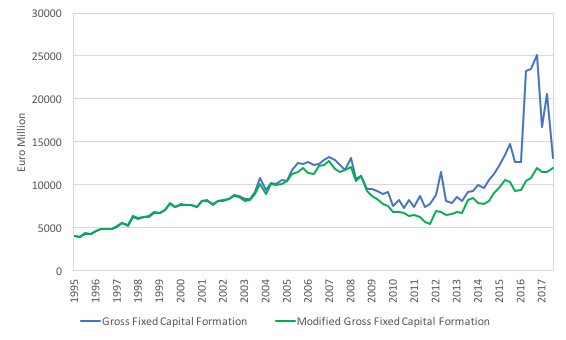
The following graph shows the National Accounts estimate (blue) and the Modified estimate (green) from the March-quarter 1995 to the September-quarter 2017. The data is in real terms (constant price).
You can see how distorted things became in 2015 and 2016 using the standard national accounts data, which gave the impression that real GDP was booming when, in fact, it was growing only modestly.
You can also see that despite the talk of a Celtic Tiger comeback that the modified real Gross Fixed Capital Formation is still below the level that it was at its peak before the crisis (March-quarter 2007).
In fact, it is still 5.7 per cent below the peak level, which indicates that the austerity push and the resulting suppression of domestic demand, has not provided favourable investment climate (in productive capacity).
Final domestic demand – Official and Modified
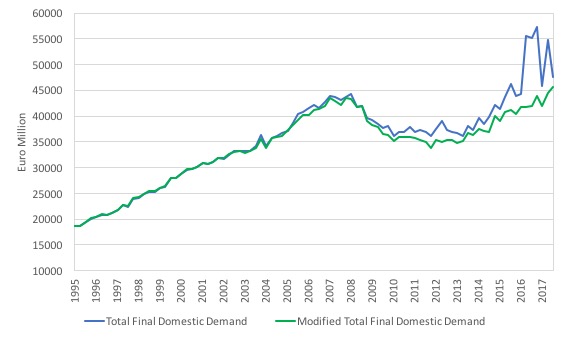
In that sense, the next graph shows the official National Accounts estimate of total final domestic demand (blue) and the Modified estimate (green) over the same period.
A similar story follows.
The modified series only passed the previous (March-quarter 2007) peak in the June-quarter 2017 – that is, ten years after the crisis.
After a decade of austerity, modified final domestic demand (September-quarter 2017) just 5 per cent higher than the March-quarter 2007 peak.
Hardly the sort of data that you would hold out as evidence that austerity improves the fortunes of a population.
The other point to note is that the Irish government maintains a fiscal deficit which is much higher when compared against GNI than it is when expressed as a percentage of GDP.
Conclusion
Clearly, these revisions are highly significant and reinforce what I was conjecturing about over the last several years.
Ireland has achieved some growth for sure helped by the growth in the UK, US and China rather than the internal devaluation.
But once you take into account the quirks that arise from its global exposure (and the accounting tricks etc) then the growth is far from impressive and much lower than the official estimates would suggest.
For all the hardship inflicted on its population, resident incomes have barely grown over the decade.
New blog policy
From 2018, I will not be publishing a detailed mid-week (Wednesday) blog unless there is a relevant data release (for example, the quarterly Australian National Accounts data) or some major event.
I will be using the extra time to advance a few book projects and get the MMT University moving from concept to reality (expecting start is October 2018).
I might publish a modified blog (in keeping with today’s theme) with some snippets or some music. Then again, I might not.
That is enough for today!
(c) Copyright 2018 William Mitchell. All Rights Reserved.
Thanks for this analysis. What is wrong with the accounting profession, that it could publish such misinformation to begin with? That it took years to confess the truth is deeply disturbing. Once again, Thank You.
Bill, do you think that the modified indicators should be used on all economies?
Quite so. For an emphasis on the venal political and corporate corruption involved in the Irish GFC, one can do no better than read Fintan O’Toole’s Ship of Fools, noting the late Charles P. Kindleberger’s dictum from many years ago that every great bubble is associated with great fraud; and so it has proved to be in the case of Ireland. Unfortunately for some, O’Toole does not include photos of the perpetrators, but there are other accounts that do. O’Toole’s account is not a substitute for Bill’s analysis but complementary to it.
Chris, it could be argued that accountants played along with the power brokers; it seems to have taken years for them to admit that they violated their own profession’s principles. Some of them may even be legally culpable, though no one to my knowledge has been prosecuted. Even so, I guess it should not surprise us that they took so long to admit what little they have.
The secret taping of a senior manager during the collapse of Anglo-Irish Bank sums up the farcical nature of it all:
Anglo itself was within days of complete meltdown – and in the years ahead would eat up €30bn of taxpayer money. Mr Bowe speaks about how the State had been asked for €7bn to bail out Anglo – but Anglo’s negotiators knew all along this was not enough to save the bank.
‘The plan was that once the State began the flow of money, it would be unable to stop.
Mr Bowe is asked by Mr Fitzgerald how they had come up with the figure of €7bn. He laughs as he is taped saying: “Just, as Drummer (then-CEO David Drumm) would say, ‘picked it out of my arse’.”
He also says: “If they (Central Bank) saw the enormity of it up front, they might decide they have a choice. You know what I mean?’
See: http://www.independent.ie/business/irish/inside-anglo-the-secret-recordings-29366837.html
I’ve just finished Part 1 of Reclaiming the State Bill. Congratulations to you and Thomas. It is an excellent read and an important one. I particularly liked the observation that the shifting focus of the Left, in respect of the class struggle, from Workers to oppressed minorities has been detrimental to progressive politics and to The Left generally. I hadn’t made that connection before although after reading the book it seems obvious.
Well, the Irish are laughing at us Brits because
(a) we are “stupid” enough to leave the EU, and because of
(b) the complete mess we are making of the Brexit negotiations and the NI/Ireland border situation.
Well, on (b) I would agree with them, except that sooner or later, Ireland will unite, so that problem will disappear.
On (a), we’ll see who has the last laugh. Enjoy your austerity my friends.
First para “… have not started to produce …” should be ‘now’?