I was asked during an interview the other day from Paris whether I was a…
Welcome to the ‘homeless’ working poor – a new neoliberal KPI
In advanced nations, poverty used to be a thing of old age, once income had stopped due to retirement and savings depleted. Old-aged pension systems were intended as Welfare States emerged to prevent that fall into poverty. The pension systems reduced the incidence of extreme poverty and the full employment era that followed the Second World War, where governments committed to using their fiscal capacities (spending and taxation) to ensure there were sufficient jobs for all, allowed workers to improve incomes and saving. Research in the early 1970s (particularly from the US, where the pension systems were less generous and working conditions less regulated) started to disclose the incidence of the ‘working poor’. In more recent times, the concept of the working poor has spread from the US to most advanced nations. In this modern era of renewed real wage repression, rising energy costs and housing costs, workers are not only facing increased risk of poverty but also of homelessness. Welcome to Australia – the nation with the second highest median wealth per adult in the world. Yesterday (February 21, 2018), the Australian Bureau of Statistics (ABS) released the – Wage Price Index, Australia – for the December-quarter 2017. Private sector wages growth was 1.9 per cent in the December-quarter continuing the seven consecutive quarters of record low growth. However, with the annual inflation rate running at 1.9 per cent, real wages growth was static. And with real wages growth lagging badly behind productivity growth, the wage share in national income is now around record low levels. This represents a major rip-off for workers. The flat wages trend is also intensifying the pre-crisis dynamics, which saw private sector credit rather than real wages drive growth in consumption spending. And now, the latest data shows that workers are experiencing increased homeless. It is not just a problem of the ‘working poor’ now. Welcome to the ‘homeless’ working poor – a new neoliberal KPI.
The rise of the working poor and homeless in Australia
There was an excellent book published in 1973 by Barry Bluestone, William M. Murphy and Mary Stevenson entitled Low Wages and the Working Poor which linked the wage determination system in the US with the rising incidence of poverty.
In other nations, the rise of the working poor would come later.
With the advent of neoliberalism and the bias against activist fiscal policy designed to ensure full employment, governments that had been captured by this infestation, asserted their role was no longer to provide jobs for those who couldn’t find them in the ‘market’ economy, but, rather, they were responsible for what I have called ‘full employability’.
In my 2008 book with Joan Muysken – Full Employment abandoned – we discuss this shift in policy in considerable detail.
The idea was that mass unemployment had been reconstructed in the popular narrative as being a ‘supply-side’ problem predominantly due to the laziness of workers in pursuing job search or investing in their own skills or government intervention in the form of minimum wages, income support and other legal constraints on employer choice.
The full employment consensus that prevailed for three decades following the peace of 1945 which stated that mass unemployment was a ‘demand’ problem arising from a systemic failure of the economy to generate enough work as a result of deficiencies in aggregate spending was cast aside.
This obvious point was denied and, instead, we entered the ‘modern’ era of blame the victim. Convoluted stories were spun of lazy workers, preferring to loll around on the dole, instead of looking hard for work.
The income support schemes that had helped workers avoid the descent into poverty when they became temporarily unemployed (remember unemployment in the full employment era was always short-term given there were enough jobs to go round), were reconstructed in the neoliberal narrative as being subsidies for indolence.
And the propaganda from the right-wing think tanks was so constant that the general population started to believe this myth. A new vocabularly emerged – dole bludgers, job snobs, cruisers and the rest.
In Australia, the term ‘dole bludger’ entered the public lexicon, not from a conservative mouth, but from the mouth of a Labor Minister for Employment in 1974 (Clyde Cameron). Such was the neoliberal capture of even the so-called progressive politicians.
As a result, poverty spread from the aged to the unemployed and advanced societies had a new problem to deal with.
More recently, as the unfolding neoliberal attack on workers’ rights has become more entrenched, poverty is now found in the underemployed, which is the ‘new’ way in which capital suppresses wages growth.
In Australia, the flat wages growth has been exacerbated by rising energy costs from the privatised energy companies that now gouge out whatever they can as the reliability of their service delivery falls – another privatisation ‘success’ story. Not!
Further, private health insurance companies, which trade behind the protective wall provided by the Australian government (we are coerced into joining private health insurance by punitive tax rates should one opt to stay exclusively in the public health system), each year push up premiums in multiples of the rise in the consumer price index. Another privatisation ‘success’ story. Not!
And the housing market bubble, driven, in part, by the tax structure (negative gearing) which allows already rich people to write off huge amounts of tax liability through housing speculation (another sop to the top-end-of-town), has made housing costs, particularly rents rise astronomically.
The Victorian-based Council of Homeless Persons released a report recently (February 11, 2018) that shows that:
The number of people being ‘evicted into homelessness’ has more than doubled over five years as rents rise to historic highs, leaving low-income earners unable to find or sustain a rental. Last financial year over 43,751 people presented at Victorian homelessness services due to eviction, up from 17,930 in 2011-12.
The casualties of the housing boom are low-income earners who can’t afford Melbourne’s rents, let alone to buy. Higher house prices mean more aspiring homeowners are renting for longer, which creates more competition and pushes up rents in a ‘landlords’ market.
Australia-wide, the CHP data shows that:
20,302 employed Australians sought homelessness support in 2016-17, well up from 15,931 in 2013-14.
So we have gone beyond the ‘working poor’ to a new, elevated neoliberal success story – the ‘homeless working poor’.
The UK Guardian article (February 22, 2018) – Cost of living pushing Australian workers into homelessness – notes that the CHP:
… has blamed the rise on a combination of sluggish wage growth and extreme housing costs … If that disparity continues, we’ll only see more and more people homeless while they’re working … Then the challenge is that people become homeless [and] it’s just even harder to engage in paid work, because if you’re moving around between friends’ places, couch surfing, it’s hard to have the stability to work.
This trend should also be seen in the context of government refusal to expand the supply of social housing, which has long been the bulwark and security for low-income workers and their families.
There is now a huge and growing deficit in the supply of public housing and the demand for it. Another characteristic neoliberal statistic or should I say, using their parlance – key performance indicator (KPI).
At the same time, as the CHP shows:
The housing boom which has left so many without a home, is ironically delivering a stream of revenue to the State Government in the form of stamp duty.
As the stream of stamp duty revenues rises, so does the number of workers who are finding themselves homeless.
Stamp duty is collected by State Governments in Australia, which are revenue-constrained and so need to collect taxes and borrow in order to spend
But, instead of using the stamp duty windfall from the housing boom to invest in social housing, these idiot, neoliberal governments are boasting about running fiscal surpluses.
So, tick-tock, the long-term problem that will blow the fiscal surpluses up is ticking away.
Variations on this same story are common across the advanced world.
Nominal wage and price inflation and real wage trends in Australia
Now to the wages data released yesterday.
The ABS Media Release (November 15, 2017) said:
The seasonally adjusted Wage Price Index (WPI) rose 0.6 per cent in the December quarter 2017 … [and] … 2.1 per cent through the year …
Seasonally adjusted, private sector wages rose 1.9 per cent …
This result continues a sequence of quarters where wages growth has been just on or slightly below the annual inflation, meaning real wages have been static at best.
The wage series used in this blog is the quarterly ABS Wage Price Index published by the ABS. The Non-farm labour productivity per hour series is derived from the quarterly National Accounts.
Productivity data available via the RBA Table H2 Labour Costs and Productivity.
Please read my blog – Inflation benign in Australia with plenty of scope for fiscal expansion – for more discussion on the various measures of inflation that the RBA uses – CPI, weighted median and the trimmed mean The latter two aim to strip volatility out of the raw CPI series and give a better measure of underlying inflation.
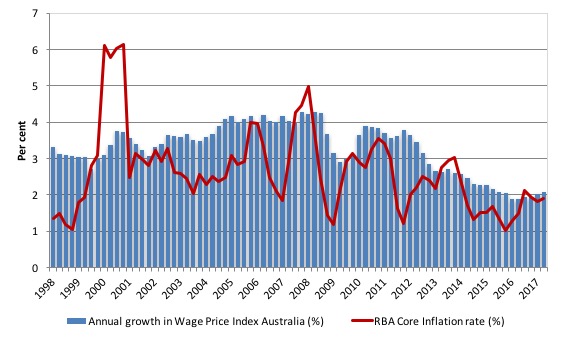
The first graph shows the overall annual growth in the Wage Price Index (public and private) since the December-quarter 1998 (series was first published in the December-quarter 1997).
I also superimposed the annual inflation rate (red line). The blue bars above the red line indicate real wages growth and below the opposite.
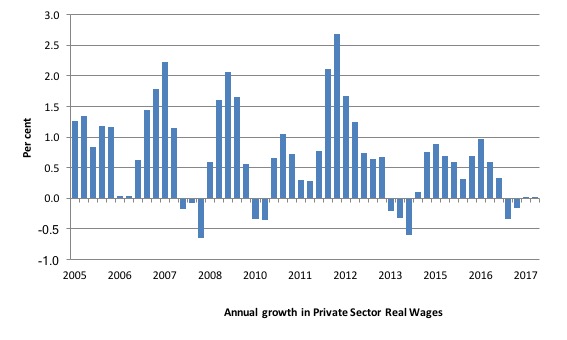
The following graph shows the annual growth in private sector real wages since the June-quarter 2005 to the December-quarter 2017.
After a few quarters of hard real wage cutting in 2013-14, the private sector returned to positive real wages growth but at very subdued rates.
In the March-quarter 2017, real wages growth was negative (-0.3 per cent) and in the June-quarter it was -0.2 per cent. There was a slight rise in the September-quarter (0.03 per cent). Nothing really.
In the December-quarter, the private sector WPI rose by 1.93 per cent on an annual basis compared to the RBA core inflation measure of 1.9 per cent, meaning that the real purchasing power of the vast majority of workers’ wages was largely static.
In other words, after rounding is taken into account, there was virtually zero real wages growth.
The rise in real wages in 2012 into 2013 was the result of the strong economic growth supported by the fiscal stimulus. The declining profile after that is associated with the end of the mining investment boom exacerbated by the obsessive fiscal restraint that was introduced (too early) and has led to the economy stalling.
The low wages growth raises several questions that are not unique to the Australian setting.
1. The low wages growth threatens to undermine household consumption expenditure, which is the largest component of aggregate spending. This fuels renewed demand for credit despite the fact that Australian households are already carrying record levels of debt (see Point 3).
2. The Australian government is mired in a trap of its own making – it still seeks to withdraw billions in public spending (a significant cut) because in its blinkered eyes the fiscal deficit is too large. Its fiscal aspirations for a surplus not only require this withdrawal but also a major rebound in tax revenue.
With wages growth so low – there is no income tax bracket creep going on (people paying higher tax because they move into higher brackets) and tax receipts are falling well below forecasts.
The ‘surplus obsession’ mindset is likely to see the government try to cut elsewhere to make up the shortfall – and the vicious cycle of fiscal austerity, low growth, low wages growth – and more mindless austerity will continue.
3. Australian households are carrying record levels of debt and their position is made more precarious by the low wages growth. Please read my blog – Australia’s household debt problem is not new – it is a neo-liberal product – for more discussion on this point.
The most recent retail sales data showed that household spending has fallen dramatically in recent months, indicating that perhaps the debt-fuelled growth phase is faltering.
Please read my blog – Retail sales dive in Australia – neoliberal contradictions now obvious – for more discussion on this point.
As households cut spending, growth will falter and growth in taxation receipts will fall – the Federal government is then just chasing its own tail at the expense of the unemployed who have to wear the costs of this folly.
Suppressing growth also leads to this declining wages growth profile, which further undermines the tax base of the Government.
Damaging circularity like this are characteristic of the neo-liberal era.
4. And, as above, poverty and homelessness is rising.
Workers not sharing in productivity growth
Not only has real wages growth ground to a standstill in Australia but it is clear that workers have not been sharing in the productivity growth generated in the Australian economy for some years.
Productivity growth provides the ‘non-inflationary’ space for real wages to grow and for material standards of living to rise.
But, one of the salient features of the neo-liberal era has been the on-going redistribution of national income to profits away from wages. This feature is present in many nations.
This has occurred because real wages growth has lagged behind productivity growth and the extra real income produced as been expropriated by capital in the form of profits.
The suppression of real wages growth has been a deliberate strategy of business firms, exploiting the entrenched unemployment and rising underemployment over the last two or three decades.
The aspirations of capital have been aided and abetted by a sequence of ‘pro-business’ governments who have introduced harsh industrial relations legislation to reduce the trade unions’ ability to achieve wage gains for their members. The casualisation of the labour market has also contributed to the suppression.
The so-called ‘free trade’ agreements have also contributed to this trend.
That redistribution of national income to profits continues in Australia. The wage share is now at around its lowest historical levels (at 52.7 per cent)
I consider the implications of that dynamic in this blog – The origins of the economic crisis. As you will see, I argue that without fundamental change in the way governments approach wage determination, the world economies will remain prone to crises.
In summary, the substantial redistribution of national income towards capital over the last 30 years has undermined the capacity of households to maintain consumption growth without recourse to debt.
One of the reasons that household debt levels are now at record levels is that real wages have lagged behind productivity growth and households have resorted to increased credit to maintain their consumption levels, a trend exacerbated by the financial deregulation and lax oversight of the financial sector.
Historically (for periods which data is available), rising productivity growth was shared out to workers in the form of improvements in real living standards. Higher rates of spending driven by the real wages growth then spawned new activity and jobs, which absorbed the workers lost to the productivity growth elsewhere in the economy.
The neo-liberal period marked a shift in that relationship.
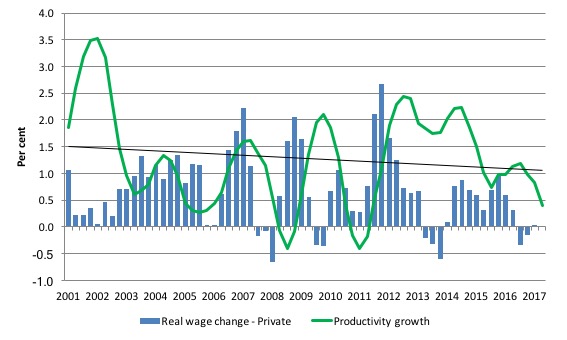
The next graph shows the annual hourly real wage change for the private sector (blue bars) and the annual hourly productivity growth (green line) since the June-quarter 2001, expressed as a 6-quarter moving-average to filter out the volatility in the series. The black line is the trend productivity growth over the same time period.
Over the last 5 years, productivity growth has been mostly above trend and well above the growth in real wages.
Clearly, since the March-quarter 2011, the payoff to workers from the positive productivity growth has been less than proportional with real wages growth lagging productivity growth.
And, it was in the fiscal year 2012, that the Federal government started the current austerity bias after the period of stimulus following the GFC.
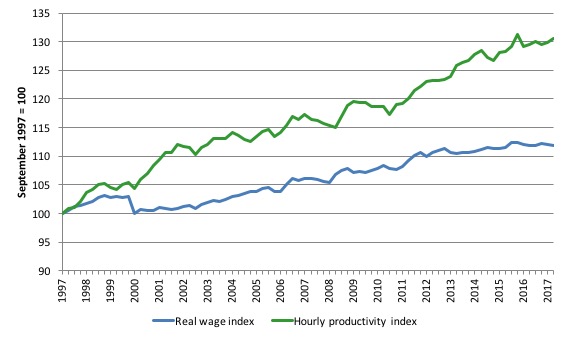
Taking a longer view, the following graph shows the total hourly rates of pay in the private sector in real terms (deflated with the CPI) (blue line) from the inception of the Wage Price Index (December-quarter 1997) and the real GDP per hour worked (from the national accounts) (green line) to the December-quarter 2017.
Over that time, the real hourly wage index has grown by 11.9 per cent, while the hourly productivity index has grown by 30.6 per cent.
If I started the index in the early 1980s, when the gap between the two really started to open up, the productivity index would stand at around 180 and the real wage index at around 115. Data discontinuities however prevent a concise graph of this type being provided at this stage.
This gap represents a massive redistribution of national income to profits and away from wage-earners. For more analysis of why the gap represents a shift in national income shares and why it matters, please read the blog – Australia – stagnant wages growth continues.
Where does the real income that the workers lose by being unable to gain real wages growth in line with productivity growth go?
Answer: Mostly to profits.
One might then claim that investment will be stimulated.
At the onset of the GFC (December-quarter 2007), the Investment ratio (percentage of private investment in productive capital to GDP) was 23.8 per cent.
It peaked at 24.3 per cent in the December-quarter 2013. But in recent quarters as the gap between real wages growth and productivity growth widens, the Investment ratio has fallen and in the September-quarter 2017 (most recent data) it stood at 20 per cent.
Some of the redistributed national income has gone into paying the massive and obscene executive salaries that we occasionally get wind of.
Some will be retained by firms and invested in financial markets fuelling the speculative bubbles around the world.
Real wages growth and employment
The recent labour force data has revealed that employment growth has been picking up in recent months after several years of very flat outcomes.
The standard mainstream argument that unemployment is a result of excessive real wages and moderating real wages should drive stronger employment growth.
As Keynes and many others have shown – wages have two aspects:
First, they add to unit costs, although by how much is moot, given that there is strong evidence that higher wages motivate higher productivity, which offsets the impact of the wage rises on unit costs.
Second, they add to income and consumption expenditure is directly related to the income that workers receive.
So it is not obvious that higher real wages undermine total spending in the economy. Employment growth is a direct function of spending and cutting real wages will only increase employment if you can argue (and show) that it increases spending and reduces the desire to save.
There is no evidence to suggest that would be the case.
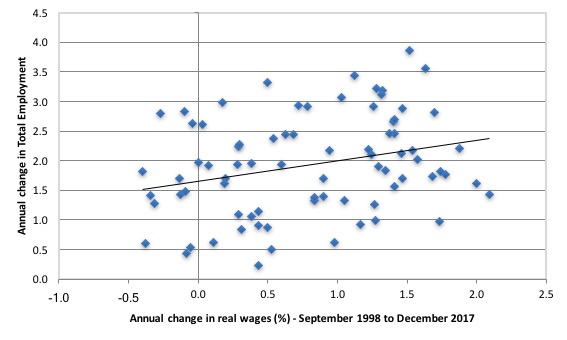
The following graph shows the annual growth in real wages (horizontal axis) and the quarterly change in total employment (vertical axis). The period is from the December-quarter 1998 to the December-quarter 2017. The solid line is a simple linear regression.
Conclusion: When real wages grow faster so does employment although from a two-dimensional graph causality is impossible to determine.
However, there is strong evidence that both employment growth and real wages growth respond positively to total spending growth and increasing economic activity. That evidence supports the positive relationship between real wages growth and employment growth.
Conclusion
Australia continues to endure near record-low wages growth. In the December-quarter private sector real wages growth was around zero.
Real wages growth has now been around zero or negative for more than a year.
The slow wages growth is a cause and reflection of the slow growth in overall economic activity and employment as well as major shifts in the type of employment that is on offer.
The persistent unemployment, the rise in underemployment and the depressed participation rates (rise in hidden underemployment) mean that broad labour underutilisation is over 15 per cent (conservative estimate) in Australia.
That is a massive waste of labour and foregone income. It cannot be explained through worker preference. It is all about a shortage of job creation stifled by excessively restrictive fiscal policy settings and the real wage squeeze.
In turn, workers are adopting a much more cautious approach to spending and firms are demonstrating that they will not lift the investment rate while sales are flagging.
The resulting subdued economic activity will also undermine the Government’s fiscal strategy, which can be summarised as squeezing net public spending out of the economy in the hope that they will achieve a fiscal surplus by 2020-21.
Economic growth and wages growth, in particular, will not be strong enough to match their assumptions and that means the growth in tax receipts will be less than assumed.
It would be better for the Government to stimulate the economy more now with larger fiscal deficits and then see the fiscal balance drop on the back of income growth.
Higher (and more reasonable) wages growth would both benefit from and provide support to such a fiscal strategy.
And, as the latest data from the CHP shows, the poverty arising from the flat wages and rising costs in now spreading into a new problem for workers – homelessness, traditionally the burden borne by the most excluded people in our society.
At the moment, we are in a race-to-the-bottom, which is nowhere any reasonable policy strategy should aim for.
Admin Note
Next week, I will be in Europe for a few weeks.
The continuity of my blog over that period will be uncertain, given my various commitments.
That is enough for today!
(c) Copyright 2017 Bill Mitchell. All Rights Reserved.
How much of Australia’s low wage growth is due to immigration and 457 visa abuse?
I have a friend whose son has an accounting degree. Over a three year period, he applied for over 300 jobs and only had literally a handful of interviews. (He is now studying to be a surveyor.)
I read that in 2014-2015 (I think that was the year) over 5,000 accountants were allowed entry under the 457 visa scheme.
Seems utterly perverse.
A really good blog post. Yet Australia could have full employment, affordable housing, environmental sustainability, a dynamic economy, excellent government services, a thriving arts sector and so on – the world’s highest living standard for all.
But Australia will continue the neoliberal degeneration into brutal feudal servitude to the plutocracy and corporate oligarchy and the good cop bad cop neoliberal duopoly will deliver it. Don’t vote for the duopoly.
A ripper of a blog today.
GDP = GDI
This is an accounting entity and true by definition.
The GDI side of the equation if flagging and should in time pull down GDP.
Or is it the case that GDI is still there but held in large portion by the few who do spend it on GDP but that GDP is made up of a larger portion of luxury goods, multiple homes, limos, international travel and that sort of thing?
Or will GDP adjust down over time to match GDI?
Ouch! How does that work exactly Bill?
Anyway, thanks for this and all the many other articles. I hope you enjoy your stay in Europe. I know you aren’t coming to the UK this time, but I hope you might be able to come over later, when hopefully the weather here will be a bit warmer!
(It’s 4°C here today, and we’re looking at overnight lows of down to -5°C this week…; a bit warmer in London maybe.)
13
Of course the State can produce its own money and so wage increases are relatively straightforward but these fair wages will taken by rents and mortgage repayments without the Land Value Tax that Adam Smith proposed when Modern Economics was invented.Classical laissez faire was massively redistributionist
The people d change in the tax system will exacerbate the this problem. A cut in corporate tax rates funded by a 15% GST (I know the GST isn’t needed to fund any thing but there you go) will shift the tax burden away from corporations and impose it onto ordinary workers.
The working homeless poor is a bigger and bigger thing in NZ too.
I personally know of families who also live in terrible, dilapidated conditions because they have no other option. Landlords know that they can get away with it because of a lack of social housing.
I suspect a rise in the minimum wage over a few years to $20 NZ and a bit more Working For Families won’t be enough to solve this situation. Labour needs to look at housing, labour income share in NZ and do something both about its excessive fiscal parsimony and wage bargaining settings.
CS
We did see a regional development announcement today, so perhaps loosening the purse strings at last.
We live in hope!
Mike Ellwood: a Medicare levy surcharge (MLS) is levied on Australian taxpayers who do not have an appropriate level of private hospital insurance and who earn above a certain income. … The base income threshold (under which you are not liable to pay the MLS) is $90,000 for singles and $180,000 for families.
A carrot and stick is used to “encourage” people into private health (hospital) cover. There is a tax rebate that reduces private health membership cost by about 30%.
But there is also a system of “lifetime health cover” that activates when one reaches 30 years of age. This has the effect of loading premiums as one becomes older and in my case the loading is 70% over the base premium.
About 50% of people have private health but as premiums have risen well ahead of inflation and wage growth is barely keeping up with inflation, retaining private health will likely become increasingly burdensome.
The only real advantage of private health is that it enables faster access to procedures for hip replacements etc. Patients can be in considerable discomfort whilst waiting for such procedures in the public system. The solution is of course to adequately and fully resource the public health system; instead it is under considerable pressure.
Its all so unnecessary. The private system also cherry-picks the most profitable procedures and enriches the surgeons who become very wealthy.
Steven Hail of the University of Adelaide told me that his analysis of Australia’s labour productivity and wages data shows that if nominal wages had kept pace with labour productivity growth since 1966, the minimum wage today would be more than $30 per hour (instead of the mere $18 per hour that is actually in place).
It would be good to legislate a big one-off increase in the minimum wage, perhaps spread over a few years to help employers adjust, in order to bring the minimum wage up to the level that our society’s productivity level warrants. We should also legislate that the minimum wage will automatically keep pace with labour productivity growth. Why should workers have to beg for wage rises and have technocrats at the Fair Work Commission award meagre rises that are far below labour productivity growth?
@ Barri Mundee (Friday, February 23, 2018 at 15:38)
Thanks Barri for that great explanation.
Sounds like the kind of thing that the Tories would love to do to the UK NHS (and probably Blairite-style Labourites, and right-wing Lid-Dems (the so-called “Orange Book” crowd) would be complicit in).
A useful warning to us in Britain therefore.
(Because Blairism sadly, isn’t dead).