It was only a matter of time I suppose but the IMF is now focusing…
How to distort the Brexit debate – exclude significant factors!
The Centre for European Reform, which must have little to do given the snail pace of so-called ‘reform’ that goes on in Europe, released a report over the weekend (June 23, 2018) – What’s the cost of Brexit so far? – which all the Europhile Remainers found filled their Tweet and other social media void for the day. I would have thought that they should have been happy, given England’s demolition of Panama in the soccer and 5-zip thrashing of Australia in the ODI cricket tournament. But no, they wanted to amplify the CER propaganda and makes themselves feel sad. Britain’s economy, apparently, is already 2.1 per cent smaller than it would have been had the vote to exit in June 2016 not won. And apparently, this has been a “hit to the public finances is now £23 billion per annum – or £440 million a week”. If you delve into the way the CER came up with these results you will quickly move on with a ho-hum and get back to the World Cup, which is infinitely more interesting (and that is saying something! read: I don’t enjoy soccer). The saying – Apples and Oranges – is relevant.
The CER start with the no-contest statement, which is intended to force the reader to accept the rest without question:
Any reasonable observer will acknowledge that the Brexit vote has curbed economic growth.
So if you contest that assessment you are not ‘reasonable’. Who wants to be unreasonable? No-one. So just agree. QED.
Well I contest it. And I think I am eminently reasonable and data-grounded.
I last wrote my unreasonable assessments of this matter in this blog post – The ‘if it is bad it must be Brexit’ deception in Britain (May 31, 2018).
I concluded in that blog post that what is happening in Britain now is mostly the result of nearly a decade of poorly contrived macroeconomic policy and has little to do with what happened in June 2016 when the British people exercised their democratic right and made a sound judgement to get out of the dysfunctional, corporatist mess that the European Union has become.
I haven’t changed my mind as a result of reading the CER analysis and doing some further research on the matter.
The CER state the obvious that Britain has slowed in recent quarters and is lagging behind other nations.
They then conduct what they call “a simple modelling exercise to produce an estimate” of “how much has the decision to leave the EU cost the UK economy so far”.
And if it wasn’t enough to present their poorly contrived research into the public debate once, they propose to “update quarterly from now on”. Mon Dieu!
Their estimation technique copies German researchers at the University of Bonn.
1. Create a ‘control’ group – with overtones to the authority that research in the physical sciences, which unlike social science, can conduct properly ‘controlled’ experiments.
CER acknowledge that such an approach is impossible (“we cannot make one Britain vote for Leave and one Britain vote for Remain and then measure the difference”) but claim they can still create a “synthetic UK” which they call their control.
2. The “synthetic UK” nation is created by selecting from the “36 OECD countries” which pool of nations have a profile of “economic growth most closely matches that of the UK between 1995 and the third quarter of 2016”.
They then assume that the UK will continue to grow after the third-quarter 2016 until now in a weighted-average pattern dictated by the nations in the pool.
Those nations are Canada, Japan, Hungary and the US and some other European nations (Denmark, Ireland, Italy, Norway, and17 percent weight).
3. They then compute the real GDP for this weighted pool (the “synthetic UK”) and compare it with the actual real GDP for the UK.
4. The difference is the cost of Brexit, which quantifies to 2.1 per cent by the first-quarter 2018.
CER list a number of “caveats”:
First, they acknowledge that their point estimates of the difference in the growth between the actual UK economy and the “Synthetic UK” economy between the first-quarter 1995 and the third-quarter 2016 are subject to variability (standard deviation) which is estimated to be equal to 0.534 percentage points. The mean difference is -0.04 points.
Let’s accept their method for a moment.
If we assume a point of statistical indifference (lower 95 per cent confidence interval) based on their statistical output (available HERE), then the difference in “cumulative growth in real GDP since Brexit referendum” is only 1 per cent rather than the point estimate of 2.1 per cent.
At the upper limit, Britain would have slumped by 3.2 per cent relative to what might have happened without the Brexit referendum – meaning if it had have grown according to the weighted-average of the reference group of nations.
So there is a significant error band in the estimates. We cannot distinguish statistically between 3.2 per cent difference and a 1 per cent difference (at 95 per cent confidence). A 3.2 per cent gap, given there hasn’t been a recession is rather unbelievable but carries the same statistical status as the 2.1 per cent or 1 per cent gap.
Hardly confidence inspiring (excuse the pun).
Further, note that in computing these estimates the assumption is that the values were independently and randomly sampled from a population whose values are Gaussian distributed. In this situation, that assumption is not valid, which further casts doubt on the veracity of the estimates. But we can leave that technical point to one side.
Statistical games aside, it is on their second caveat that our attention should really be focused.
By way of qualification, CER note that:
… we cannot rule out a positive ‘shock’ to some of countries included – such as a surge in global demand for their exports – which the UK would not have enjoyed even if it had voted for Remain.
Clearly possible although they dismiss this, saying it is hard to say what growth the UK might have missed out on, given the broad-based global upswing in 2017″.
Well we can quite easily see some fundamental differences post June 2016 between their reference countries and the UK, which has impacted on the UKs relative and absolute growth performance.
An examination of CER’s – Dataset – reveals that there is only household consumption, private investment and real GDP included. This was the dataset upon which STATA (their statistical package) interrogated to come up with the reference group that they used to compute the “Synthetic UK” time series post the Brexit referendum.
There is no analysis of the conduct of fiscal policy in the pre- and post-Brexit Referendum period in the CER Report. Why not I wonder?
Well the following graph probably tells you why. It shows the fiscal deficits as a percentage of GDP for the UK and the reference group countries that CER used to compute their “Synthetic UK” time series post-Referendum from fiscal year 2014-15 to the current fiscal year.
The actual fiscal position for the UK is in red.
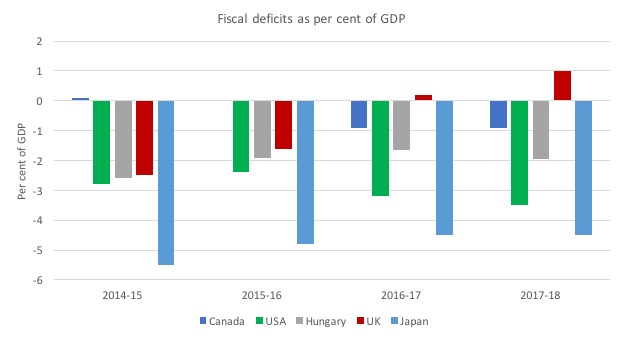
Over this four year span the fiscal shift towards contraction (austerity) in the UK has been notable and has been largely absent in their reference group countries.
Canada, the USA and Hungary have expanded their fiscal deficits in recent years and Japan has held a fairly stable fiscal injection as a percent of GDP.
In other words, there has been no sharp shift towards a more austere fiscal landscape in these nations and that explains a significant part of the superior growth rate for this pool of nations, especially in the last two years (that is, post Referendum).
This is a sharp differentiating feature that separates Britain from its CER Reference Group, which was compiled in the period before the austerity intensified.
The question then is if we included these facts in their analysis and recomputed the reference group and reconstructed the Synthetic UK series then how much difference would there actually be?
I haven’t time today to undertake that exercise but I can guarantee that most of the growth differential between the weighted-average of Japan, US, Hungary and Canada (and the few European nations thrown in) and the UK post June 2016 would be minimal once I standardised for fiscal shifts.
I also note that Norway has also had a significant shift to higher fiscal deficits since the June 2016 Referendum.
CER then use the same analysis to compute “the impact of that foregone growth on the UK’s public finances” and claim that because real GDP growth has slumped, the tax take is down and borrowing is up – by some “£440 million a week”.
They integrate their 2.1 estimate (growth differential) into the seriously flawed estimates provided by leaked UK government document earlier this year to come up with that figure.
Their conclusion is that:
So far, our analysis shows the Remain campaign – and the vast majority of professional economists – have been closer to the truth.
To which I conclude a truthful analysis would have to include these fiscal shifts.
If the slowdown is reducing the tax take then the degree of austerity is even more severe than the actual data shows.
There is thus no surprise that Britain’s recent growth rate has diverged from other nations that have not engaged in the austerity.
That is the truth
Conclusion
What does this all mean?
1. Even within their own logic, the statistical estimates suggest that the difference in terms of real GDP growth between the reference group (which CER purport to represent where Britain would have reached had they not voted to leave) and the actual British economy is around 1 per cent or 3.2 per cent. Take your pick. A wide choice which casts significant doubt on the reliability of the estimates.
2. A significant difference between the reference group nations and the UK, which cannot be excluded from an analysis of relative growth rates, was excluded by CER. Why? Obvious.
3. If we consider the different fiscal trajectories, it is clear that post Referendum, Britain diverges significantly from the reference group nations, all of which either maintain their fiscal support or increase it, while Britain moves towards increased austerity marked by the current fiscal surplus.
The old saying Garbage In-Garbage Out has a way of popping up when we consider all these anti-Brexit statistical exercises.
That is enough for today!
(c) Copyright 2018 William Mitchell. All Rights Reserved.
Got called a racist and a cretin for pointing this out in a Guardian anti-Brexit story.
Allan says:
“Got called a racist and a cretin for pointing this out in a Guardian anti-Brexit story”.
Truly appalling. But it aptly illustrates the nadir of incoherent, spiteful, rage to which too many of the opponents of Brexit have sunk, the disgraceful character of which they are the very last to acknowledge (least of all to themselves).
Pitiable.
Dear Bill
“How to distort the Brexit debate – exclude significant factors!”
Your heading says it all. Congratulations on a superb hatchet-job, executed with surgical precision.
But you will of course be vilified – again – for having the effrontery not just to tell the truth but to expose others’ deliberate misrepresentation of it.
More power to your elbow!
‘ …would have thought..’. Near top of first para.
Sorry Bill, but of a grammar PITA, but you might want to edit…
Succinct read. I’m no statistician but as soon as the ‘basket of like economies’ was described… no.
Design a stat gathering that will give you the result you want, as long as you exclude (don’t attribute effects), the very thing that the UK economy needs, which is being exercised in your comparative ‘group’.
Perusing via Twitter, self-described progressive Remainers seem to be working themselves into apoplectic states, confirmed by an earlier comment here.
The UK governing classes desperately want to stay in the EU. Looking at your graph Bill, it’s tempting to suggest they would even manufacture such a slump this way in order to swing public sentiment to their view. Of course, that assumes they understand the consequences of their fiscal choices, which seems unlikely, given that all UK political parties continue to argue about who would best be able ‘reduce the deficit’ when facing trying times.
A large proportion of remainers know Brexit will go through regardless, it simply can’t be stopped now, all the noise and heat generated in certain sections of the so called ‘liberal’ media and politics is for one purpose, and one purpose only. That is to at some point remove and forever discredit Corbyn and the new left movement and reinstall a rebooted neoliberal New Labour. It’s all theatre to that end.
They know if Corbyn turns against Brexit he’s finished electorally, which is why the pressure to do so is being ratcheted up with reports like these – they want him and the movement to self immolate and fail, above *everything* else – he’ll be annihilated at the ballot box and the move away from neo-liberalism and the new left movement once again put back in the box for another 30-40 years (‘See – we told you moving left doesn’t work’ etc etc)
In my opinion he’s got almost no chance of succeeding no matter what he does, he has all the media against him for differing reasons, the opposition of course and unforgivably most of his own MP’s.
Brexit is going to happen and it will be blamed for any neoliberal or austerity policies enacted thereafter, which in turn will be blamed on Corbyn for not opposing Brexit, or opposing it too late, not opposing it with enough passion, opposing it but not really believing in what he’s saying etc.
By the way Corbyn could help himself post-Brexit if he engages fully with MMT – there is a narrative there ready and waiting to go if he chooses which offers a sliver of hope. If they go down the McDonnell rabbit hole talking about deficits and balancing the books they’re guaranteed to lose.
@Jeff
Your analysis hadn’t occurred to me but I must say I find it persuasive. Put the way you put it, your construction seems to explain a lot of what has up to now seemed to me wildly irrational and completely inexplicable behaviour. Your suggested explanation seems to fit the facts rather well.
So far, Corbyn seems to have kept his nerve. I think May did him an enormous service (as well as putting herself in pawn to the DUP, than which I can’t imagine a worse fate) by calling the last election. Labour having done so unexpectedly well under his leadership was a great feather in his cap, enabling him to seize the initiative, and so far I think he’s manged to keep it – largely by avoiding taking too clear a position and so keeping room to manoevre while being careful not to bring the Tories down. Far better for them to be on the rack – why take their place there?
The reference countries are totally unlike Britain. Using them as a control is just dumb.
As if we were not mad enough, the governor of the bank of England is trying to convince us that a banking collapse will be due to Brexit, instead of the neoliberal de-regulation and private debt excesses that are to blame.
https://www.theguardian.com/politics/2018/jun/27/brexit-bank-contracts-worth-trillions-at-risk-says-finance-watchdog
The reason for the uk poor performance can be highlighted more when one goes a step further and compares the private sector balance of the countries in the control group.
The uk has a private sector balance of about minus 5 when one considers the national government’s surplus and the current account deficit. That is about the worst private sector balance in the developed world.
@ Alan Longbon
I’m an American but have been following UK politics very closely for years now. The UK ruling class (and, to an obviously lesser extent via conditioning, its public) is obsessed with austerity. To the degree of clinical obsession. It’s far beyond anything I see even in the US. So while I hadn’t crunched those particular numbers, they don’t surprise me.
Where did the data for the UK fiscal position come from? From ONS data, I can only see deficits as a % of GDP.