Today (April 18, 2024), the Australian Bureau of Statistics released the latest - Labour Force,…
Employer groups in Australia lied about the impacts of penalty rate cuts
Sunday (July 1, 2018) was a very sad day in Australia because it marked the second phase of the cuts to penalty rates for workers in the lowest paid sectors of the Economy. The Fair Work Commission (FWC), which is the quasi-judicial tribunal that sets wages in Australia including legally binding minimum wages and conditions, bowed to the relentless pressure from employers (and the conservative federal government) and decided to cut penalty rates for some of the lowest-paid workers in Australia. The cuts which will eventually savage take-home pay for these workers were phased in from July 1, 2017 with the final cuts coming in 2020. The phasing in process where saw Sunday wages will fall from 200 per cent to 150 per cent over that period was justified by the FWC because the cuts would be extremely damaging to the prosperity of the low-paid workers impacted. Anyway, we have just passed the first year of the cuts and this week marks the second phase. Given we received the latest employment by industry data in the last fortnight, we can undertake some detailed analysis to see whether there is any evidence to support the employers’ claims that the cuts would benefit jobs and hours of work in the impacted sectors (Retail Trade and Accommodation and Food Services). You will not be surprised to read that the opposite seems to be the case, although the generally poor results for the industries that are sensitive to the penalty rate cuts cannot be attributed directly to those cuts. But the evidence is very strong – the cuts to penalty rates have hurt low paid workers and driven then towards or over the poverty line with no positive effects being evident in terms of employment or working hour gains.
Penalty rate cuts have not increased employment
The employer groups have long argued that if the FWC cut penalty rates then there would be a jobs and hours of work boom in the sensitive industries (Accommodation and Food Services, Retail Trade, etc) because costs would fall and businesses would pass those costs decreases on in the form of lower prices which would stimulate demand.
I outlined the arguments and the critique in these blog posts among others:
1. No case made to cut penalty rates (August 7, 2015).
2. Penalty wage rates are still justified for non-standard hours work (April 6, 2015).
After years of relentless campaigning, the employers, aided and abetted by a sympathetic conservative federal government and a stacked Fair Work Commission, finally were able to win penalty rate cuts in the fast food, retail, hospitality and pharmacy industries, with the first tranche phased in on July 1, 2017.
The second tranche began on July 1, 2018 and the total cuts will be final by 2020.
The phasing in process was claimed by the FWC to be in the interests of fairness to the workers who they acknowledged would be seriously impacted by the cuts.
The workers impacted are among the lowest-paid in Australia and depend on the penalty rates at weekends and other non-standard times. Many are still ranked among the working poor even with the penalty rates.
The total cuts planned are (Source):
For full and part-time workers for example, Sunday hospitality pay rates will be cut from 175 per cent of their standard wage to 150 per cent. Public holiday rates will fall from 250 per cent to 225 per cent.
In retail, Sunday wages will fall from 200 per cent of the standard rate to 150 per cent. On public holidays the penalty rate will fall from 250 per cent to 225 per cent.
If you work night shifts you will also face pay cuts.
For example, the 10 per cent evening work penalty for fast-food workers will apply from 10.00pm to midnight, instead of from 9:00pm.
The 15 per cent after midnight penalty will apply to hours worked between midnight and 6.00am, instead of 7:00am.
The first phase cut rates by 10 per cent on July 1, 2017. Phase 2 cuts an additional 10-15 per cent from last weekend. Next year, rates will be cut by a further 15 per cent and so on.
So we now have a full year’s worth of data to see if there has been any significant increases in employment in the sectors that experienced the penalty rate cuts on July 1, 2017.
The short answer is that the claims by the employers that finally bullied a compliant FWC into making these cuts do not appear to have been realised.
There has been no significant employment dividend arising from the cuts and, indeed, there have been significant cuts in full-time employment, hours of work and rising underemployment.
Nothing redolent of a jobs boom following the penalty rate cuts. Pretty much the opposite.
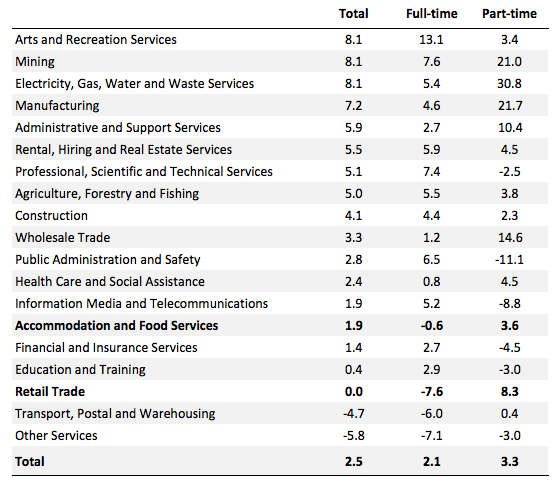
In terms of Industry employment, the following table shows the growth in total, full-time and part-time employment by sector (19 in the Australian classification) in the 12 months to the May-quarter 2018, ranked by Total.
The two sectors sensitive to the penalty rate changes are shown in bold.
Both have suffered cuts to full-time employment over the last 12 months and above average growth in part-time employment. Overall, total employment growth has lagged significantly below the Australia-wide growth rate.
If we examine the absolute changes underlying these growth rates, we see the extent of the churn that has been going on.
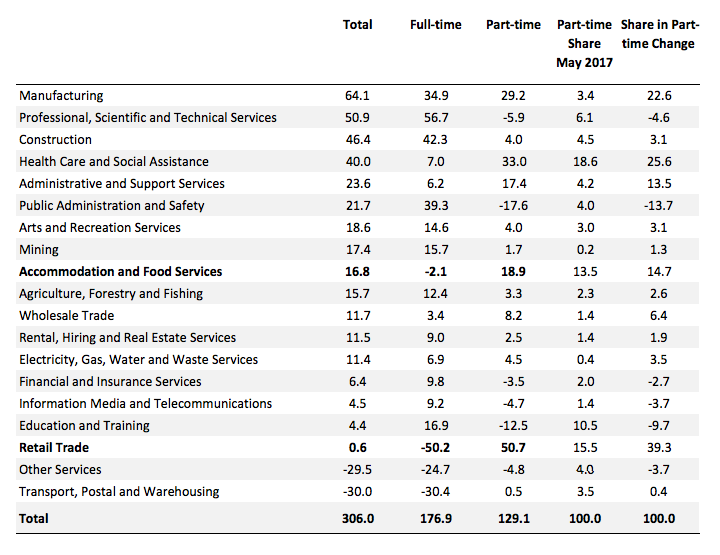
The next table shows the change in in total, full-time and part-time employment by sector in the 12 months to the May-quarter 2018, ranked by Total.
It also shows the share of part-time employment by sector as at the May-quarter 2017 and the share in the part-time employment change over the 12 months to the May-quarter 2018. This allows us to see whether there is proportionately being maintained.
I chose the part-time shares because the proponents of penalty rate cuts would argue that it would most impact on casual (part-time) work and hours (see later).
In the case of Retail Trade, the almost zero total employment change (600 net job added in the 12 months) was associated with a dramatic fall in full-time work (50.2 thousand) and an almost commensurate increase in part-time work (50.7 thousand).
This signals are lot of restructuring was going on as firms tried to deal with the changing circumstances in the sector that has seen employment growth flatten out dramatically since the onset of the GFC and in the face of the rise of on-line shopping etc (see graph below).
In this context, firms have sought to survive by reducing hours of work by restructuring full-time jobs into part-time jobs. This trend has been continuing for the last few decades and has little to do with the structure in penalty rates.
The penalty rate cuts from July 1, 2017 are not implicated in improving outcomes for workers in this sector.
In the Accommodation and Food Services, there was significantly less churn between full-time and part-time employment. But, significantly, even though part-time employment grew over the 12 months, the share of part-time work only increased marginally.
Again, it is hard to see a significant positive employment effect from the penalty rate cuts.
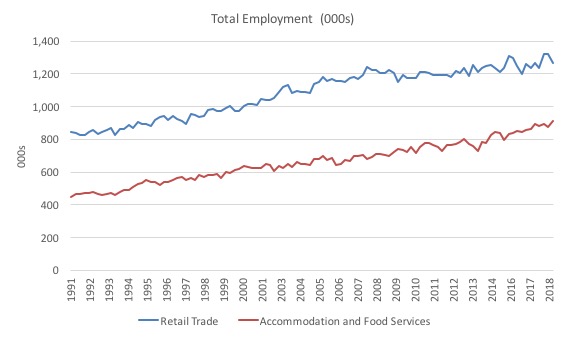
This graph shows the movement in total employment in Retail Trade and Accommodation and Food Services from the February-quarter 1991 to the May-quarter 2018.
You can see that Retail Trade has flattened out since about 2007 while Accommodation and Food Services has enjoyed fairly consistent growth over the period shown.
Hours worked declined in sectors with penalty rate cuts
The employers aggressively asserted that if penalty rates were cut not only would total employment in the sensitive sectors rise but also hours of work would rise.
We were told over and again that businesses were reluctant to open on weekends because of the imposition of the penalty rates and would gladly open their businesses for trade once the rates were cut.
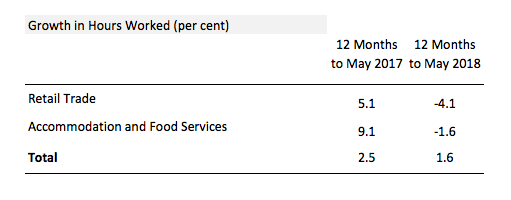
The following table shows that this claim is false – at least for the period shown.
In the two sectors impacted by the cuts, total working hours fell in the 12 months to the May-quarter 2018 despite overall working hours in the economy growing by 1.6 per cent (which is, in itself not that flash).
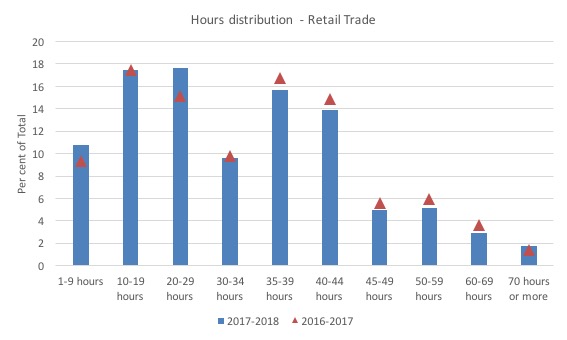
The following set of graphs shows the shifting shares within the hours worked segment (as a % of total sectoral employment) for the 12 months to the May-quarter 2017 (red triangles) and for the 12 months to the May-quarter 2018 (blue columns).
The first graph shows the shifts for Retail Trade over the two year period.
We see that the number of workers engaged in the longer working weeks around full-time and beyond has shrunk noticeably, while there has been a higher proportion working in the 1-9 hours segment and the 20-29 hours segment (from 15.2 per cent to 17.7 per cent).
The latter result is consistent with my earlier observation that businesses have attempted to survive the weak sales conditions by restructuring full-time jobs into part-time jobs.
There does not appear to be any evidence that the penalty rate cuts have boosted hours significantly.
The second graph covers Accommodation and Food Services sector. The hours distribution is fairly stable and denies any penalty rate effect.
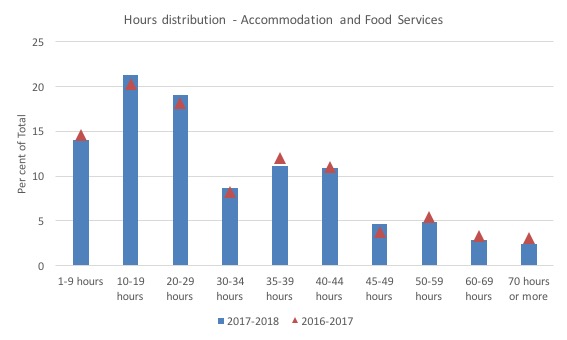
The pattern of hours worked is also very stable over this period at the aggregate level.
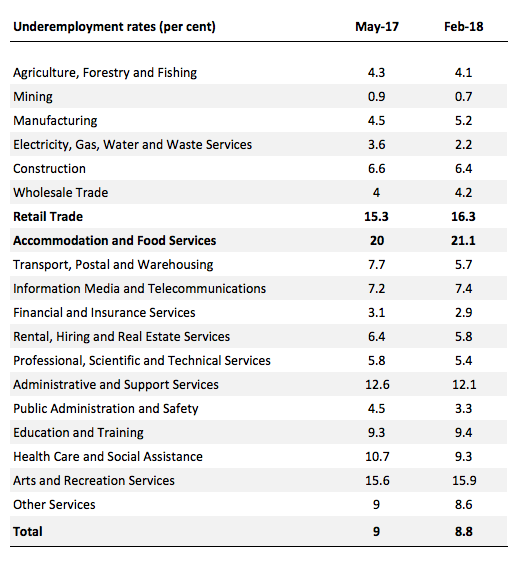
Underemployment rising in the sensitive sectors
The next table shows that underemployment has also increased in the period since the introduction of the penalty rate cuts in the two sensitive sectors, while underemployment overall has declined modestly in the period shown.
A reasonable interpretation is that the decline in working hours in Retail Trade and Accommodation and Food Services have not been supply-side motivated – that is, reflecting the preference of workers.
Underemployment is a demand-side effect imposed on the workers as businesses ration the hours of work on offer. It is a typical response to falling or flat sales environments in the product market.
The rising underemployment in the sensitive sectors certainly supports my conjecture that the dynamics in those sectors are being driven by flat demand conditions rather than any cost savings resulting from the penalty rate cuts.
Where have the jobs been created – US and Australia
On a related theme, I have been digging into the employment data at an occupational level recently. This was to fine tune my previous estimates of job creation by pay class to see whether the upturn had been biased towards low-paid jobs or not.
My most recent estimates for the US appeared in this blog post – US labour market weaker in March 2018 (April 9, 2018).
I concluded that there has been a bias towards low-paid jobs in the recovery in the US and that bias has intensified since late 2017.
The analysis was conducted at the industry level and so I wanted to see whether the aggregation level influenced the result.
My most recent estimates for the Australian labour market of this question appeared in this blog post – Australia races to the low-pay bottom while employers’ lies are exposed (December 1, 2016).
Again, the analysis was at the 1-digit industry level, and the level of aggregation may hide deeper insights.
The conclusion in the Australian case was at that time that the bias towards low-paid work had intensified along with the rising part-time ratio and the rising underemployment.
Over the 6 months to August 2016, there has been a disproportionate growth in below-average paying jobs. The decline in share of low-pay jobs is the result of the major decline in retail employment.
The following analysis seeks to see whether an analysis at the occupational level provides any interesting results in this regard.
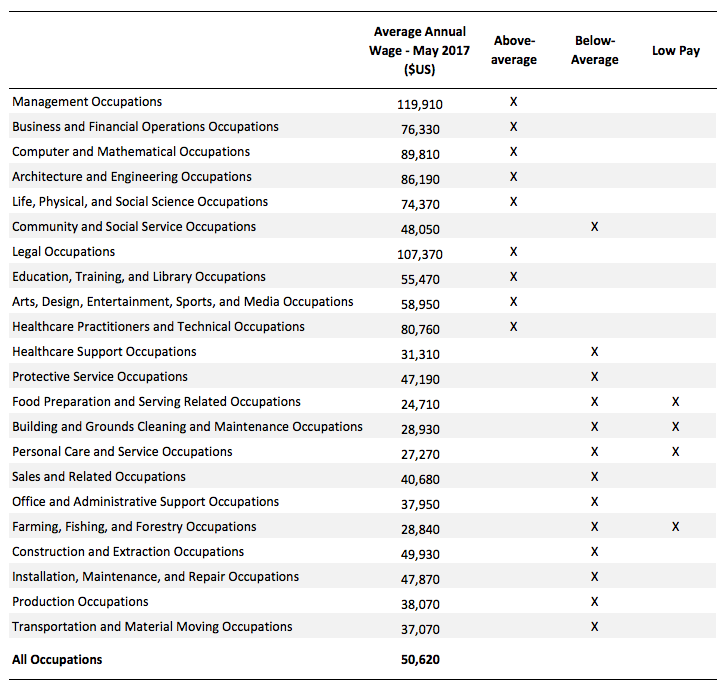
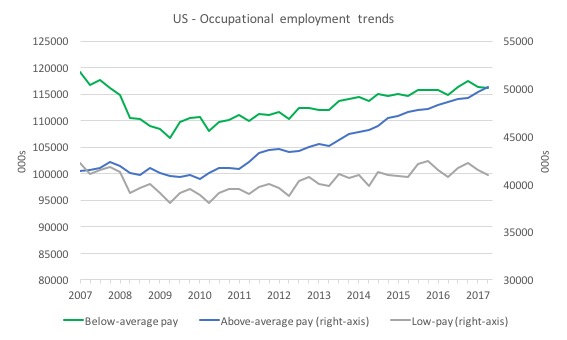
For the US, the Major Occupations are ranked according the latest occupation earnings data available from the Bureau of Labor Statistics (May 2017).
The following table shows the classification into Above-average, Below-average and Low Pay (60 per cent of mean income in this case).
The following graph shows the evolution of total occupational employment for each pay category since the pre-GFC peak (December 2007). Note the segmented axis, which you should then interpret with care.
It is clear in the downturn that most of the employment losses came in the Below-average pay occupations (a 10.4 per cent fall) with the Above-average occupations barely enduring any job losses (1.3 per cent) between December 2007 and March 2010.
There was an overall job loss of 8 per cent from Peak-to-Trough.
In the recovery, Above-average pay occupations have grown by 22 per cent, while the Below-average pay occupations have grown by 8.8 per cent (Low Pay 7.8 per cent). Total employment has grown by 12.6 per cent.
Taken over the entire period from December 2007 to March 2018, the Above-average pay occupations have grown by 21.1 per cent, Below-average pay have fallen by 2.5 per cent (Low Pay fallen 3 per cent) and total employment has risen by 3.6 per cent.
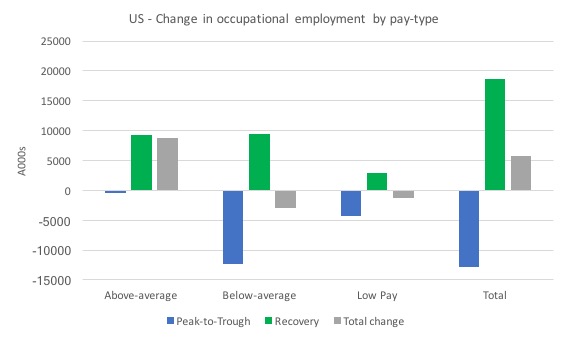
The next graph summarises these relative shifts in terms of employment levels (000s).
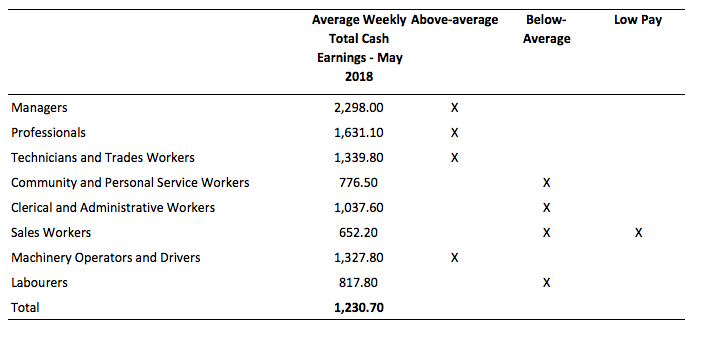
As for the US, the Australian Occupation classification is shown in the folowing table along with the Average Weekly Total Cash Earnings at May 2018.
The following table shows the classification into Above-average, Below-average and Low Pay (60 per cent of mean income in this case).
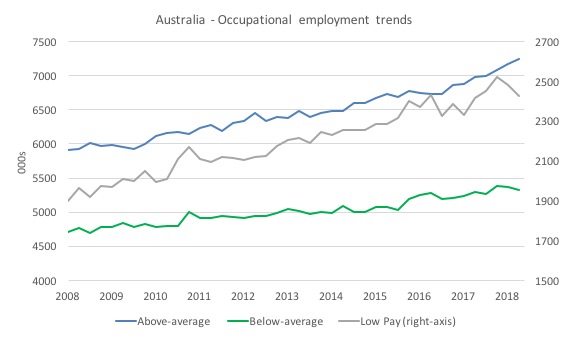
The following graph shows the evolution of total occupational employment for each pay category since the pre-GFC peak (February 2008). Note the segmented axis, which you should then interpret with care.
There was not a major cyclical downturn in Australia following the onset of the GFC. This was due to the very large and early fiscal stimulus, which saved tens of thousands of jobs that would have otherwise been lost.
So, unlike the US, there was only a slowdown as the graph shows.
The period shown in has two-phases:
1. Peak (February 2008) to end of slowdown (August-quarter 2010 for Below-Average; August-quarter 2009 for Above-average). Above-average pay occupations grew by 0.2 per cent while Below-average pay occupations grew by 1.9 per cent, with a bias towards Low Pay.
2. Recovery period after slowdown to May-quarter 2018. Above-average pay occupations grew by 22.2 per cent while Below-average pay occupations grew by half that rate at 11.1 per cent, again with a bias towards Low Pay.
So in the recovery period, Australian job creation has been biased towards the higher paying occupations.
Conclusion
My task today was to report on the research I have been doing over the last few weeks when the most recent employment by sector data was published for Australia.
It allowed us to see after 12 months of penalty rate cuts whether there was evidence to support the employers’ claims that they would benefit jobs and hours of work.
Quite the opposite seems to be the case, although the generally poor results for the industries that are sensitive to the penalty rate cuts cannot be attributed directly to those cuts.
There is a general malaise in those sectors which is, in part, cyclical and in another part, structural, as discussed above.
The employer groups will obviously say that it is too early to assess the impacts given the phase-in period doesn’t end until 2020.
My assessment is that we will see no gains whenever we do the analysis.
That is enough for today!
(c) Copyright 2018 William Mitchell. All Rights Reserved.
Neoliberals suffer from tunnel visions when it come to policy. They have no concept of unintended consequences, no understanding there are always alternate outcomes from they one they are aiming for. To put it simply, they find it impossible to believe they could be plain wrong.
IMHO, they have no idea why most are not buying.
Workers are no longer to work harder to put more food on the table of those at the top in the hope their gluttony will allow more crumbs to the masses below.