Here are the answers with discussion for this Weekend’s Quiz. The information provided should help you work out why you missed a question or three! If you haven’t already done the Quiz from yesterday then have a go at it before you read the answers. I hope this helps you develop an understanding of Modern…
The Weekend Quiz – September 1-2, 2018 – answers and discussion
Here are the answers with discussion for this Weekend’s Quiz. The information provided should help you work out why you missed a question or three! If you haven’t already done the Quiz from yesterday then have a go at it before you read the answers. I hope this helps you develop an understanding of Modern Monetary Theory (MMT) and its application to macroeconomic thinking. Comments as usual welcome, especially if I have made an error.
Here are the answers with discussion for yesterday’s quiz. The information provided should help you work out why you missed a question or three! If you haven’t already done the Quiz from yesterday then have a go at it before you read the answers. I hope this helps you develop an understanding of Modern Monetary Theory (MMT) and its application to macroeconomic thinking. Comments as usual welcome, especially if I have made an error.
Question 1:
Over a given economic cycle (peak to peak), if a nation’s external sector is, on average, balanced and the government gap between its tax revenue and spending is, on average, equal to 1 per cent of GDP, then the private domestic sector’s spending-income balance will, on average, be in:
(a) Deficit of 1 per cent of GDP
(b) Surplus of 1 per cent of GDP
The answer is Deficit of 1 per cent of GDP.
This is a question about sectoral balances. Skip the derivation if you are familiar with the framework.
To refresh your memory the balances are derived as follows. The basic income-expenditure model in macroeconomics can be viewed in (at least) two ways: (a) from the perspective of the sources of spending; and (b) from the perspective of the uses of the income produced. Bringing these two perspectives (of the same thing) together generates the sectoral balances.
From the sources perspective we write:
(1) GDP = C + I + G + (X – M)
which says that total national income (GDP) is the sum of total final consumption spending (C), total private investment (I), total government spending (G) and net exports (X – M).
Expression (1) tells us that total income in the economy per period will be exactly equal to total spending from all sources of expenditure.
We also have to acknowledge that financial balances of the sectors are impacted by net government taxes (T) which includes all tax revenue minus total transfer and interest payments (the latter are not counted independently in the expenditure Expression (1)).
Further, as noted above the trade account is only one aspect of the financial flows between the domestic economy and the external sector. we have to include net external income flows (FNI).
Adding in the net external income flows (FNI) to Expression (2) for GDP we get the familiar gross national product or gross national income measure (GNP):
(2) GNP = C + I + G + (X – M) + FNI
To render this approach into the sectoral balances form, we subtract total net taxes (T) from both sides of Expression (3) to get:
(3) GNP – T = C + I + G + (X – M) + FNI – T
Now we can collect the terms by arranging them according to the three sectoral balances:
(4) (GNP – C – T) – I = (G – T) + (X – M + FNI)
The the terms in Expression (4) are relatively easy to understand now.
The term (GNP – C – T) represents total income less the amount consumed less the amount paid to government in taxes (taking into account transfers coming the other way). In other words, it represents private domestic saving.
The left-hand side of Equation (4), (GNP – C – T) – I, thus is the overall saving of the private domestic sector, which is distinct from total household saving denoted by the term (GNP – C – T).
In other words, the left-hand side of Equation (4) is the private domestic financial balance and if it is positive then the sector is spending less than its total income and if it is negative the sector is spending more than it total income.
The term (G – T) is the government financial balance and is in deficit if government spending (G) is greater than government tax revenue minus transfers (T), and in surplus if the balance is negative.
Finally, the other right-hand side term (X – M + FNI) is the external financial balance, commonly known as the current account balance (CAD). It is in surplus if positive and deficit if negative.
In English we could say that:
The private financial balance equals the sum of the government financial balance plus the current account balance.
We can re-write Expression (6) in this way to get the sectoral balances equation:
(5) (S – I) = (G – T) + CAD
which is interpreted as meaning that government sector deficits (G – T > 0) and current account surpluses (CAD > 0) generate national income and net financial assets for the private domestic sector.
Conversely, government surpluses (G – T < 0) and current account deficits (CAD < 0) reduce national income and undermine the capacity of the private domestic sector to add financial assets.
Expression (5) can also be written as:
(6) [(S – I) – CAD] = (G – T)
where the term on the left-hand side [(S – I) – CAD] is the non-government sector financial balance and is of equal and opposite sign to the government financial balance.
This is the familiar MMT statement that a government sector deficit (surplus) is equal dollar-for-dollar to the non-government sector surplus (deficit).
The sectoral balances equation says that total private savings (S) minus private investment (I) has to equal the public deficit (spending, G minus taxes, T) plus net exports (exports (X) minus imports (M)) plus net income transfers.
All these relationships (equations) hold as a matter of accounting and not matters of opinion.
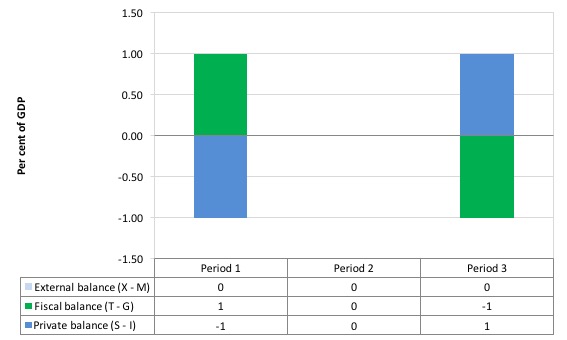
Consider the following graph which shows three situations where the external sector is in balance.
Period 1, is the case in point with the fiscal balance in surplus (T – G = 1) and the private domestic balance is in deficit (S – I = -1). With the external balance equal to 0, the general rule that the government surplus (deficit) equals the non-government deficit (surplus) applies to the government and the private domestic sector. In other words, the private domestic sector must be spending more than it is earning (a deficit).
In Period 3, the fiscal balance is in deficit (T – G = -1) and this provides some demand stimulus in the absence of any impact from the external sector, which allows the private domestic sector to save (S – I = 1).
Period 2, the fiscal balance is in balance (T – G = 0) and so the private domestic sector must also be in balance (spending equals its earning).
The movements in income associated with the spending and revenue patterns will ensure these balances arise. The problem is that if the private domestic sector desires to save overall then this outcome will be unstable and would lead to changes in the other balances as national income changed in response to the decline in private spending.
So under the conditions specified in the question, the private domestic sector cannot save overall. The government would be undermining any desire to save overall by not providing the fiscal stimulus necessary to increase national output and income so that private households/firms could save overall.
You may wish to read the following blogs for more information:
- Stock-flow consistent macro models
- Norway and sectoral balances
- The OECD is at it again!
- Barnaby, better to walk before we run
- Saturday Quiz – June 19, 2010 – answers and discussion
Question 2:
If the government uses its fiscal policy instruments to maintain trend real GDP growth it will also ensure full employment is sustained.
The answer is False.
To see why, we might usefully construct a scenario that will explicate the options available to a government:
- Assume that trend real GDP growth rate is 3 per cent annum.
- Assume that labour productivity growth (that is, growth in real output per person employed) is growing at 2 per cent per annum. So as this grows less employment in required per unit of output.
- Assume that the labour force is growing by 1.5 per cent per annum. Growth in the labour force adds to the employment that has to be generated for unemployment to stay constant (or fall).
- Assume that the average working week is constant in hours. So firms are not making hours adjustments up or down with their existing workforce. Hours adjustments alter the relationship between real GDP growth and persons employed.
We can use this scenario to explore the different outcomes.
The trend rate of real GDP growth doesn’t relate to the labour market in any direct way. The late Arthur Okun is famous (among other things) for estimating the relationship that links the percentage deviation in real GDP growth from potential to the percentage change in the unemployment rate – the so-called Okun’s Law.
The algebra underlying this law can be manipulated to estimate the evolution of the unemployment rate based on real output forecasts.
From Okun, we can relate the major output and labour force aggregates to form expectations about changes in the aggregate unemployment rate based on output growth rates. A series of accounting identities underpins Okun’s Law and helps us, in part, to understand why unemployment rates have risen.
Take the following output accounting statement:
(1) Y = LP*(1-UR)LH
where Y is real GDP, LP is labour productivity in persons (that is, real output per unit of labour), H is the average number of hours worked per period, UR is the aggregate unemployment rate, and L is the labour-force. So (1-UR) is the employment rate, by definition.
Equation (1) just tells us the obvious – that total output produced in a period is equal to total labour input [(1-UR)LH] times the amount of output each unit of labour input produces (LP).
Using some simple calculus you can convert Equation (1) into an approximate dynamic equation expressing percentage growth rates, which in turn, provides a simple benchmark to estimate, for given labour-force and labour productivity growth rates, the increase in output required to achieve a desired unemployment rate.
Accordingly, with small letters indicating percentage growth rates and assuming that the average number of hours worked per period is more or less constant, we get:
(2) y = lp + (1 – ur) + lf
Re-arranging Equation (2) to express it in a way that allows us to achieve our aim (re-arranging just means taking and adding things to both sides of the equation):
(3) ur = 1 + lp + lf – y
Equation (3) provides the approximate rule of thumb – if the unemployment rate is to remain constant, the rate of real output growth must equal the rate of growth in the labour-force plus the growth rate in labour productivity.
It is an approximate relationship because cyclical movements in labour productivity (changes in hoarding) and the labour-force participation rates can modify the relationships in the short-run. But it provides reasonable estimates of what happens when real output changes.
The sum of labour force and productivity growth rates is referred to as the required real GDP growth rate – required to keep the unemployment rate constant.
Remember that labour productivity growth (real GDP per person employed) reduces the need for labour for a given real GDP growth rate while labour force growth adds workers that have to be accommodated for by the real GDP growth (for a given productivity growth rate).
So in the example, the required real GDP growth rate is 3.5 per cent per annum and if policy only aspires to keep real GDP growth at its trend growth rate of 3 per cent annum, then the output gap that emerges is 0.5 per cent per annum.
The unemployment rate will rise by this much (give or take) and reflects the fact that real output growth is not strong enough to both absorb the new entrants into the labour market and offset the employment losses arising from labour productivity growth.
So the appropriate fiscal strategy does not relate to “trend output” but to the required real GDP growth rate given labour force and productivity growth. The two growth rates might be consistent but then they need not be. That lack of concordance makes the proposition false.
The following blog may be of further interest to you:
Question 3:
If the external sector is accumulating financial claims on the local economy (that is, providing foreign savings to the domestic economy) and the GDP growth rate is lower than the real interest rate, then the private domestic sector and the government sector can run surpluses without damaging employment growth.
The answer is False.
When the external sector is accumulating financial claims on the local economy it must mean the current account is in deficit – so the external balance is in deficit. Under these conditions it is impossible for both the private domestic sector and government sector to run surpluses. One of those two has to also be in deficit to satisfy the national accounting rules and income adjustments will always ensure that is the case.
The relationship between the rate of GDP growth and the real interest rate doesn’t alter this result and was included as superfluous information to test the clarity of your understanding.
To understand this we need to begin with the national accounts which underpin the basic income-expenditure model that is at the heart of introductory macroeconomics. See the answer to Question 1 for the background conceptual development.
Consider the following graph and associated table of data which shows six periods. All periods have a constant external deficit equal to 2 per cent of GDP (light-blue columns).
Period 1 show a government running a fiscal deficit (T-G < 0) equal to 2 per cent of GDP (green columns). As a consequence, the private domestic balance is in balance because the fiscal deficit exactly offsets the external deficit.
Period 2 shows that when the fiscal surplus contracts to 1 per cent of GDP the private domestic sector goes into deficit of 1 per cent of GDP.
Period 3 is a fiscal balance and then the private domestic sector’s deficit is exactly equal to the external deficit. So by spending more than it earns, the private domestic sector exactly funds the desire of the external sector to accumulate financial assets in the currency of issue in this country.
Period 4 to 6 shows what happens when the fiscal balance goes into surplus – the private domestic sector’s deficit increases by each per cent of GDP the fiscal surplus rises.
Periods 4 to 6 cannot be a sustainable growth strategy because eventually the private domestic sector will collapse under the weight of its indebtedness and start to save. At that point the fiscal drag from the fiscal surpluses will reinforce the spending decline and the economy would go into recession
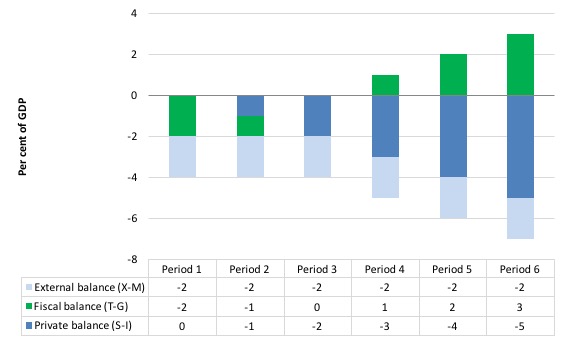
Note also that the government balance equals exactly $-for-$ (as a per cent of GDP) the non-government balance (the sum of the private domestic and external balances). This is also a basic rule derived from the national accounts.
Most countries currently run external deficits. The crisis was marked by households reducing consumption spending growth to try to manage their debt exposure and private investment retreating. The consequence was a major spending gap which pushed fiscal positions into deficits via the automatic stabilisers.
The only way to get income growth going in this context and to allow the private sector surpluses to build was to increase the deficits beyond the impact of the automatic stabilisers. The reality is that this policy change hasn’t delivered large enough fiscal deficits (even with external deficits narrowing). The result has been large negative income adjustments which brought the sectoral balances into equality at significantly lower levels of economic activity.
The following blogs may be of further interest to you:
Question 1 mentions a “gap” between spending and tax income of 1% but it doesn’t say if that is surplus or deficit.
Hi Korual, yes I had the same thought. I wasn’t sure if the gap between the government’s tax receipts and the government’s spending referred to a fiscal surplus or a fiscal deficit.
Dear Bill, do you have time to write another fantasy budget like the one that you wrote in May 2013? I would find it helpful to know how much non-inflationary fiscal space is currently available to the Australian Government.
Yeah, I guessed the wrong way on the ‘gap’ thing also. So I had the wrong answer for the right reasons. Or something like that. I have awarded myself 3 out of 3. And I’m very happy with that decision.