Today (March 6, 2024), the Australian Bureau of Statistics released the latest - Australian National…
Australian national accounts – growth continues but deep uncertainty looms
The Australian Bureau of Statistics released the latest June-quarter 2018 National Accounts data today (September 5, 2018). While the economy recorded a relatively robust 0.9 per cent growth for the quarter and 3.4 per cent over the 12 months to March 2018, the economy remains reliant on household consumption expenditure, which, in turn, is being driven by credit and declining savings as household income growth moderates. There is very little growth contribution coming from the external sector and the contribution from private investment was zero. That is an unsustainable mix. All this means that the current overall growth trajectory is fairly fragile. There is a high probability that household consumption expenditure will slow right down as debt levels become unmanageable. Whether that happens will depend on the wages growth trajectory in future quarters and the outlook on that front is mixed. Overall, this is not a balanced growth outcome.
The main features of the National Accounts release for the June-quarter 2018 were (seasonally adjusted):
- Real GDP increased by 0.9 per cent for the quarter – a strong result. The annual growth rate was 3.4 per cent which is slightly above the pre-GFC trend.
- The main positive contributors to real GDP growth were household consumption expenditure (0.4 points) and general government consumption expenditure (0.2 points).
- The main negative contributing factor was private investment expenditure (0 points).
- Australia’s Terms of Trade (seasonally adjusted) fell by 1.3 per cent in the quarter but rose by 2 per cent over the 12 month period.
- Real net national disposable income, which is a broader measure of change in national economic well-being rose by 0.3 per cent for the quarter and 3.7 per cent for the 12 months to the June-quarter 2018, which means that Australians are significantly better off (on average) than they were at that point 12 months ago.
- The Household saving ratio (from disposable income) fell to 1 per cent, well below the levels that were observed following the GFC. It is now at it lowest level since the December-quarter 2007.
Overall growth picture – relatively robust but deep uncertainty looms
The ABS – Press Release – said that:
The Australian economy grew 0.9 per cent in seasonally adjusted chain volume terms in the June quarter 2018 … Growth in domestic demand accounts for over half the growth in GDP, and reflected strength in household expenditure …
General government final consumption expenditure increased 1.0 per cent in the June quarter. Public investment remained at elevated levels reflecting continued work on infrastructure projects across the nation.
Investment in new dwellings increased 3.6 percent for the quarter. with strength observed in Victoria and South Australia. This strength was reflected in the Construction industry, which grew 1.9 per cent for the quarter.
Moderate growth in household disposable income coupled with strength in household consumption resulted in a decline in the household saving ratio to 1.0 per cent, recording its lowest rate since December 2007.
First, the government contribution is strong both in recurrent spending and capital formation (see below).
Second, the last paragraph in the quoted section of the Press Release tells you why a deep uncertainty looms.
The largest component of aggregate spending – household consumption expenditure – is being maintained even in a weak wages environment and modest growth in household disposable income because households are running down their savings.
The household saving ratio has plummetted and is approaching zero. That means that consumption growth will be increasingly reliant on ever increasing levels of debt – and household debt is already at alarming levels.
The RBA warned yesterday in their monetary policy decision (to keep interest rates steady) that “household … debt levels are high”. I will analyse that in a separate blog post another day soon.
So this is a rather precarious situation and cannot be sustained indefinitely.
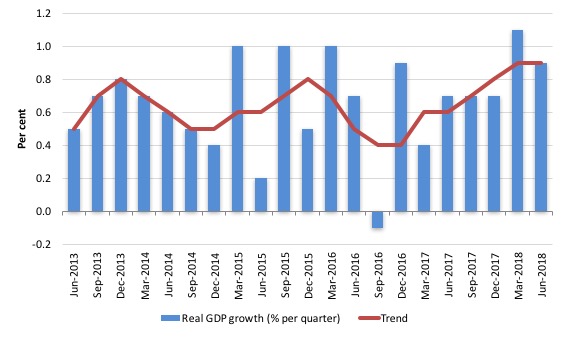
The first graph shows the quarterly growth over the last five years (with the red line being the ABS moving average trend). The trend growth is flattening again suggesting that the spike in quarterly growth for March was not the sign of a new period of above-trend growth.
Analysis of Expenditure Components
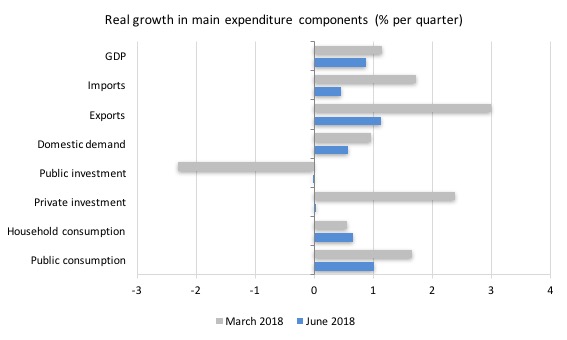
The following graph shows the quarterly percentage growth for the major expenditure components in real terms for the March-quarter 2018 (grey bars) and the June-quarter 2018 (blue bars).
The overall growth performance is being driven by the strength of domestic demand (mostly household expenditure, government consumption expenditure).
Private investment expenditure growth was weak (virtually zero) after a strong first-quarter.
Contributions to growth
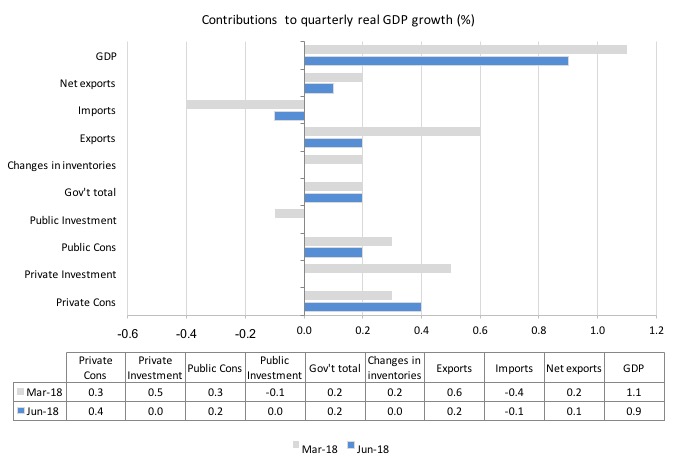
What components of expenditure added to and subtracted from the 0.9 per cent real GDP growth in the June-quarter 2018?
The following bar graph shows the contributions to real GDP growth (in percentage points) for the main expenditure categories. It compares the June-quarter 2018 contributions (blue bars) with the December-quarter 2017 (gray bars).
Net exports contributed just 0.1 percentage points, which puts into perspective the importance of the so-called once-in-a-century mining boom that the nation experienced in the last decade or so and was held out as being the source of future prosperity.
Household consumption expenditure contributed 0.4 points to the overall growth result – and as indicated earlier is being driven by unsustainable growth in credit.
As worrying was the zero contribution from private investment expenditure despite record profits (I will analyse that in another blog post).
The government sector accounted for just under 25 per cent of the overall growth.
Growth in material well-being moderate in June-quarter 2018
The ABS tell us that:
A broader measure of change in national economic well-being is Real net national disposable income. This measure adjusts the volume measure of GDP for the Terms of trade effect, Real net incomes from overseas and Consumption of fixed capital.
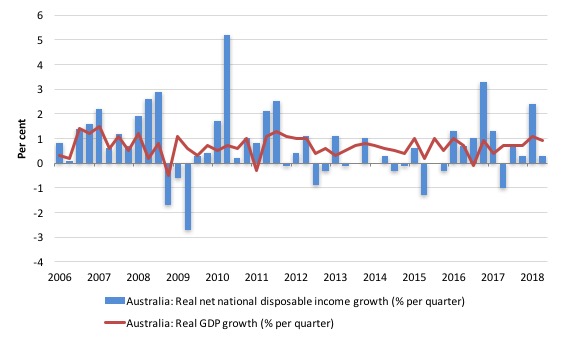
While real GDP growth (that is, total output produced in volume terms) grew by 0.9 per cent in the June-quarter 2018, real net national disposable income growth grew by just 0.3 per cent (down from 2.4 per cent last quarter).
So a very moderate pace of growth in real net national disposable income.
However, over the 12 months to March 2017, Real net national disposable income grew by 3.7 per cent, which means that Australians were significantly better off (on average) in the June-quarter 2018 in real income terms than they were twelve months prior.
The following graph shows the evolution of the quarterly growth rates for the two series since the June-quarter 2006.
Household saving ratio fell to 1 per cent
The squeeze on wages and the gouging of energy prices by the privatised electricity companies in Australia is manifesting in two ways.
1. Rising household indebtedness.
2. Falling saving out of disposable income.
Household consumption has been driven in recent quarters by credit and saving withdrawals although the growth in employee compensation in the June-quarter may alter that.
The household saving ratio is now at the lowest level since the credit-binge days of that finished in the December-quarter 2007.
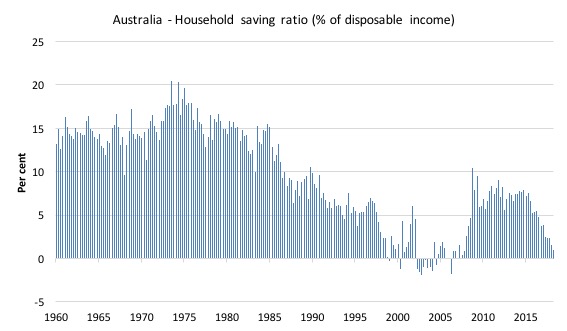
The following graph shows the household saving ratio (% of disposable income) from the March-quarter 1960 to the current period.
In the June-quarter 2016, the household saving ratio was 5.5 per cent (still much lower than historical norms).
It is now down to 1 per cent.
Prior to the crisis, households maintained very robust spending (including housing) by accumulating record levels of debt. As the crisis hit, it was only because the central bank reduced interest rates quickly, that there were not mass bankruptcies.
After the GFC hit, the household sector sought to reduce the precariousness in its balance sheet exposed by the GFC.
In June 2012, the ratio was 11.6 per cent. Since the June-quarter 2013, it has been steadily falling as the squeze on wages has intensified.
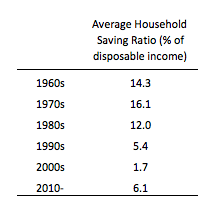
The following table shows the impact of the neoliberal era on household saving. These patterns are replicated around the world and expose our economies to the threat of financial crises much more than in pre-neoliberal decades.
Real GDP growth and hours worked
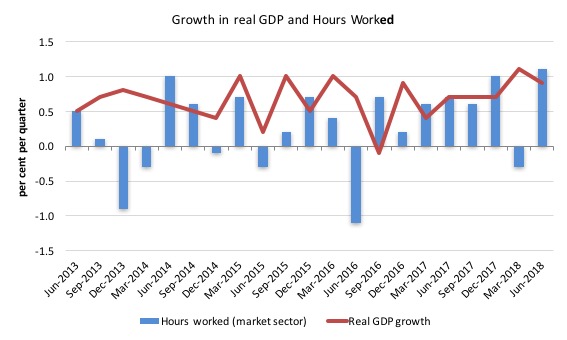
The following graph presents quarterly growth rates in real GDP and hours worked using the National Accounts data for the last five years to the June-quarter 2018.
You can see the major dislocation between the two measures persisted throughout 2013 (began in 2011) and reasserted itself in early 2016.
From then until the most recent quarter, the two series moved more or less together, despite the blip in the March-quarter 2018.
The June-quarter data shows that GDP per hour worked (productivity of labour) fell by 0.2 per cent, which is no surprise given that total hours worked rose by 1.1 per cent while real GDP rose by onlu 0.9 per cent.
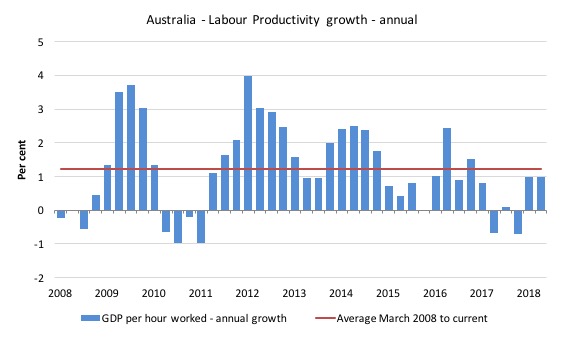
To see the above graph from a different perspective, the next graph shows the annual growth in GDP per hour worked (labour productivity) from the March-quarter 2008 quarter to the June-quarter 2018. The horizontal red line is the average annual growth since March-quarter 2008.
The relatively strong growth in labour productivity in 2012 and the mostly above average growth in 2013 and 2014 helps explain why employment growth was lagging given the real GDP growth. Growth in labour productivity means that for each output level less labour is required.
In the June-quarter 2018, annual labour productivity growth was steady at 1 per cent but still below the average growth since March-quarter 2008.
Conclusion
Remember that the National Accounts data is three months old – a rear-vision view of what has passed and to use it to predict future trends is difficult.
Coming up with assessments of where the economy is heading requires analysis of the more recent data – such as labour force surveys and the like.
But the National Accounts data indicates that the Australian economy has been reliant on household consumption growth and to a lesser extent government expenditure to keep the relatively robust growth rate going.
Overall, this is not a balanced growth outcome.
That is enough for today!
(c) Copyright 2018 William Mitchell. All Rights Reserved.
“The largest component of aggregate spending – household consumption expenditure – is being maintained even in a weak wages environment and modest growth in household disposable income because households are running down their savings.
The household saving ratio has plummetted and is approaching zero. That means that consumption growth will be increasingly reliant on ever increasing levels of debt – and household debt is already at alarming levels.”
I doubt AU has the same issue but in the US the BEA has so much junk in with household consumption that it isn’t so straightforward that households use debt to maintain their standard of living. This paper from the Fed was very interesting.
https://www.stlouisfed.org/~/media/Files/PDFs/HFS/assets/2017/JW_Mason.pdf?la=en
is it me or are the side bar charts showing incorrect Mar/Jun GDP numbers?
Dear Dr NRL (at 2018/09/05 at 3:32 pm)
No, in my rush this morning, I made a mistake. Fixed now.
Thanks very much for the feedback.
best wishes
bill
Considering the Govt has forecast a budget surplus by 2020 or thereabouts, then will this also make things worse (and will this also cause the dollar to appreciate)? Or, if the economy fails to make any traction in growth will this mean the govt will abandon their goal of a surplus?
Bill, I assume “real” GDP growth means that it’s adjusted for inflation. Is it adjusted for population growth? Surely these figures would be easier to digest if they were on a per capita or per 1 million population basis.
It would also be nice if you were able to overlay the results with labour utilisation figures in some way. In spite of the alleged focus of the government on jobs and growth, as far as I’m aware, labour utilisation trends have not improved at all over the last few years, which is surely a cause of wage stagnation.
On private investment, it’s even lower when one takes into account that much “private” investment is actually public works dressed up as private infrastructure schemes. For example, when Transurban buys Westconnex, it’s not really investing. It’s merely buying a tax farm created by the New South Wales government.
Almost without exception, the investment decision in private infrastructure projects is made by government which then puts in place the necessary subsidy, take-or-pay arrangements, tax farming authorities or other support to create a rate of return sufficient to satisfy the demands of the private infrastructure financiers. It doesn’t reflect private sector confidence. It would be cheaper and faster simply to issue bonds and call tenders.
Also, note how Australia’s savings rate decline was completely unaffected by the introduction of the Super-Duper Superannuation System (“Everyone’s a Winner!“). The savings rate didn’t recover until the scare of the GFC.
A system which currently costs $32 billion a year in fees and which failed to achieve its stated objective surely needs to be scrapped.
Any thoughts on why Australians have started eating into savings at this point?
Going into debt from Shear exhaustion at coping with spending restraint?
The wealthy few are spending down their cash mountains?
The rentier screws are making continued spending restraint impossible do to non-discretionary spending exceeding wage income?