I have received several E-mails over the last few weeks that suggest that the economics…
Reliance on household debt and a lazy corporate sector – a recipe for disaster
In yesterday’s blog post – Australian national accounts – growth continues but deep uncertainty looms (September 5, 2018), my theme was that the current period of economic growth in Australia was being built on what we might consider to be quicksand – increasing household debt and a run-down in household saving. Australia’s household saving ratio is now down to 1 per cent and falling, which is taking us back to the madness of pre-GFC. By any stretch this is an unsustainable growth path. Last Monday (September 3, 2018), the Australian Bureau of Statistics published their data series – Business Indicators, Australia, June 2018 and – Retail Trade, Australia, July 2018. The latter gives a more recent estimate of what the economy is doing, given the national accounts data that came out yesterday covers the period from April to June. Things are definitely not going in the right direction. The data shows that the benefits of growth are being disproportionately captured by profits and wages are lagging well behind. Overall, this is a recipe for disaster.
Retail sales
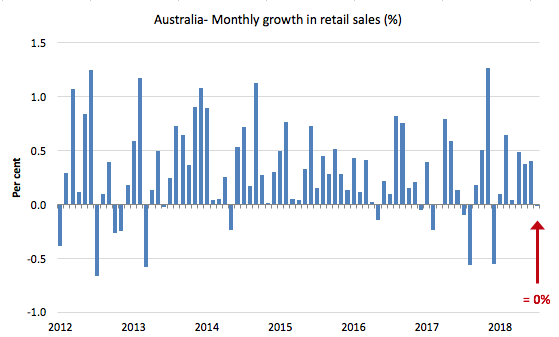
The first graph shows the monthly growth in Australian retail sales from January 2012 to July 2018. The most recent month recorded zero growth in sales.
The monthly trend growth has been stuck on 0.3 per cent since March 2018.
The annual growth rate has been in decline since mid-2015, although there was some slight positive shifts in recent months (distorted somewhat by the spike in November 2017). Once that spike disappears from the annual growth estimates, things will look very bleak indeed.
What does that mean?
Retail sales are a measure of spending on final goods and services. An economy can still grow with weak retail sales for a time – if investment spending or export revenue is strong.
But eventually, domestic demand collapses if consumption spending falls because then, investment spending stops (firms determine they have enough capacity to meet the declining sales volumes and it is too risky to invest in new capital infrastructure until things are more certain on the sales front).
Investment trends
Last Thursday, the ABS released the latest – Private New Capital Expenditure and Expected Expenditure, Australia, June 2018 – which is a quarterly publication designed to fit into the national accounts release the following week (which was yesterday).
The data shows a parlous state and there is nothing to bring the trumpet out for in the period ahead.
The ABS data shows that for the June-quarter 2018 (real and seasonally-adjusted):
- Total new capital expenditure fell 2.5 per cent for the quarter and only rose by 0.4 per cent over the 12 months to June 2018.
- Investment in Buildings and structures fell 3.9 per cent for the quarter and 4.7 per cent over the 12 months to June 2018.
- Investment in Equipment, plant and machinery fell 0.9 per cent for the quarter but rose 6.9 per cent over the 12 months to June 2018.
- Mining investment fell 7.2 per cent for the quarter and a staggering 11.1 per cent over the 12 months to June 2018.
- Manufacturing investment rose by 2.7 per cent for the quarter and by 3 per cent over the 12 months to June 2018.
- Non-Mining investment fell by 0.5 per cent for the quarter but rose by 5.8 per cent over the 12 months to June 2018.
So not a very salutory recent past.
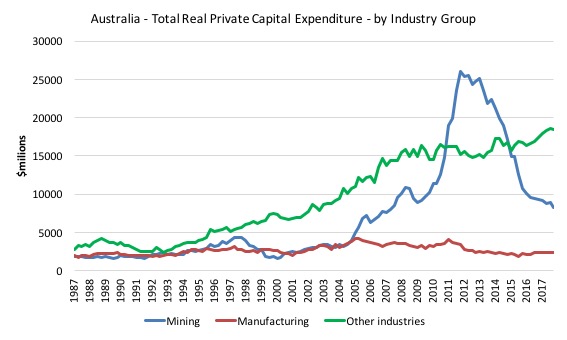
The first graph shows the real private capital expenditure by broad sector ($A millions) from the September-quarter 1987 to the June-quarter 2018.
The boom and bust in the Mining sector is quite extraordinary in historical terms.
The on-going, slow-burn decline in Australian manufacturing continues.
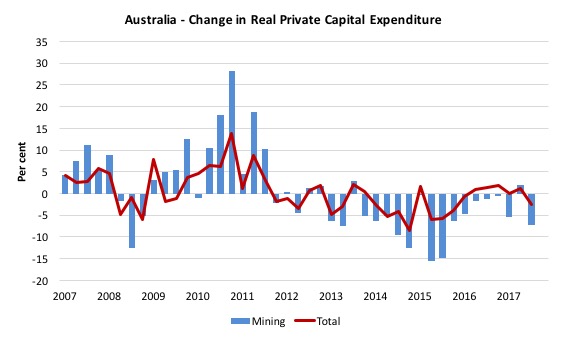
The second graph shows the quarterly growth in Mining and Total real private capital expenditure (per cent) over the same period.
Overall growth in capital formation in Australia has been skating around the zero line for years now as the indulgent business community thinks they can get better gains by lobbying for wage cuts, especially the wages of the lowest paid, and bullying government to abandon legislation aimed at our response to climate change.
But the real news from the data is the forward-looking expenditure plans signalled by the firms show that total expected investment for the next 12 months (financial year) is expected to fall by 1.7 per cent.
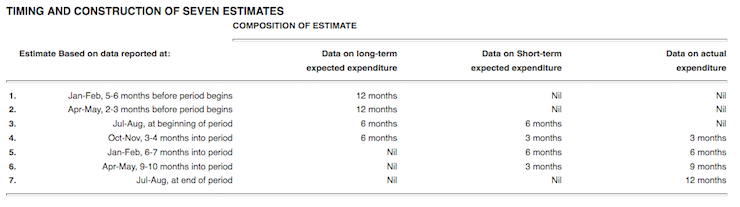
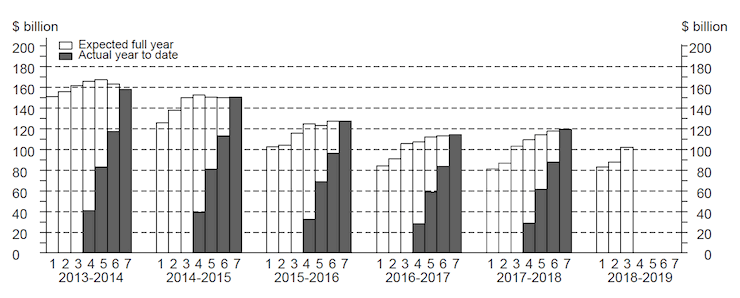
The ABS also produce very interesting data on the expected investment expenditure plans over 7 discrete quarters. The ABS conducts a survey “in the 8 or 9 week period after the end of the quarter to which the survey data relate”. They ask firms to “provide 3 basic figures”:
– Actual expenditure incurred during the reference period (Act)
– A short term expectation (E1)
– A longer term expectation (E2).
The following Table (taken from the ABS) shows you how these 7 ‘estimates’ are created and pattern of data collected:
As a result we get the following graph of Total Capital Expenditure (black columns) and Expected (clear columns), which allows us to trace the shifting expectations of expenditure (the plans) and what actually transpires.
In the July-August reporting, we get the third estimate (so at the beginning of the current financial year). So the actual data for the relevant financial year starts to flow in when the fourth forward estimate is made (noting national accounts data is three months behind).
It is clear that expected (planned) private investment expenditure for 2018-2019 is significantly lower than it was in 2017-2018.
The dramatic drop in expected investment spending in 2018-2019 signaled by Estimates 1 and 2 has been revised upward slightly, but still way down on actual and planned expenditure in 2017-2018.
If these plans are close to reality then the overall growth outlook is poor – as I indicated yesterday.
If these plans are realised and the government doesn’t relax its fiscal stance then Australia will be heading for a period of extended stagnation.
Which brings me to profits and income distribution
I recently analysed this question using a different dataset in this blog post – CEO pay binge in Australia continues while workers’ wages growth remains flat (August 6, 2018).
A related blog post is – Australia – stagnant wages growth continues (August 17, 2016).
It is always good to come at the same problem with a different dataset that is gathered using different methodologies, samples etc.
Verifying the same outcome in this way makes the results more robust.
We learned in that previous blog post that:
1. Wages growth in Australia has been very subdued over the last several years, with real wage gains difficult to achieve.
2. Wages growth is now at record low levels and real wages started falling in 2017, and in recent quarters have just kept pace with inflation.
3. There has been a massive redistribution of national income to profits and away from wage-earners as real wages growth continue to lag well behind the growth in labour productivity.
Productivity growth provides the ‘non-inflationary’ space for real wages to grow and for material standards of living to rise.
But, one of the salient features of the neoliberal era across most nations has been this on-going redistribution of national income to profits away from wages.
In other words, capital has increasingly expropriated the extra real income produced from growth in the form of profits.
The suppression of real wages growth has been a deliberate strategy of business firms, exploiting the entrenched unemployment and rising underemployment over the last two or three decades.
The aspirations of capital have been aided and abetted by a sequence of ‘pro-business’ governments who have introduced harsh industrial relations legislation to reduce the trade unions’ ability to achieve wage gains for their members. The casualisation of the labour market has also contributed to the suppression.
I considered the implications of that dynamic in this blog post – The origins of the economic crisis.
The problem is that the substantial redistribution of national income towards capital over the last 30 years has undermined the capacity of households to maintain consumption growth without recourse to debt.
One of the major reasons that household debt levels are now at dangerous, record levels is that real wages have lagged behind productivity growth and the financial market deregulate has created a host of rogue banksters who aim to push as much credit onto households as they can.
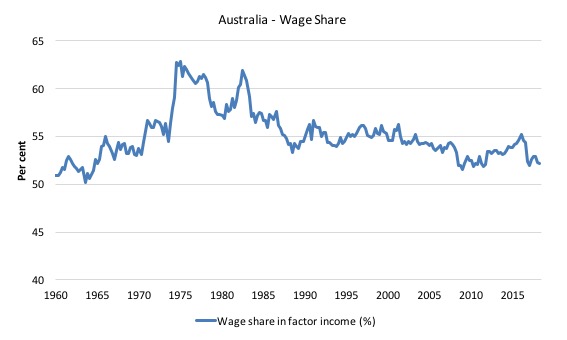
The next graph shows how the Wage Share in Total Factor Income from the March-quarter 1960 to the June-quarter 2018 has evolved in Australia.
It is clear that the share workers have been gaining has been in decline since the neoliberal period began in earnest in the 1980s.
In the March-quarter 2016, the wage share was 55.2 per cent. By the June-quarter 2018, it had fallen to a low of 52.2 per cent.
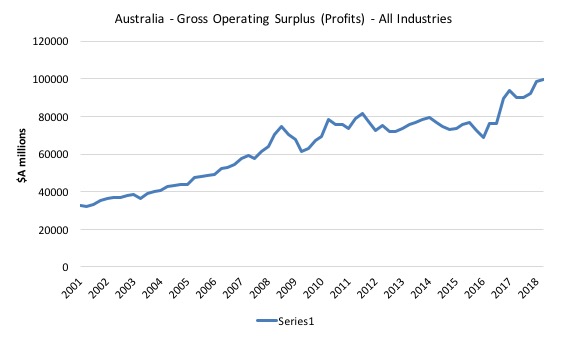
The latest Business Indicators dataset, cited in the Introduction, provides another perspective on this miserable outcome for workers.
The next graph show the movements in business profits from the March-quarter 2001 to the June-quarter 2018.
See what happens from the March-quarter 2016 (when the wages share started to decline) – business profits started to move upwards rapidly.
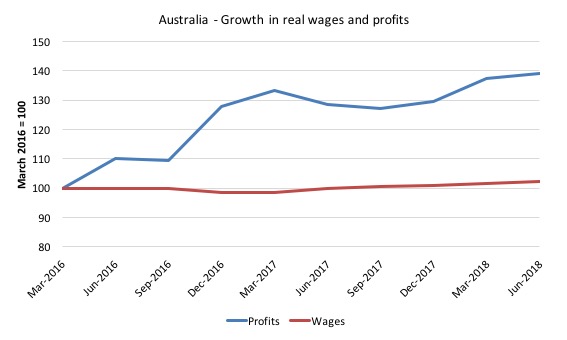
The next graph shows more of what has been going on in Australia.
It shows the profits and wages aggregates deflated by the CPI to render them in real terms and indexed at 100 in the March-quarter 2016.
Profits have grown in real terms by 39.1 per cent.
Wages have grown in real terms by 2.3 per cent.
In other words, a massively disproportionate share of real GDP growth has gone to profits over the last two and some years.
That is a recipe for disaster.
Conclusion
With booming profits, one might be tempted to think that the corporate sector would be invested strongly in the latest technology to place them in a stronger competitive position in the future.
One would be wrong. This is Australia.
Our corporate sector whines, complains, bullies, but when it comes to doing much other than take advantage of punitive government legislation and deregulation designed to tilt the playing field against the workers, it is lazy.
It has a long record of poor R&D, technical innovation, administrative incompetence, and as the Royal Commission into the Financial Services sector is revealing criminality and deception.
Australia’s growth balance is skewed towards households taking on ever increasing levels of debt and running down their savings, while national income is being redistributed to profits away from wages.
It is an unsustainable mix. A recipe for disaster.
But this is the neoliberal way – and it is repeating itself after the GFC.
That is enough for today!
(c) Copyright 2018 William Mitchell. All Rights Reserved.
See you in New York in a few weeks. It is my hope that the ‘news’ of the fiscal powers embedded in monetary sovereign nations will resonate. There is an election coming up and the progressive faction influence of the Democrat party appears ascendant.
I couldn’t believe that capital formation in Australia has been moving around zero since 2011.
Hi Bill,
Interesting as this is, I have another question. Unrelated? Irrelevant?
Why did the old Kings of England from Henry II on have so much trouble paying for their wars. Magna Carta seems to be a refutal of MMT.
What have I not understood?
Anthony Molloy (Chair of the Labour Land Campaign)
Whilst it is easy to claim that big business and profit seekers as ‘forcing’ households into debt, it doesn’t stop people taking on the debt. As it is becoming increasingly known around the traps, if people wanted to bring the capitalists down simply pay off all your debts and watch the house crumble. But people don’t want to stop spending and owning. We have so many friends who constantly complain of not having enough money and yet they spend so recklessly and on so much crap. Then there are others on the other extreme, a friend of mine recently bragging he bought a brand new car so I asked him, ‘why did you do that, why did you go into so much debt for a car?’, to which he replied ‘because I can’. There was no other reason.
@Anthony
I imagine Henry II was labouring under the illusion that precious metals were the only form of money. Absent fiat money he found himself currency constrained in a way that post Bretton Woods currency issuers are not.
Part of our problem now is that most politicians (and their electorates) are equally ill-informed about the origins and purpose of money; and even more misinformed about modern fiat operations.
For all the (rightful) bashing of the neolibs that you do Bill, there is nary a word mentioned about one of their key weapons – record high immigration. Why is that? Surely the laziest way for the corporate world to grow profits is to simply import customers.
Very similar to the greens – supposedly environmentalists but in favour of open borders? Total contradiction.
Anthony Molloy and eg,
Henry II would actually have been well aware of types of money other than precious metals, because Henry I introduced tally sticks to Britain in a big way around 1100AD. Far as I can see, Henry I did what all issuers of base money do, which is announce they’re going to collect taxes while also announcing that the king’s home made money can be used in payment of those taxeds. That created a demand for the sticks, so Henry I used the sticks to buy the stuff he wanted: palaces, mistresses, the mind boggles….:-)
See the Wiki article on tally sticks.
My understanding is that it was the other way around…taxes and rents were paid in real goods and services first under fuedal tenures and then the tally stick system created a means to pre-purchase taxes and the sticks acted as proof of payment which could be circulated…not that it really matters exaclty how it happened
I like Randy Wray’s discussion of the origins and functions of the Bank of England in _Money and Credit in Capitalist Economies: The Endogenous Money Approach_! This institution was created largely to pay for government operations, including of course war. The subsequent ebb and flow of the gold standard also mattered, of course. (Backed currencies of any kind are not sovereign currencies at all.) That would be the first realistically modern British central bank that could have acted in the way MMT describes during a war or any other time, though other, less modern, unbacked moneys such as tally sticks of course had been around a long time. I also look forward to Bill’s answer. Greg Hannsgen
First, I forgot to say the above comment was meant to be in reply to Anthony’s comment near the top. Second, thanks for the analysis of the Australian situation, Bill. It is interesting to see your analysis of the problems generated by neoliberal economic policies. It really is the same old story seen in various forms around the world. Third, also addressing a point from Anthony, I take note the conference with interest and hope it goes well but will be in Amherst myself.