Yesterday (April 24, 2024), the Australian Bureau of Statistics (ABS) released the latest - Consumer…
Australian inflation data defies mainstream macro predictions – again
One of the on-going myths that mainstream (New Keynesian) economists propagate is that monetary policy (adjusting of interest rates) is an effective way to manage the economic cycle. They claim that central banks can effectively manipulate total spending by adjusting the cost of borrowing to increase output and push up the inflation rate. The empirical experience does not accord with those assertions. Central bankers around the world have been demonstrating how weak monetary policy is in trying to stimulate demand. They have been massively building up their balance sheets through QE to push their inflation rates up without much success. Further, it has been claimed that a sustained period of low interest rates would be inflationary. Well, again the empirical evidence doesn’t support that claim. The evidence supports the Modern Monetary Theory (MMT) preference for fiscal policy over monetary policy. Even though the Reserve Bank of Australia has not pursued a QE program (fiscal policy saved our economy from recession during the GFC), it has persisted with very low historic interest rates. And as yesterday’s latest inflation data from the Australian Bureau of Statistics – Consumer Price Index, Australia – shows, the RBA is struggling to push it inflation rate into the so-called target policy range of 2 to 3 per cent. The data shows that the All Groups CPI grew by 1.9 per cent in the 12 months to September 2018 and the so-called core analytical series – Weighted Median and Trimmed Mean – used by the RBA to assess whether interest rates should shift or not grew by less than that. The most reliable measure of inflationary expectations are flat and below the RBA’s target policy range.
The summary Consumer Price Index results for the September-quarter 2018 are as follows:
- The All Groups CPI rose by 0.4 per cent and has been steady for the last three quarters.
- The All Groups CPI rose by 1.9 per cent over the 12 months to the September-quarter 2018, compared to the annualised rise of 2.2 per cent over the 12 months to June-quarter 2018.
- The Trimmed mean series rose by 0.4 per cent in the September-quarter 2018 (steady) and by 1.8 per cent over the previous year (steady).
- The Weighted median series rose by 0.3 per cent in the September-quarter 2018 (0.4 per cent in the June-quarter 2018) and by 1.7 per cent over the previous year (steady).
While the Australian debate has not been centred on any QE myths – that is, the Reserve Bank of Australia (RBA) has not engaged in any widespread asset purchases unlike its counterparts in Europe, the UK, Japan, the US – there is still an obsession that inflation is just about to accelerate and this will force the RBA to increase interest rates.
Even though inflation has been benign now for some quarters, the market economists (banks) still think it is about to accelerate and the RBA will be hiking interest rates.
But the reality is quite the opposite.
If anything, the pressure is now on the RBA to reduce interest rates given that their preferred measures (see below) are now consistently below their targetting range (2 to 3 per cent).
What is apparent from yesterday’s inflation figures and the most recent labour market data is that there is plenty of room for further fiscal stimulus to boost growth towards its trend level and reduce unemployment and underemployment.
Trends in inflation
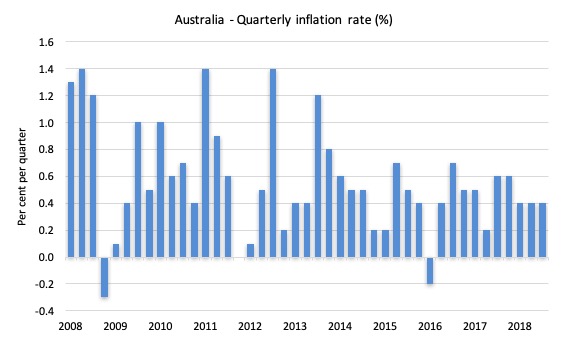
The headline inflation rate increased by 0.4 per cent in the September-quarter 2018 and 1.9 per cent over the 12 months to September (down from 2.2 per cent in the previous quarter).
Inflation has been fairly steady over the 2018 despite a sizeable depreciation in the exchange rate (see below).
The following graph shows the quarterly inflation rate since the March-quarter 2008. There is clearly no breakout trend emerging.
The next graph shows the annual headline inflation rate since the first-quarter 2002. The black line is a simple regression trend line depicting the general tendency. The shaded area is the RBA’s so-called targetting range (but read below for an interpretation).
The trend inflation rate is quite steeply downwards.
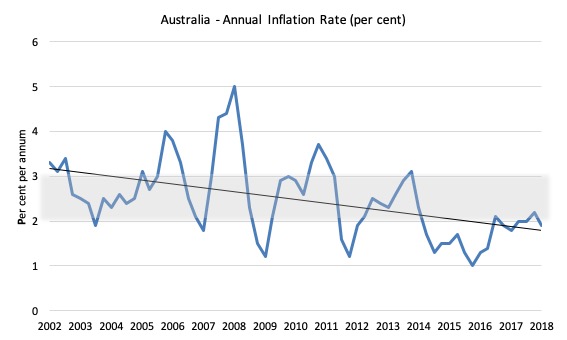
Once we take out the so-called ‘volatile’ items (food and fuel), the annual inflation rate is only 1.6 per cent. Well below the RBA’s target range.
Petrol prices rose by more than 5 per cent in September and that will probably impact on the December-quarter figure.
It was claimed when the Labour Force data came out for September that as the unemployment rate had fallen to 5 per cent that wage pressures would start to seep into the inflation figures.
I analysed that argument in this blog post – Australian labour market weaker – no employment growth and participation down (October 18, 2018).
The point is that the lower unemployment rate was not a sign of strength emerging. It was driven by a decline in participation arising from slack employment growth.
The mainstream commentators were completely wrong on that score when the ABS released the data.
Further underemployment remains persistently high and, combined with the poor employment growth, is creating flat wages growth conditions.
There will be no major wages push in the inflation data for the foreseeable future.
What is driving inflation in Australia?
The following bar chart compares the contributions to the quarterly change in the CPI for the September-quarter 2018 (green bars) compared to the June-quarter 2018 (blue bars).
Note that Utilities is a sub-group of Housing.
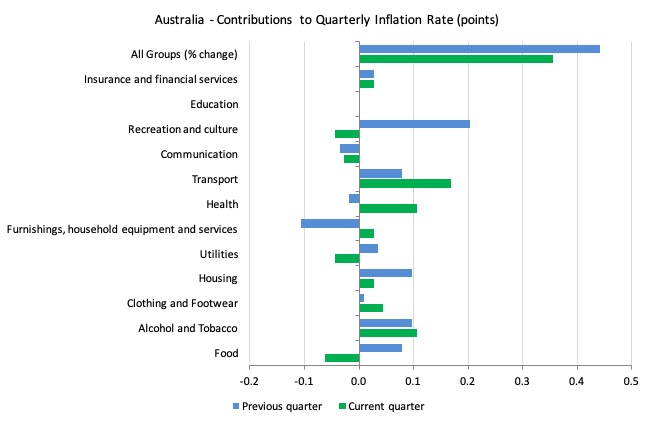
The ABS say that:
- The most significant price rises this quarter are international holiday travel and accommodation (+4.3%), domestic holiday travel and accommodation (+2.4%), tobacco (+1.8%) and automotive fuel (+1.4%).
- The most significant offsetting price falls this quarter are child care (-11.8%) and telecommunications equipment and services (-1.5%).
Under Recreation and culture, the main driver was “international holiday travel and accommodation … The rise in international holiday travel and accommodation is due to the summer peak seasons in Europe and America.”
So even though our currency depreciated steadily over the quarter, Australians still were able to take holidays abroad.
The rise in tobacco prices “is due to the effects of the 12.5% federal excise tax increase” – so a government impost.
And the increase in fuel “is due to continued increases in world oil prices flowing through to consumers.”
So even though the currency has depreciated by 12.1 per cent since February 29, 2018, the ABS report that:
… the tradables component of the All groups CPI rose 0.1% and the non-tradables component rose 0.2%.
This tells you something about the extent of exchange rate pass through effects and the likelihood in a small, open economy exporting primary commodities, that a depreciating exchange rate will be highly inflationary. In Australia’s case, that probability is low.
The next graph provides shows the contributions in points to the annual inflation rate by the various components.
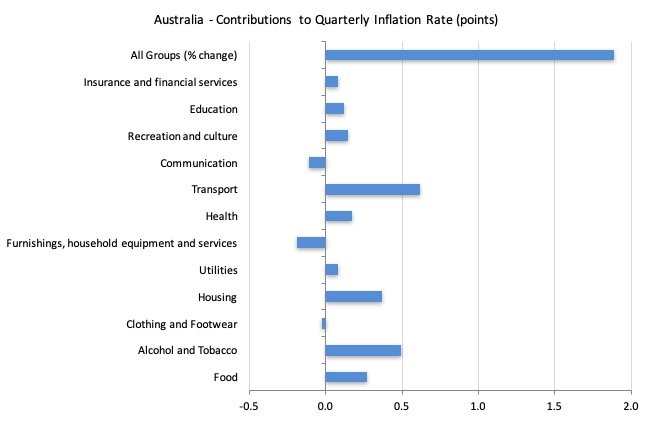
In the twelve months to the end of September 2018, the major drivers of inflation were Housing (energy), Transport (petrol), and Alcohol and Tobacco Prices (government policy).
Inflation and Expected Inflation
I mentioned at the outset, the on-going inflation obsession among market players.
If you examine the market trends in speculative trades then it is clear that the traders were betting on a major shift in the RBA policy upwards after 2016 because they have been punting on a substantial rise in inflation.
They have been systematically wrong on that front.
More recently, it is clear their expectations have been falling as the RBA holds to its low interest rate regime.
Significantly, it is this misplaced fear of inflation, that, in place, drives the misplaced preference by New Keynesians for counter-stabilising monetary policy instead of fiscal policy.
If we went back to 2009 and examined all of the commentary from the so-called experts we would find an overwhelming emphasis on the so-called inflation risk arising from the fiscal stimulus. The predictions of rising inflation and interest rates dominated the policy discussions.
The fact is that there was no basis for those predictions in 2009 and nine years later no major inflation outbreak is forthcoming.
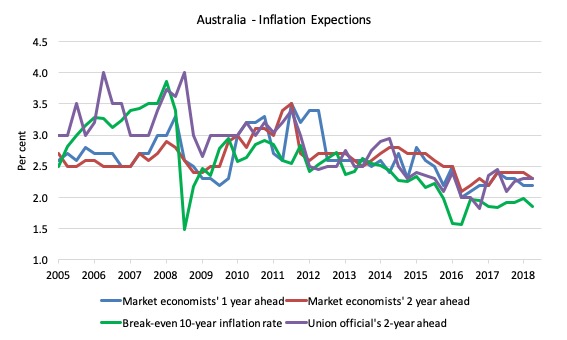
The following graph shows four measures of expected inflation expectations produced by the RBA – Inflation Expectations – G3 – from the June-quarter 2005 to the September-quarter 2018.
The four measures are:
1. Market economists’ inflation expectations – 1-year ahead.
2. Market economists’ inflation expectations – 2-year ahead – so what they think inflation will be in 2 years time.
3. Break-even 10-year inflation rate – The average annual inflation rate implied by the difference between 10-year nominal bond yield and 10-year inflation indexed bond yield. This is a measure of the market sentiment to inflation risk.
4. Union officials’ inflation expectations – 2-year ahead.
Notwithstanding the systematic errors in the forecasts, the price expectations (as measured by these series) are trending down in Australia, which will influence a host of other nominal aggregates such as wage demands and price margins.
The market economists’ one-year and two-year ahead expectations are well above the Break-even 10-year inflation rate. Even Union officials have fallen for the accelerating inflation outlook.
It is well known that the ‘market economists’ systematically get movements in the economy wrong and one wonders if their organisations actually bet money on their analysis!
The most reliable measure – the Break-even 10-year inflation rate – is now at 1.9 per cent, well below the lower bound of the RBA targetting range but spot on where the actual raw inflation rate came in at.
It has been at or below the lower bound of the RBA’s policy target range since March 2016.
The other expectations are still lagging behind the actual inflation rate, which means that forecasters progressively catch up to their previous forecast errors rather than instantaneously adjust, a further piece of evidence that refutes the mainstream economics hypothesis that decision makers use ‘rational expectations’ (that is, on average get it right).
Implications for monetary policy
What does this all mean for monetary policy?
Clearly, the market economists were punting on a rise in the interest rate and have only started to realise in the last few quarters that this is unlikely to happen any time soon (as disclosed by their inflationary expectations above).
The inflation trends highlighted in yesterday’s data release provide no basis for any expectation that the RBA will hike interest rates anytime soon.
In fact, if anything, the pressure is now on the RBA to cut rates again.
The Consumer Price Index (CPI) is designed to reflect a broad basket of goods and services (the ‘regimen’) which are representative of the cost of living. You can learn more about the CPI regimen HERE.
Please read my blog – Australian inflation trending down – lower oil prices and subdued economy – for a detailed discussion about the use of the headline rate of inflation and other analytical inflation measures.
The RBA’s formal inflation targeting rule aims to keep annual inflation rate (measured by the consumer price index) between 2 and 3 per cent over the medium term. Their so-called ‘forward-looking’ agenda is not clear – what time period etc – so it is difficult to be precise in relating the ABS data to the RBA thinking.
What we do know is that they do not rely on the ‘headline’ inflation rate. Instead, they use two measures of underlying inflation which attempt to net out the most volatile price movements.
To understand the difference between the headline rate and other non-volatile measures of inflation, you might like to read the March 2010 RBA Bulletin which contains an interesting article – Measures of Underlying Inflation. That article explains the different inflation measures the RBA considers and the logic behind them.
The concept of underlying inflation is an attempt to separate the trend (“the persistent component of inflation) from the short-term fluctuations in prices. The main source of short-term ‘noise’ comes from “fluctuations in commodity markets and agricultural conditions, policy changes, or seasonal or infrequent price resetting”.
The RBA uses several different measures of underlying inflation which are generally categorised as ‘exclusion-based measures’ and ‘trimmed-mean measures’.
So, you can exclude “a particular set of volatile items – namely fruit, vegetables and automotive fuel” to get a better picture of the “persistent inflation pressures in the economy”. The main weaknesses with this method is that there can be “large temporary movements in components of the CPI that are not excluded” and volatile components can still be trending up (as in energy prices) or down.
The alternative trimmed-mean measures are popular among central bankers.
The authors say:
The trimmed-mean rate of inflation is defined as the average rate of inflation after “trimming” away a certain percentage of the distribution of price changes at both ends of that distribution. These measures are calculated by ordering the seasonally adjusted price changes for all CPI components in any period from lowest to highest, trimming away those that lie at the two outer edges of the distribution of price changes for that period, and then calculating an average inflation rate from the remaining set of price changes.
So you get some measure of central tendency not by exclusion but by giving lower weighting to volatile elements. Two trimmed measures are used by the RBA: (a) “the 15 per cent trimmed mean (which trims away the 15 per cent of items with both the smallest and largest price changes)”; and (b) “the weighted median (which is the price change at the 50th percentile by weight of the distribution of price changes)”.
Please read my blog – Australian inflation trending down – lower oil prices and subdued economy – for a more detailed discussion.
So what has been happening with these different measures?
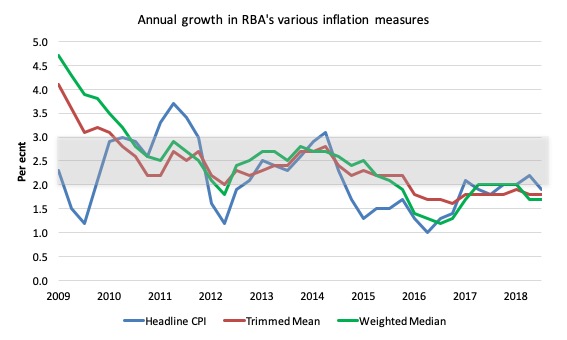
The following graph shows the three main inflation series published by the ABS since the March-quarter 2009 – the annual percentage change in the All items CPI (blue line); the annual changes in the weighted median (green line) and the trimmed mean (red line).
The RBAs inflation targetting band is 2 to 3 per cent (shaded area). The data is seasonally-adjusted.
The three measures are all currently below the RBA’s targetting range:
1. CPI measure of inflation – 1.9 per cent and below the RBAs target band for the last two years.
2. The RBAs preferred measures – the Trimmed Mean (1.8 per cent and stable) and the Weighted Median (1.7 per cent and stable) – are also below the lower bound of the RBAs targetting range of 2 to 3 per cent.
How to we assess these results?
First, despite the depreciating Australian dollar since February, there is clearly no pressures coming from the traded-goods sector to push the inflation rate above the target range.
Second, there is clearly a downward trend in all of the measures. The “core” measures used by the RBA have been benign for many quarters even with an on-going significant fiscal deficit and record low interest rates.
Third, the RBA will also be mindful that real GDP growth is still below trend and the labour market is still in an uncertain-to-vulnerable state, with broad labour underutilisation still above 13 per cent (or more).
In terms of their legislative obligations to maintain full employment and price stability, one would think the RBA would have to cut interest rates in the coming month given the state of the economy and the benign inflation environment.
Further, as I have noted elsewhere, wages growth is flat and at record lows.
Fourth, inflationary expectations are benign and trending downwards.
My view is that the RBA should cut rates now that all three measures have been consistently below the targetting range.
Conclusion
Just before the GFC hit all the macroeconomic policy talk in Australia was about getting deficits down and into surplus to ensure that inflation didn’t accelerate.
It was nonsensical talk even then, when economic growth was stronger and unemployment lower.
The doomsayers were completely wrong when they predicted the fiscal stimulus in 2008-09 would generate dangerous inflation impulses.
The trend has been down for some years now and some nations are fighting deflation rather than inflation.
Australia is now a member of the low-inflation brigade despite GDP growth continuing (albeit below trend) and the exchange rate depreciating significantly over the course of this year.
Interest rates remain low and even the bank economists are starting to revise their inflationary expectations downwards as they realise the predictions coming out of mainstream macroeconomic models are useless.
That is enough for today!
(c) Copyright 2018 William Mitchell. All Rights Reserved.
If I recall correctly, during the Great Depression of the 1930s initial efforts to spur investment concentrated on lower interest rates and injecting money into the private banking system (liquidity). Didn’t really work well. What did work was direct spending. For example, building out the TVA was an excellent project, but back then there were few implements that used electricity. The administration made direct loans to farmers so they could buy equipment that used electricity. Worked like magic.
Australia interest rate V’s inflation rate
https://d3fy651gv2fhd3.cloudfront.net/charts/australia-interest-rate.png?s=rbatctr&v=201810020448y&d1=20130101&d2=20181231&url2=/australia/inflation-cpi
It seems that the central bank understands that the inflation rate follows the interest rate and it is great to see that they while inflation started going up in 2016 they never had the urge to raise rates to fight it. Which would have made inflation go higher.
Increased cost of credit gets passed onto the consumer via higher prices and you also have the interest income channels which is like basic income for anyone who holds the Aussie. The bigger the debt to GDP ratio the larger the effect.
When the inflation rate hit 3% in 2014. They did the right thing and cut interest rates all the way down until inflation hit 1%
Compare that with the FED and the Bank Of Canada and the BOE who raise interest rates to fight inflation which only makes things worse.
Turkey and Argentina would have the strongest currencies in the world if raising rates does what it says on the tin. Rate hikes do the exact opposite of what they say they do all else equal.
Warren has been saying it for years.
I hate conspiracy theories and like real data otherwise I would be on Alex Jones site howling at the moon.
But I cannot accept that central banks don’t understand interest rates. As Warren has pointed out using the ECB and Draghi they use double speak to fool portfolio managers into doing what central banks want them to do.
” More recently, what the central bank has been doing, what Draghi’s been doing, has been tricking the world’s portfolio managers into selling euro by doing things that they think are inflationary, that they think are expansionary, things that cause a currency to go down, and those are negative interest rates and quantitative easing. All the world’s Western-educated now, they’ve all gone to The University of Chicago and Stanford and the London School of Economics, and they all know that pumping up the money supply through quantitative easing and negative rates makes the currency to go down and it causes inflation. They’re wrong, because it doesn’t, as I explained before. In fact, those policies remove interest income, they’re taxes on the economy, they actually cause the currency to get stronger, they cause the price pressures to go lower, you get deflationary pressures instead of inflationary pressures. We’ve seen the deflationary pressures on the euro right now, bordering on deflation. And the policies of quantitative easing and negative rates have done nothing to ease that ”
This is way more than an innocent fraud. What is at work is an Orwellian strategy of rhetorical deception. It was a bright cold day in November, and the clocks were striking thirteen. War is peace. Freedom is slavery. Ignorance is strength.
I’m comming to the conclusion that economic students that study in the west or encourage neoliberal globalisation are being used as Trojan Horses.
What I mean by that. Is when they go back home and get a top job in their government they have learned all the wrong tools and when implemented makes matters worse.
For example. Say a country does not want to go down the neoliberal gloabalist model route and instead tries to create a better progressive society. Mr Market will be uneashed on their ass. We have seen it a hundred times as the hedge funds and the rating agencies and the IMF and World Bank do their worst and act as lobbying firms for the Finance, Insurance, and Real estate sectors.
The Trojan horse that has been implanted back home will pull all the wrong economic leavers trying to protect their country and only make matters worse whilst furthering the IMF agenda. Until they have no option but to conceed and be prepared to be asset stripped. Shared between the commercial banks like a carcass on bond vigilante savannah across the Serengeti.
Self imposed constraints implemented by parliaments and international treaties that have politicised central banks and the monetary system. All in the name of an ideology and a geopolitical agenda. In my view more imperialistic than innocent fraud.
Is that a conspiracy theory or what we see happening time and time again ?? Or am I in danger of jumping the shark and they really are that stupid and don’t how central banks work after running them for hundreds of years ?
Derek- do you have a link to the source of that quote from Warren? Thanks.
Simon
There’s a fantastic economic paper still to be written
1. A time line from 1950 to 2018 that shows when the self imposed constraints were implemented on the UK monetary system. The deregulation of the Finance, Insurance, and Real estate sectors along with the numerous treaties of the European Union with the seperation of the BOE via Mastricht.
2. Showing what these self imposed constraints meant and how they were pushed through by lobbyists from the Finance, Insurance, and Real estate sectors
3. Which brought in the era of privatisations as The bankers of Wall Street and the City of London scream for balanced budgets or budget surpluses and created the household budget narrative. They created a privatised monopoly in a way that will generate profits for the new owners, along with interest for the bondholders and the banks that fund it; and also, management fees. Most of all, the privatised enterprises should generate capital gains for the stockholders as they jack up prices for hitherto public services. That wall Street and the City of London should allocate reources and that governments shouldn’t act like governments and should starve the government to save the wealthy. Starve the government to a point where it can be rendered useless and become depoliticised.
4. Which ultimately ended with the crash that showed the Finance, Insurance, and Real estate sectors were actually useless at allocating resources that left a trail of private debt from John O groats to lands end. Whilst the rentier class owned all of the wealth.
i) To reduce economies to debt dependency, to transfer public utilities into creditor hands, and then to create a rent-extracting tollbooth economy.
ii) The financial objective is to block governments from writing down debts when bankers and bondholders over-lend.
iii) Taken together, these policies create a one-sided freedom for rentiers that bastardised the classical “Adam Smith” view of free markets. It is a freedom to reduce the indebted majority to a state of deepening dependency, and to gain wealth by stripping public assets built up over the centuries.
iv) That leaves most of society in debt bondage as now over 70% of wages are used to pay econmomic rent payments to the rentier class. Rent, loans, credit cards, mortgages and Instead of providing free or subsidised schooling, they can make people pay for it to get a college education. They can turn the roads into toll roads. They can charge people for water, and they can charge for what used to be given for free under the old style of Roosevelt capitalism and social democracy.
5) One of the best contricks was still to come…
To enable lending to proceed when the IMF’s sustainability criteria were not met, its bureaucrats designed the “systemic risk waiver.”
It was a model of circular reasoning that might well be taught to philosophy students. Severe debt crises all carry the risks of systemic spillovers, notes Schadler. The global financial system was deemed to be endangered if a debt payment was missed or a haircut imposed on bondholders, because “confidence” was threatened.
Any haircut for bondholders might cause panic and “contagion.” So it doesn’t matter what IMF economists say regarding debt sustainability. The IMF is committed to preserving “confidence” at all costs – confidence that the troika will lend governments enough to pay their bondholders and speculators in full (but not pension funds).
The systemic risk waiver means that no bondholder should lose. Governments must pay for the losses from risky loans, or else there will be “contagion.”
What a beauty that fooled so many. “systemic risk waiver.” was short for privatise the profits and socialise the losses. As the new financial world order had shaped most of the Western world for decades to come.
Yes Simon,
If you go to underground network website run by Charles Como. It’s an Interview about Money, the Euro and Greece with Warren I’ll post the link.
The transcript is under the radio interview.
Simon here is the link
https://underground.net/warren-mosler-interview-about-money-the-euro-and-greece-dialogos-radio/
These smaller countries that are standing in line to join the Euro have no idea what’s going to hit them.
A Quadrillion Tonne imperialistic juggernaut that will leave them with nothing more than an ole pair of budgie smugglers worn by Wile E. Coyote
Has a shift from QE to QT at the Fed, BoJ etc..begun??
The sectoral balances show that this year the National government in Australia is spending AUD$15B less than last year. The actual numbers are coming in worse than that and could be well over AUD$15B less spending. This is deflationary. A national government surplus will be even more deflationary as it is a net destruction of money. One cannot get inflation if there is less money around unless there is an over-matching supply side loss at the same time. All other things equal there must be deflation if the money supply is reduced and that is why the RBA cannot achieve its worthless inflation target.
Okay Bill, now you have to tell us where do you get the time to write such long articles on a daily basis?? I don t even have time to read them all every day! Please write a book on time management.
“Is that a conspiracy theory or what we see happening time and time again ?? Or am I in danger of jumping the shark and they really are that stupid and don’t how central banks work after running them for hundreds of years ?”
Pretty sure you’re right. We’ve seen quotes here from the IMF, ECB, Fed, BOE, Hayek, Friedman and others that imply they know monetarism is doesn’t add up. Occam’s Razor and Orwell’s quote (“He who controls the past controls the future”) tell me the understand very well the necessity of indoctrination.
Just a side note to people.
Always remain polite when discussing MMT even when people simply refuse to listen to the very logic that they use on a daily basis.
If they choose to remain Neanderthal-like it because they need more time.
Spend time on those who will listen.
That will help the people like Bill in the long run.
Creating a bad name will make things tougher.
Thx for you time