Today (March 6, 2024), the Australian Bureau of Statistics released the latest - Australian National…
Australian national accounts – economy is slowing and looking shaky
The Australian Bureau of Statistics released the latest September-quarter 2018 National Accounts data today (December 5, 2018) and the result show that in the past three months, the Australia economy has slowed considerably. The quarterly growth rate fell to just 0.3 per cent and 2.8 per cent (down from 3.4) over the 12 months to September 2018. However, the annual result is influenced by the outlier March-quarter. The annualised growth rate is really around 1.2 per cent, which is very poor. The economy remains reliant on household consumption expenditure, which, in turn, is being driven by credit and declining savings as household income growth moderates. Exports provided no growth filip. The large government infrastructure projects (State-level) are driving growth and without the government contribution in the September-quarter, the Australian economy would have recorded a zero growth rate. The contribution from private investment was negative and the outlook is not bright. That is an unsustainable mix. There is a high probability that household consumption expenditure will slow right down as debt levels become unmanageable. Whether that happens will depend on the wages growth trajectory in future quarters and the outlook on that front is mixed. All this means that the current overall growth trajectory is shaky.
The main features of the National Accounts release for the September-quarter 2018 were (seasonally adjusted):
- Real GDP increased by 0.3 per cent for the quarter – a sign of a much weaker economy. The annual growth rate was 2.8 per cent (down from 3.4 per cent) but that was influenced by the outlier March-quarter. The annualised growth rate is really around 1.2 per cent.
- The main positive contributors to real GDP growth were household consumption expenditure (0.2 points), general government consumption expenditure (0.1 points) and government investment (0.2 points).
- The main negative contributing factor was private investment expenditure (-0.1 points).
- Australia’s Terms of Trade (seasonally adjusted) rose by 0.8 per cent in the quarter and 2.8 per cent over the 12 month period.
- Real net national disposable income, which is a broader measure of change in national economic well-being rose by just 0.1 per cent for the quarter and 2.9 per cent for the 12 months to the September-quarter 2018, which means that Australians are better off (on average) than they were at that point 12 months ago.
- The Household saving ratio (from disposable income) fell to 2.4 per cent, well below the levels that were observed following the GFC. It is now at it lowest level since the December-quarter 2007.
Overall growth picture – slowing and looking shaky
The ABS – Press Release – said that:
The Australian economy grew 0.3 per cent in seasonally adjusted chain volume terms in the September quarter 2018 … The household sector drove domestic growth with increased consumption supported by moderate rises in household income …
Household consumption rose 0.3 per cent driven by non-discretionary spending on food and housing. Spending on discretionary items slowed during the quarter. Household gross disposable income continued to grow at a slow pace …
The subdued growth in gross disposable income coupled with an increase in household consumption resulted in the household saving ratio declining to 2.4 per cent in the September quarter. This is the lowest saving rate since December 2007.
Public spending was funded through increased revenue. General government final consumption expenditure increased 0.5 per cent underpinned by continued expenditure in health, aged care and disability services. Public investment remained at high levels with continued work on a number of large infrastructure projects around the nation.
First, household consumption expenditure growth is moderating and is reliant on the run down of savings and rising debt.
Second, the “lowest saving rate since December 2007” is why the outlook is shaky.
The largest component of aggregate spending – household consumption expenditure – is being maintained even in a weak wages environment and modest growth in household disposable income because households are running down their savings.
The household saving ratio has plummetted and is approaching zero. That means that consumption growth will be increasingly reliant on ever increasing levels of debt – and household debt is already at alarming levels.
Whether a credit crunch is coming – along the lines that the RBA has been warning about – is yet to be seen. But how at present the spending side of the Australian economy is unbalanced (reliant on unsustainable debt) and cannot be sustained indefinitely.
Third, the big public infrastructure projects which are helping at present are obviously finite and are within an environment where the federal government is obsessed with recording a surplus.
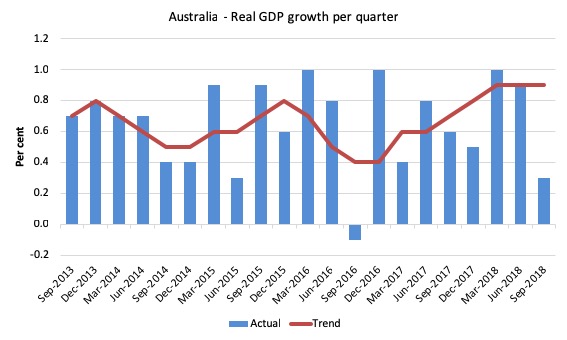
The first graph shows the quarterly growth over the last five years (with the red line being the ABS moving average trend). The trend growth is flattening again suggesting that the spike in quarterly growth for March was not the sign of a new period of above-trend growth.
Analysis of Expenditure Components
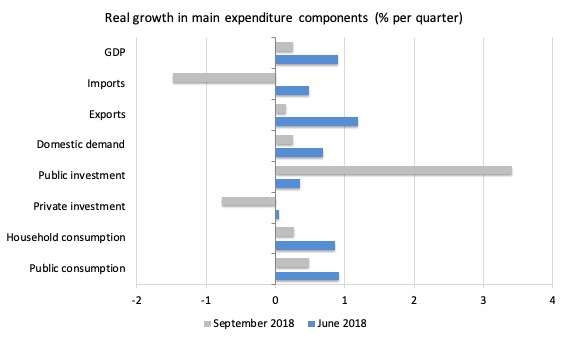
The following graph shows the quarterly percentage growth for the major expenditure components in real terms for the June-quarter 2018 (blue bars) and the September-quarter 2018 (grey bars).
The overall growth performance is being driven by the strength of domestic demand – household and government expenditure.
Without the strong public investment expenditure growth would now be negative (see below).
Private investment expenditure growth declined by 0.77 per cent and has been slowing since the start of the year.
Contributions to growth
What components of expenditure added to and subtracted from the 0.3 per cent real GDP growth in the September-quarter 2018?
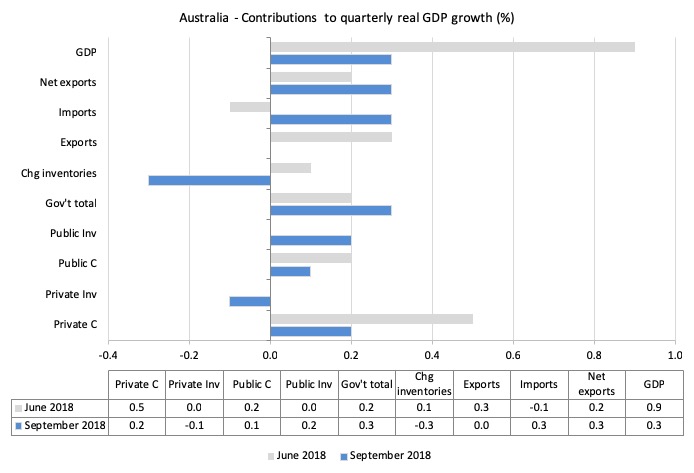
The following bar graph shows the contributions to real GDP growth (in percentage points) for the main expenditure categories. It compares the September-quarter 2018 contributions (blue bars) with the June-quarter 2018 (gray bars).
Net exports contributed 0.3 percentage points but it was due to the negative growth in imports for the quarter.
Exports, themselves, contributed nothing to growth, which puts into perspective the claims of the so-called once-in-a-century mining boom that the nation experienced in the last decade or so and was held out as being the source of future prosperity.
Household consumption expenditure contributed 0.2 points to the overall growth result – and as indicated earlier is being driven by unsustainable growth in credit and declining saving. This contribution is falling.
Private investment expenditure undermined growth by 0.1 points.
The government sector contributed 0.3 points to the overall growth result and without it, the Australian economy would have been going backwards (given the multipliers).
Growth in material declining in September-quarter 2018
The ABS tell us that:
A broader measure of change in national economic well-being is Real net national disposable income. This measure adjusts the volume measure of GDP for the Terms of trade effect, Real net incomes from overseas and Consumption of fixed capital.
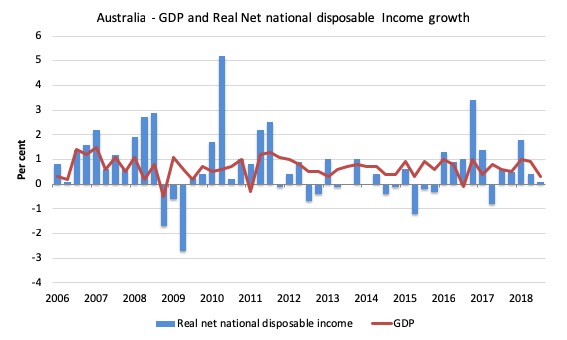
While real GDP growth (that is, total output produced in volume terms) grew by 0.3 per cent in the September-quarter 2018, real net national disposable income growth grew by just 0.1 per cent (down from 0.4 per cent last quarter).
Real net national disposable income growth has slowed considerably since the beginning of 2018.
However, over the 12 months to the September-quarter 2018, Real net national disposable income grew by 2.9 per cent, which means that Australians were significantly better off (on average) in real income terms than they were twelve months prior.
But that result is distorted by the March-quarter outlier and will come down in subsequent quarters given the recent trends.
The following graph shows the evolution of the quarterly growth rates for the two series since the September-quarter 2006.
Household saving ratio continues decline towards zero
The squeeze on wages and the gouging of energy prices by the privatised electricity companies in Australia is manifesting in two ways.
1. Rising household indebtedness.
2. Falling saving out of disposable income.
Household consumption has been driven in recent quarters by credit and saving withdrawals.
The household saving ratio is now at the lowest level since the credit-binge days of that finished in the December-quarter 2007.
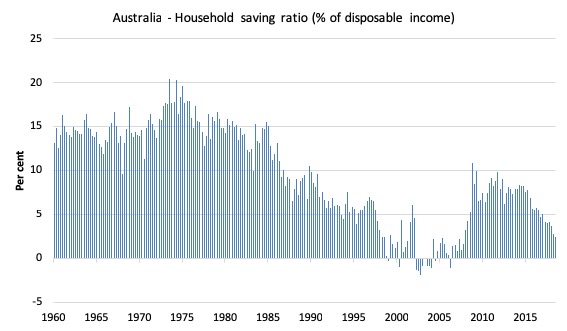
The following graph shows the household saving ratio (% of disposable income) from the March-quarter 1960 to the current period.
In the December-quarter 2008, the ratio was 10.9 per cent having risen sharply in the early days of the GFC as households tried to stabilise the record debt situation.
Once the GFC threat was contained by the massive fiscal stimulus, the saving ratio began to fall again, especially as the squeze on wages has intensified.
In the September-quarter 2016, the household saving ratio was 5.5 per cent (still much lower than historical norms).
It is now down to 2.4 per cent.
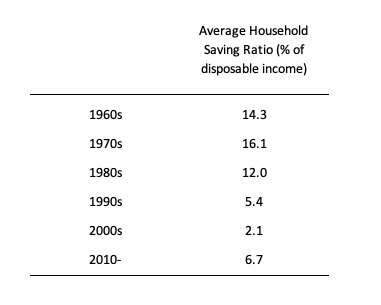
The following table shows the impact of the neoliberal era on household saving. These patterns are replicated around the world and expose our economies to the threat of financial crises much more than in pre-neoliberal decades.
Real GDP growth and hours worked
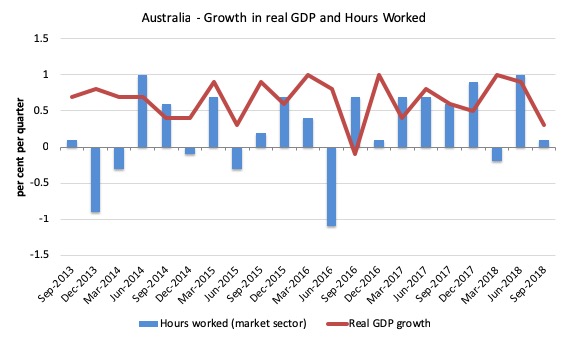
The following graph presents quarterly growth rates in real GDP and hours worked using the National Accounts data for the last five years to the September-quarter 2018.
You can see the major dislocation between the two measures persisted throughout 2013 (began in 2011) and reasserted itself in early 2016.
From then until the most recent quarter, the two series moved more or less together, despite the blip in the March-quarter 2018.
The September-quarter data shows that total hours worked rose by just 0.1 per cent and GDP rose by 0.3 per cent. This means that productivity growth rose modestly.
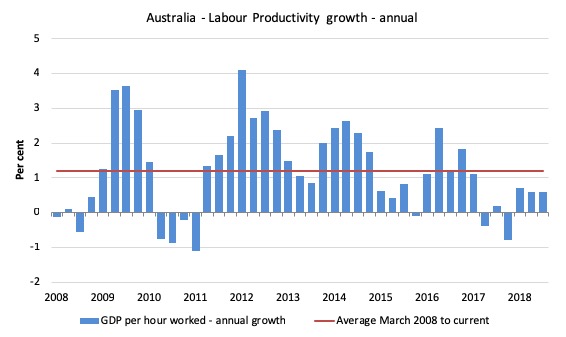
To see the above graph from a different perspective, the next graph shows the annual growth in GDP per hour worked (labour productivity) from the March-quarter 2008 quarter to the September-quarter 2018. The horizontal red line is the average annual growth since March-quarter 2008.
The relatively strong growth in labour productivity in 2012 and the mostly above average growth in 2013 and 2014 helps explain why employment growth was lagging given the real GDP growth. Growth in labour productivity means that for each output level less labour is required.
In the September-quarter 2018, annual labour productivity growth was steady at 0.6 per cent but still below the average growth since March-quarter 2008.
Conclusion
Remember that the National Accounts data is three months old – a rear-vision view of what has passed and to use it to predict future trends is not straightforward.
Coming up with assessments of where the economy is heading requires analysis of the more recent data – such as labour force surveys and the like.
But the National Accounts data indicates that the Australian economy is slowing and on shaky ground.
Household consumption growth is slowing and reliant on increasing debt and savings rundown.
The large government infrastructure projects (State-level) are driving growth and without the government contribution in the September-quarter, the Australian economy would have recorded a zero growth rate.
Private investment spending continues its poor performance, declining again this quarter.
This will impact on the potential growth capacity of the economy.
Overall, the Australian growth outlook is shaky.
That is enough for today!
(c) Copyright 2018 William Mitchell. All Rights Reserved.
Bill, when are we going to abandon GDP as a measure of well-being?
Why is household consumption the save all when we know it is destroying the biosphere?
The chickens are coming home to roost for neoliberal policies, in the form of high private debt, wage growth flat, unemployment still high, cost of living pressures etc but the obsession with monetary policy means that it is virtually the only lever the Federal government is prepared to pull.
Hey, the neoliberals might even achieve a budget surplus. Short-lived of course!
@ Ian Barker
Kate Raworth’s “Doughnut Economics” may have some answers for you
https://www.theguardian.com/commentisfree/2017/apr/12/doughnut-growth-economics-book-economic-model
Prof
Christopher Joye, as you will know, writes in the AFR (Australia). Chris along with two quants have developed a model to measure RMBS (Residential Mortgage Backed Securities) defaults that contradicts all the spin oozing out of your ‘favourite’ team of Raters: S & P. The Joye Camp have called it ‘Hedonic Regression” that implicitly supports everything you have said and continue to say that shows what rubbish we are fed by all and sundry.
Below is an excerpt of the latest from the Joye camp:
“Falling house prices pose a big threat to RMBS credit ratings: in some 2018 RMBS deals a 10% drop in house prices would lower the rating on AAA (or AA) tranches to just BBB- (or B+). Our data science team published a quant research paper releasing a new compositionally-adjusted “hedonic” default index for Aussie RMBS, which showed mortgage defaults clearly increasing, contradicting S&P’s claim—based on its non-adjusted index—that RMBS default rates have been decreasing. This is the first hedonic regression-based method that has been applied to the problem of removing compositional biases from mortgage default indices.”
Essentially the Joye camp has prepared the regression removing, or adding all of the important variables rather than use averages. The papers they produced are worthwhile reading, even though they are new this year.
But what I really like, is the destruction of the Raters argument. I am placing my money on you along with Chris Joye & the Joye boys.