The IMF and the World Bank are in Washington this week for their 6 monthly…
US Federal Reserve decision exposes moral bankruptcy and incompetence
On December 19, 2018, the Federal Reserve Bank Open Market Committee (FOMC), which determines the monetary policy settings in the US, increased the policy interest rate by 25 basis points to 2.5 per cent, as part of its plan to ‘normalise’ monetary policy. Even within the parameters of their own logic, it is hard to see any inflation threat. Long-term inflationary expectations suggest that people expect an unchanged situation over the next decade. Which suggests that the current unemployment rate is not seen as a threat to the price level. Now, while the FOMC decision may or may not cause some slow down in real GDP growth, given the blunt and ambiguous nature of monetary policy adjustments, the really disturbing aspect of the policy change is the fact that the FOMC members were plotting to push up unemployment by more than 1.2 million people as a plan to lower the inflation rate by a few basis points. Not only is that an obscene revelation but the fact that the FOMC use economic models that cannot tell them that the economic costs of such a shift are massive compared to any benefits that might arise from a slightly lower inflation rate tells us that policy is being made using deeply flawed, useless economic theory and models. Moral bankruptcy and incompetence rules.
The Federal Reserve’s decision and justification
In their official monetary policy statement – Federal Reserve Press Release – the FOMC said that:
1. “Information … indicates that the labor market has continued to strengthen and that economic activity has been rising at a strong rate. Job gains have been strong, on average, in recent months, and the unemployment rate has remained low.”
2. “both overall inflation and inflation for items other than food and energy remain near 2 percent. Indicators of longer-term inflation expectations are little changed, on balance.”
3. “Consistent with its statutory mandate, the Committee seeks to foster maximum employment and price stability.”
4. “The Committee judges that some further gradual increases in the target range for the federal funds rate will be consistent with sustained expansion of economic activity, strong labor market conditions, and inflation near the Committee’s symmetric 2 percent objective over the medium term.”
The facts are that at present:
1. Real GDP growth was 1 per cent in the June-quarter 2018, and 0.9 per cent in the September-quarter.
2. The unemployment rate was at 3.67 per cent in November 2018 but the broader measure of labour underutilisation (U6) rose 0.2 points to 7.6 per cent.
3. The participation rate at 62.9 per cent in November 2018 remains well below December 2016 peak of 66.4 per cent.
4. That means there is still significant slack in the US labour market.
I provided a deeper analysis of the state of the US economy in this blog post – US labour market moderated in November and considerable slack remains (December 11, 2018).
I also wrote about the FOMC decision on December 14, 2016 to start the process of hiking rates in this blog post – US central bank decision to raise interest rates doesn’t make much sense (December 19, 2016).
The evidence
There are mixed signals concerning the inflation rate.
The Federal Reserve wrote that “both overall inflation and inflation for items other than food and energy remain near 2 percent”.
That doesn’t necessarily accord with the actual data.
In their explanatory note – What is inflation and how does the Federal Reserve evaluate changes in the rate of inflation? – we learn that the FOMC “considers several price indexes because different indexes track different products and services, and because indexes are calculated differently”.
The measure they usually emphasise is:
… the price inflation measure for personal consumption expenditures (PCE), produced by the Department of Commerce, largely because the PCE index covers a wide range of household spending.
They also “take the following steps”:
1. “policymakers generally consider average inflation over longer periods of time, ranging from a few months to a year or longer.”
2. “it must make policy based on its best forecast of inflation …”
3. “policymakers examine a variety of “core” inflation measures to help identify inflation trends … most common type of core inflation measures excludes items that tend to go up and down in price dramatically or often, like food and energy items”.
Okay.
So they prefer to use a measure that is directly related to private consumption expenditure from the national accounts.
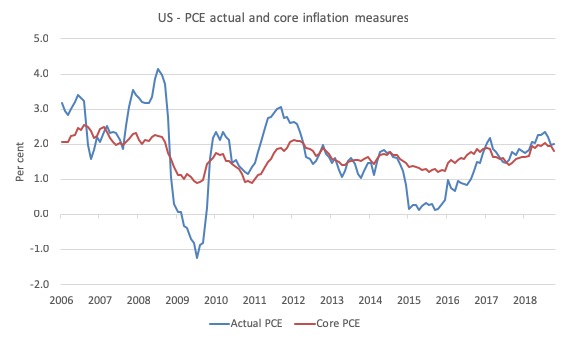
The first graph shows the annual percentage change in the actual and core (excluding food and energy) PCE inflation measures from January 2006 to October 2018.
It is clear that these measures are sitting at the bottom of the 2 per cent threshold (actual was 2.01 per cent in October 2018 and falling, core was 1.82 per cent and falling).
So on that rendering the Federal Reserve’s characterisation is not too inconsistent with the data.
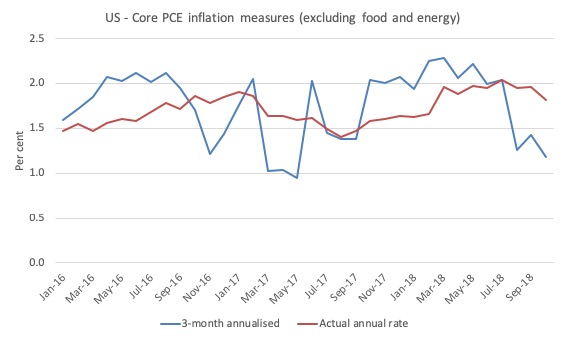
Now consider the next graph, which shows the quarterly rate of change in the PCE core inflation measure (excluding food and energy) for a more recent period (to provide a better focus of where things are going) – from January 2016 to October 2018.
So this measure smooths the annual change a little, consistent with point 1 above.
Two measures are shown – the actual annual inflation rate (red line) and the annualised value of the quarterly rate (blue line).
Now a different perception arises.
While the actual annual PCE core inflation rate has been falling below the Federal Reserve’s 2 per cent threshold over the last few months, the annualised quarterly rate of PCE core inflation in October 2018 was just 1.18 per cent having fallen sharply from the 2 per cent level in June.
So consumption prices are not accelerating strongly at all in the US despite warnings by the usual array of mainstream economists that they would push well into the 2-3 per cent range by the end of this year.
Wrong as usual.
Further, if you look back over 2018, the actual annual PCE core inflation rate has only hit the 2 per cent level once in the period shown (July 2018 = 2.04 per cent).
To construct this data as evidence of an strengthening future inflation profile is pretty far fetched.
And what about expected price inflation?
The US Federal Reserve’s Press Statement (link above) said that:
Indicators of longer-term inflation expectations are little changed, on balance.
This is important because if the longer-term expectations were showing rising inflation then the Federal Reserve decision would be on firmer ground (using their own logic).
The current expected price inflation for the next 12 months derived from the Cleveland Federal Reserve’s – Inflation Expectations data – series is 1.98 per cent (December 2018) down from 2.41 per cent in September.
A year ago (December 2017) the expectation for now was 2.82 per cent. So a lot of slack has been factored in.
Moreover, the ten-year ahead expected inflation is at 2.09 per cent.
A year ago it was 2.01 per cent. So, virtually unchanged.
In other words, the market participants have no expectation that inflation is going to rise at all over the next year or ten years.
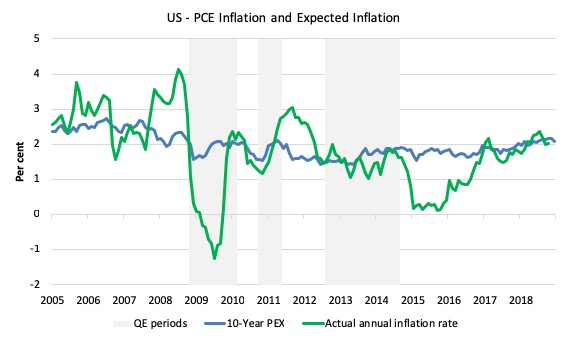
The following graph shows the evolution of the actual PCE inflation rate and the 10-year ahead inflation expectations series from March 2005 to December 2018.
The one-year ahead graph is similar, which reinforces the benign nature of the expected inflation psychology in the US at present.
It is clear that this data doesn’t justify the Federal Reserve’s decision to hike interest rates.
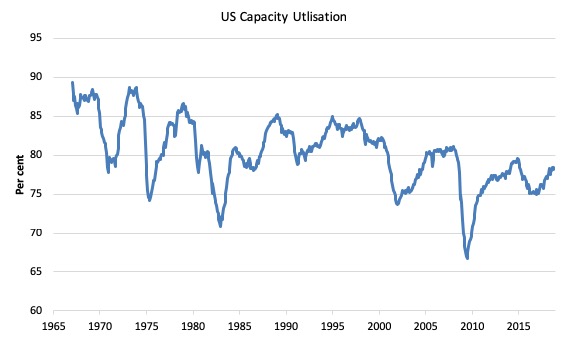
And what about capacity utilisation, which gives another perspective on how close to the inflation barrier the US supply-side is?
The Federal Reserve Bank publishes a monthly data series – Industrial Production and Capacity Utilization – G.17 – which provides an indication of how much of the non-labour productive capacity is being utilised.
They define “Capacity utilization for Total Industry (TCU)” as:
… the percentage of resources used by corporations and factories to produce goods in manufacturing, mining, and electric and gas utilities for all facilities located in the United States (excluding those in U.S. territories). We can also think of capacity utilization as how much capacity is being used from the total available capacity to produce demanded finished products …
… the capacity index tries to conceptualize the idea of sustainable maximum output, which is defined as the highest level of output a plant can sustain within the confines of its resources … The capacity utilization rate can also implicitly describe how efficiently the factors of production (inputs in the production process) are being used … It sheds light on how much more firms can produce without additional costs. Additionally, this rate gives manufacturers some idea as to how much consumer demand they will be able to meet in the future.
Clearly, when capacity utilisation rates are high, the inflation risk from demand-side pressures (that is, spending pressures) increases.
Firms, typically, keep some spare capacity in reserve as a normal strategy so that they can meet unexpected spikes in demand without losing market share. So what might be considered a normal full capacity load will be considerably less than 100 per cent.
In fact, the average rate of capacity utilisation since this data series was first published in January 1967 has been 80.2 per cent, although the mean rates were much higher in the 1960s and 1970s, before the Monetarist (neo-liberal) era started suppressing growth rates.
The following graph charts the evolution of this data series from January 1967 to to October 2018. You can clearly see the cyclical swings associated with recessions.
It is interesting to note that each subsequent recovery since the 1990s has levelled off below the previous level, which is consistent with the observation that the neo-liberal era has been associated with stifled growth rates and elevated levels of excess capacity.
But even in the current recovery, capacity utilisation rates are still below 80 per cent and over the last few months have been fairly stationary, indicating that firms probably have plenty of idle equipment and machinery and non-inflationary capacity available to meet increased spending growth.
This is one of the reasons why private investment remains weak. There is ample productive capacity in situ to handle the current levels of spending and output without any need to expand productive capacity in an uncertain environment.
And this recovery is weak – so what is ‘normality’?
Mainstream economists try to cover their tracks on monetary policy by talking about ‘normalising’ interest rate settings, by which they mean, hike the policy rate back to where it was before the GFC and shrink the asset-side of the central bank’s balance sheet (reversing the quantitative easing purchases).
Really they are just playing along with the commercial banks who make more profit when interest rates are higher.
Please read my blog post – Why banks are pushing the US central bank to increase interest rates (October 5, 2015) – for more discussion on this point.
I also have some sympathy with the latest assessment by Richard Koo in the current Nomura Newsletter (December 18, 2018):
The primary reason why the Fed was raising rates at a time when the US private sector continues to run a large financial surplus and there are effectively no borrowers is that it wanted to secure a “shock absorber” of sorts for itself in the event that the process of winding down QE sparked a sharp decline in Treasury prices.
There is nothing the Fed could do if the bond market crashed when interest rates were at zero. But a higher policy rate would enable the central bank to stop the decline in bond prices by cutting interest rates. The Fed’s original intention was to wind down QE first and only then to move ahead with rate hikes, but in 2014 it reversed the sequence and decided to raise rates first for this reason.
Which just goes to show how crazy the logic is.
But this question of normalisation is of interest.
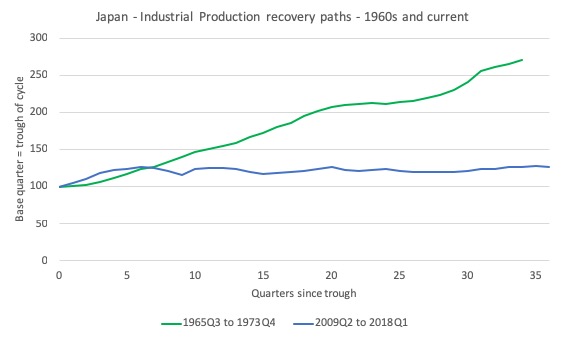
Richard Koo presented some graphical analysis of the current recovery in Japan relative to the previously ‘long’ recovery period in the 1960s (the so-called “Izanagi boom”).
He wrote that the current recovery is weak, which “underscores both the weakness of this expansion and the impotence of BOJ monetary policy”.
He produced a graph which indexed Japanese real GDP growth at the trough of the Izanagi cycle (December-quarter 1965) and the current cycle (December-quarter 2012) and then traced the evolution in the expansion (until the next peak was reached).
I reproduced his analysis using the Index of Total Industrial Production (given national accounts data for GDP is not available for the 1960s).
There were several shorter cycles (trough and peak) between the two cycles shown and all had recovery trajectories that lay between the two shown.
The current recovery, though is clearly the weakest by any measure.
Koo’s conclusion is clear and consistent with what Modern Monetary Theory (MMT) economists have been saying all along:
What these figures show is that the Bank of Japan’s astronomical quantitative easing has had almost no impact on the real economy. This also demonstrates how ineffective monetary policy has become compared to the Izanagi era.
Monetary policy in the UK and the US was also heavily backed by politicians to ease the cyclical decline during the GFC.
After all, that is the New Keynesian way.
So I wondered what their recovery trajectories might look like, knowing all along what I would find.
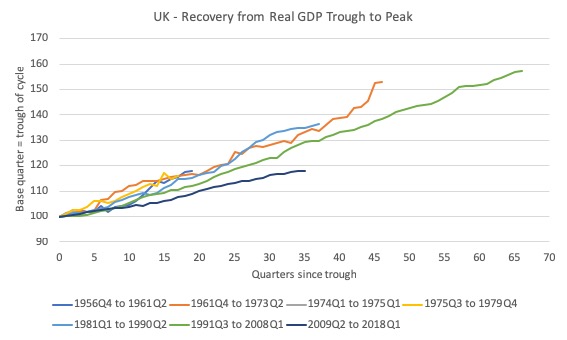
This is what I found. First, the UK, then the US.
The dates denote the trough of each cycle to the peak that ends the cycle.
The currency UK recovery is the weakest of all the cycles since the mid-1950s. And do not be deceived by scale when comparing it with the recovery scale of Japan.
To give a relative assessment, after 36 quarters (from the March-quarter 2009), Japan’s industrial production had grown by 27 per cent (as at the March-quarter 2018).
By comparison, after 36 quarters (the troughs arose in different quarters), the UK real GDP index had grown by 18 per cent.
This sort of weakness was mostly due to the austerity bias of fiscal policy. Monetary policy is ineffective but more so if fiscal policy is restrictive as it was in the UK.
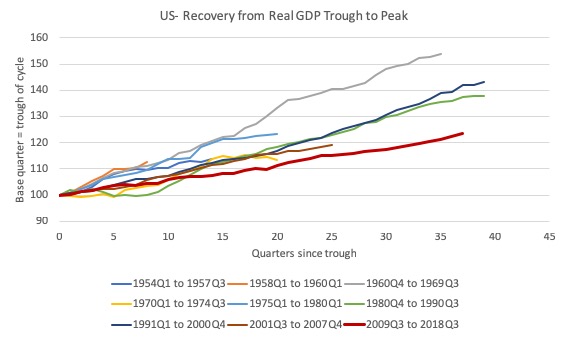
The next graph shows the same sort of analysis for the US.
The pattern is similar. In relative terms, after 37 quarters since the June-quarter 2009 trough, real GDP in the US has risen by 23.4 per cent.
So Japan, which is often vilified for its various ‘lost’ decades, has actually outperformed the UK and the US despite similar monetary policy (interest rate setting).
The difference has been the fiscal support each nation has given.
The point is that while mainstream economists talk about ‘normality’, the current period is anything but ‘normal’ when compared to the previous cycles.
But that hasn’t changed their dogmatic view about the effectiveness of monetary policy.
But what is really offensive about the Federal Reserve decision
As noted above, the US unemployment rate is currently at 3.67 per cent.
While that is as low as it has been since August 1969, the other indicators of slack in the US economy are clearly telling us that the US economy is not at full employment.
Capacity utilisation is still down.
Participation rates are depressed.
Wages growth is subdued.
The U6 remains at elevated levels.
Core inflation is subdued if not trending down.
All of that tells us that the Federal Reserve should not be increasing interest rates at present if they followed their own logic.
But from an Modern Monetary Theory (MMT) perspective, the actual act of increasing the rates will probably not do much at all.
Monetary policy is an ineffective tool for counter-stabilisation.
The FOMC documents accompanying the FOMC decision – Projection Materials – tell us what the various members of the FOMC consider will be the trajectory of real economic variables such as Real GDP and unemployment and nominal variables such as the inflation rate.
In terms of the unemployment rate, the middle panel of Figure 2 projects the “Medians, central tendencies and ranges of economic projections, 2018-21 and over the longer run”.
I reproduce that part of the Figure below.
So the red line is the median projection and the outer blue lines are the range of expectations among members of the FOMC.
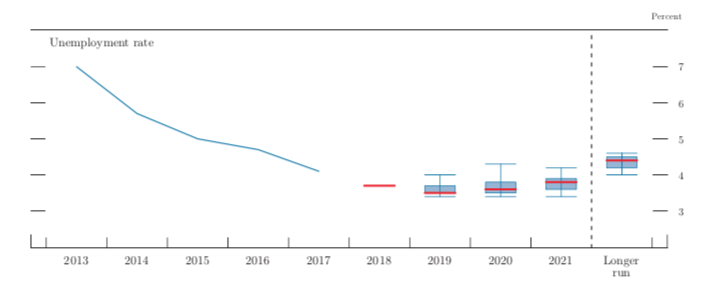
Putting numbers to the graph we get:
1. A longer run median projection of 4.4 per cent.
2. A central tendency expectation of 4.2 to 4.5 per cent.
3. A longer run range of 4 to 4.6 per cent.
In other words, the FOMC believes that its policy decisions will (deliberately) be putting people who are currently working out of work.
How many are we talking about?
If nothing else changed, at the current working age population and participation rate, if the unemployment rate rose to 4.4 per cent, there would be 1,186.88 thousand extra people unemployed.
1.2 million people.
It would be worse than that though.
The depressed employment demand that would deliver such a result would drive the participation rate down further so that hidden unemployment would rise.
It would also increase underemployment so the broad U-6 measure would rise and the Employment-population ratio would fall.
Capacity utilisation would fall as real GDP plummetted and sales and incomes were lost.
The point is that monetary policy changes are relatively ineffective so it may be that the FOMC members are kidding themselves that these interest rate hikes will cause such a decline in activity, especially with fiscal policy supporting growth.
But the fact that the FOMC members believe they will cause this increase in unemployment is a shocking indictment of this entire era of policy making.
Especially when the long-run inflationary expectations are absolutely flat.
It exemplifies the point I have made often.
This neoliberal era of technocracy deliberately causes pain to the most disadvantaged while protecting the interests of the top-end-of-town.
It is a morally bankrupt era.
The fact that these well-paid central bankers sit around in nice committee rooms plotting to put more than 1.2 million people out of work just to satisfy the parameters of macroeconomics models that are so inaccurate and produce disastrous predictions is what I would term to be a criminal act.
They should all be sacked and the central bank absorbed into the Treasury department.
There was a relevant Bloomberg article (December 20, 2018) by former US central banker (now academic) Narayana Kocherlakota – The Fed’s Risky Plan to Boost Unemployment – that really tells you what is wrong with the current orthodoxy.
His article says that:
The U.S. Federal Reserve appears to be planning a risky endeavor: Sometime in the first half of the next decade, it intends to slow the economy enough to increase unemployment by about 1.4 million people – all in the name of reducing inflation by around a tenth of one percent.
He muses as to “whether the costs will outweigh the benefits”.
He doesn’t need to linger to long thinking about that.
If the Federal Reserve was to actually cause that rise in unemployment, the costs would dwarf the small downward notch in the inflation rate they might achieve.
The massive loss of sales that would be required to cause employment growth to decline to the extent that the unemployment rate would rise to 4.4 per cent would be the tip of the iceberg.
The income losses, alone, would be massive.
But then add in the additional personal costs that accompany unemployment – Please read my blog post – The costs of unemployment – again (January 13, 2012) – for more discussion on this point.
The fact that the economic models which they use to deliver forecasts do not tell them that tells you everything.
It means they are so far divorced from reality to be useless for their stated purpose.
They, in fact, serve ideological agendas that are not publicly disclosed and do not help policy makers set policy to maximise the well-being of the population.
Even Kocherlakota who is no MMTer finds it hard to believe that this is a “desirable gamble”.
Conclusion
Last week, the US Federal Reserve FOMC hiked interest rates as part of its plan to ‘normalise’ monetary policy.
Even within the parameters of their own logic, it is hard to see any inflation threat. Long-term inflationary expectations suggest that people expect an unchanged situation over the next decade.
Which suggests that the current unemployment rate is not seen as a threat to the price level.
Now, while the FOMC decision may or may not cause some slow down in real GDP growth, given the blunt nature of monetary policy adjustments, the really disturbing aspect of the policy change is the fact that the FOMC members were plotting to push up unemployment by more than 1.2 million people as a plan to lower the inflation rate by a few basis points.
Not only is that an obscene revelation but the fact that the FOMC use economic models that cannot tell them that the economic costs of such a shift are massive compared to any benefits that might arise from a slightly lower inflation rate tells us that policy is being made using deeply flawed, useless economic theory and models.
Big changes are needed.
That is enough for today!
(c) Copyright 2018 William Mitchell. All Rights Reserved.
I agree with you about the FED, but what is going to happen with inflation when the mountains of private debt are reduced?
“On December 19, 2019”
Sadly, this was this year’s christmas present.
“The fact that these well-paid central bankers sit around in nice committee rooms plotting to put more than 1.2 million people out of work just to satisfy the parameters of macroeconomics models that are so inaccurate and produce disastrous predictions is what I would term to be a criminal act.” Maybe we should stop talking about Neoliberalism and start talking about Neocriminalism. Has a nice clear ring to it, does it not?
Yes- moral bankruptcy and incompetence. Such a great combination. But, a great argument in favor of the Job Guarantee.
The Fed interest rate rise is by a Trump appointee, Powell, who in a previous life was an investment banker. And then he worked for Dubya. And he hasn’t the benefit, if it were a benefit, of being married to George Akerlof. Though that didn’t seem to influence Yellen much.
Newton, ‘neocriminalism’ is an awful neologism. It is not a new form of criminality. It doesn’t work. Neoliberalism is not necessarily a criminal enterprise, even when morally bankrupt.
The embedded vid in the article is rather awful, rabbiting on, among other rubbish, about the Phillips curve. One interviewee thinks Powell is doing a great job and will be used by Trump as a punch bag. What else is new.
Larry, lighten up a bit, my friend. My comment was only a tongue-in-cheek bit of whimsy. But is Neoliberalism itself really a new form of Liberalism? That amorphous, godawful term we’ve all sort of adopted to speak about the new globalized form of hyper-capitalism has little, if anything, to do with classic Liberalism.
The whole idea: inflation comes from too many people working and greedily pushing for more money so the fed has to stop and punish them is just the institutionalization of a self serving lie of the wealthy and the powerful.
One can’t help but wonder about private influences driving this sort of behavior. I believe at least one of the founding fathers of the US warned about this and wanted strong measures to protect against it: “first they get everyone into debt and then they raise the rates.”
We’ve learned nothing from history. According to US constitutional law experts, many of the protections citizens were raised to understand they had, are now “dead letter law”, effectively non existent.
Hadn’t we discussed previously that interest rate hikes are potentially inflationary if anything due to increased flows of interest payments on treasuries?
Fair comment, Newton. I agree that neoliberalism as currently practised has virtually nothing to do with classical liberalism.
I am not sure about Treasuries, but debt will increase as a consequence of a rate rise as interest payments usually rise in tandem.
Low interest rates would be fair for everyone if we had, as so many think we do, a “loanable funds” banking model but as it is with “Bank loans create bank deposits” but corresponding liabilities that are largely a sham toward the non-bank private sector we have instead:
1) Those qualified to borrow can get loans of brand new purchasing power
while those who can’t or won’t
2) Suffer any resulting price inflation.
The pity is we could have a largely “loanable funds” banking model AND low interest rates by:
1) Completely de-privileging the banks.
2) Lowering interest rates if desired via equal fiat distributions to all citizens.
How to finance? Overt Monetary Finance and/or negative yields on the inherently risk-free debt of the monetary sovereign including negative interest on large or non-citizen accounts at the Central Bank except for an individual citizen exemption* up to a reasonable account size, say, $250,000 the current US deposit insurance limit.
*This presupposes that citizens will eventually be allowed to use their Nation’s fiat in convenient, inherently risk-free account form at the Central Bank or Treasury itself.
Merry Xmas everyone. It would make a lot more sense if the rate rise was accompanied by a looser fiscal stance. I think that US monetary policy has created an ongoing bubble in asset prices (largely thanks to Greenspan and The Bernank). I think the MMT approach of absorbing the central bank into treasury is a fine idea. Australia has fallen for the same trap, me thinks. By mid 2019 oz will have a new government and hopefully spending will rise sharply and labour utilisation increase.
A little off topic, but close(ish)… it’s striking me as we sit through the so-called Festive Season, and watch the White House self-parody show, that here is the nub, (or one of the main ones), of MMT. Trump wants the sign-off on his Wall funding. All commentators, naturally, steer clear of ‘where’s the money?’, or ‘how will we pay…?”, as, of course, it’s a mystery to them, as well.
Am wondering if there are a few more people who are realising that the deadlock is over signing off on a spreadsheet. But it’s mostly the elephant in the room, for most.
Bond holders want more interest for zero risk investment. The rest is cronyism and rationalisation.
The economy can be better supplied with currency by fiscal means, not bank credit: spending to put resources to work for the common good, and low end tax relief.
I also noted that the shutdown tells us that taxes don’t enable government spending, only acts of parliament enable spending.
Excellent post!
Few points.
– Japan’s success might appear to be even more successful if the REAL GDP comparisons with America and UK were PER CAPITA because their population is shrinking.
– The complaint about Central Banks that deliberately reduce employment was a major concern of Nobel Prize Winner William Vickrey http://www.columbia.edu/dlc/wp/econ/vickrey.html
– Finally I would denying people a job, the right to support themselves and their loved ones, is by today’s human rights and equal opportunity standards – unconstitutional. If we can’t deny them a job because of their group identity, and if the constitution protects people from mistreatment by government, then enforcing unemployment and poverty has to be unconstitutional. FDR was headed in that direction over 70 years ago.
Roosevelt wanted a Bill of Economic Rights:
a) He wanted to free people from the economic aristocracy, just as they were once freed from the political aristocracy
FDR’s 1936 Acceptance Speech http://www.youtube.com/watch?v=071Wl0N1kAg
Text: http://www.presidency.ucsb.edu/ws/?pid=15314
b) FDR’s 1944 State of the Nation address including the Economic Bill of Rights
Video – billmoyers.com/2014/03/07/remembering-franklin-delano-roosevelt-and-the-second-bill-of-rights/
Text: http://www.fdrlibrary.marist.edu/archives/address_text.html
A friend suggested the FOMC’s move may be a good thing because it may be a way “To cool down the crazy stock market & help savers. I am happy to get 2.3% on a 1 month T bill now. In 2000, you could get 5% on a 6 mo. CD.”
Can someone please address this? I have no idea.
Traction?
https://angrybearblog.com/2018/12/actually-only-banks-print-money.html#more-48251