Today (March 6, 2024), the Australian Bureau of Statistics released the latest - Australian National…
Australia national accounts – growth plummets, per capita recession
The Australian Bureau of Statistics released the latest December-quarter 2018 National Accounts data today (March 6, 2019) and we learn that in the last 6 months of 2018, the Australian economy descended into a recession in GDP per capita terms. That is, for the last two quarters of 2018, growth in GDP per capita was negative. However, due to a fairly strong terms of trade, Real net national disposable income rose, which signifies rising material living standards. Overall, the Australia economy has slowed considerably. The quarterly growth rate fell to just 0.2 per cent and 2.3 per cent (down from 2.8 over the 12 months to December 2018). However, the annual result is influenced by the outlier March-quarter. The annualised growth rate is really around 0.8 per cent, which is very poor. The economy remains reliant on household consumption expenditure, which is now moderating. Both private sector investment and the external sector are detracting from growth. The stark result is that without the contribution of the government sector, the Australian economy would have been deemed to be in recession now. There is a high probability that household consumption expenditure will slow further. The overall picture is not good and the future is looking rather dim at present.
The main features of the National Accounts release for the December-quarter 2018 were (seasonally adjusted):
- Real GDP increased by 0.2 per cent for the quarter – a sign of a much weaker economy. The annual growth rate was 2.3 per cent (down from 2.8 per cent) but that was influenced by the March-quarter 2018 outlier. The annualised growth rate is really around 0.8 per cent.
- Real GDP per capita growth was negative for the second successive quarter signifying that on that measure the Australian economy was in recession.
- The main positive contributors to real GDP growth were household consumption expenditure (0.2 points), general government consumption expenditure (0.3 points) and changing inventories (0.2 points).
- Australia’s Terms of Trade (seasonally adjusted) rose by 3.1 per cent in the quarter and 6.0 per cent over the 12 month period.
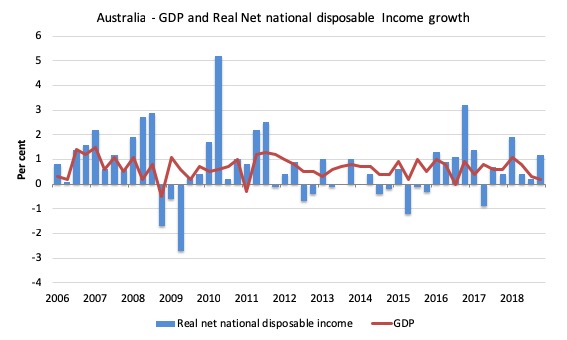
- Real net national disposable income, which is a broader measure of change in national economic well-being rose by just 1.2 per cent for the quarter and 3.7 per cent for the 12 months to the December-quarter 2018, which means that Australians are better off (on average) than they were at that point 12 months ago.
- The Household saving ratio (from disposable income) rose by 0.1 points to 2.5 per cent, well below the levels that were observed following the GFC. It is now at it lowest level since the December-quarter 2007. The rise was due to a combination of a slight rise in disposable income and a reduced spending growth rate.
Overall growth picture – slowing towards recession
The ABS – Press Release – said that:
The Australian economy grew 0.2 per cent in seasonally adjusted chain volume terms in the December quarter 2018 …
Chief Economist for the ABS, Bruce Hockman, said: “Growth in the economy was subdued, reflecting soft household spending and a decline in dwelling investment. The approvals for dwelling construction indicate that the decline in dwelling investment will continue.” …
Falls in private investment dampened growth in the quarter …
Public demand sustained growth in the quarter. Public investment remained at high levels with State and Local government growth of 6.3 per cent reflecting continued work on a number of large infrastructure projects. Government final consumption expenditure grew 1.8 per cent, with ongoing expenditure in health, aged care and disability services. This investment translates to ongoing strength from the healthcare industry, which remains the largest contributor to economic growth.
Mr Hockman said “… investment has remained strong with major public works driving growth around Australia.”
First, household consumption expenditure growth is moderating and is reliant on the run down of savings and rising debt.
Second, for all those mainstream economists out there who teach your students that government spending does not create jobs, stop doing that.
It has been patently obvious that public works expenditure over the last year or so has been the difference between a positive (albeit tepid) growth rate and recession.
The largest component of aggregate spending – household consumption expenditure – which has been maintained in a weak wages growth environment through the run down of savings, has now started to slow. It was
The household saving ratio which has been falling rapidly as households tried to sustain consumption spending growth reversed direction. It was always clear that households would have to cut spending growth to bring it into line with the weak wages growth.
This is in the context of household debt being already at record (and dangerous) levels.
Third, the big public infrastructure projects which are helping at present are obviously finite and are within an environment where the federal government is obsessed with recording a surplus.
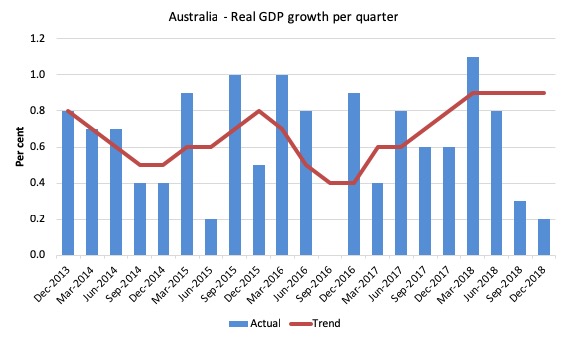
The first graph shows the quarterly growth over the last five years (with the red line being the ABS moving average trend). The trend growth is now flat (and would have been negative except for the spike outlier in the March-quarter 2018).
It is now clear that the spike in quarterly growth for March was not the sign of a new period of above-trend growth.
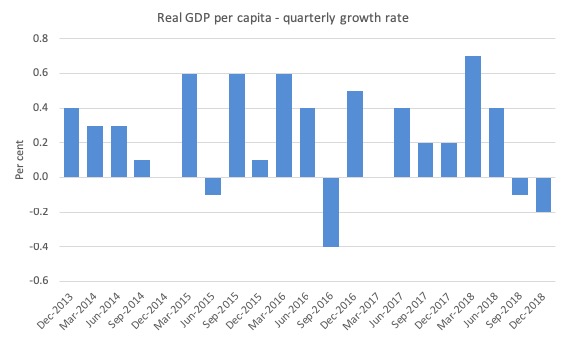
Real GDP per capita recession
The big story from the data release this quarter is that in per capita terms, Australia is now in recession.
The real GDP per capita growth rate has been negative for the last two quarters.
The following graph shows the quarterly growth rate over the last five years to the December-quarter 2018.
This signifies a rather significant reduction in economic activity over the last several months of 2018.
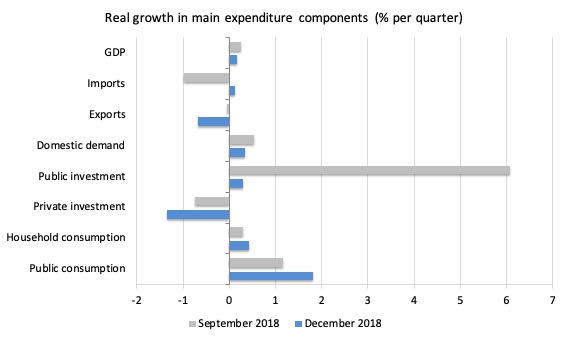
Analysis of Expenditure Components
The following graph shows the quarterly percentage growth for the major expenditure components in real terms for the December-quarter 2018 (blue bars) and the September-quarter 2018 (grey bars).
The overall growth performance is being driven by the strength of public consumption and investment expenditure.
Without the strong public investment expenditure growth would now be negative (see below).
Private investment expenditure growth declined by 1.34 per cent and has been slowing since the start of the year.
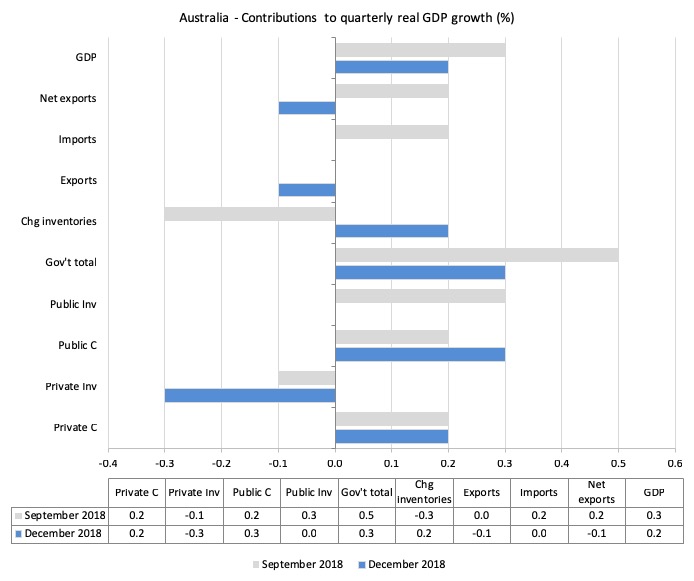
Contributions to growth
What components of expenditure added to and subtracted from the 0.2 per cent real GDP growth in the December-quarter 2018?
The following bar graph shows the contributions to real GDP growth (in percentage points) for the main expenditure categories. It compares the December-quarter 2018 contributions (blue bars) with the June-quarter 2018 (gray bars).
Net exports detracted from growth by 0.1 percentage points driven by a decline in exports (notwithstanding the rising terms of trade)
Household consumption expenditure contributed 0.2 points to the overall growth result – and is best described as modest.
Private investment expenditure undermined growth by 0.3 points.
The government sector contributed 0.3 points to the overall growth result and without it, the Australian economy would have been going backwards.
Growth in material living standards rise in December-quarter 2018
The ABS tell us that:
A broader measure of change in national economic well-being is Real net national disposable income. This measure adjusts the volume measure of GDP for the Terms of trade effect, Real net incomes from overseas and Consumption of fixed capital.
While real GDP growth (that is, total output produced in volume terms) grew by 0.2 per cent in the December-quarter 2018, real net national disposable income growth grew by 1.2 per cent (up from 0.2 per cent last quarter).
Over the 12 months to the December-quarter 2018, Real net national disposable income grew by 3.7 per cent, which means that Australians were better off (on average) in real income terms than they were twelve months prior.
The following graph shows the evolution of the quarterly growth rates for the two series since the December-quarter 2006.
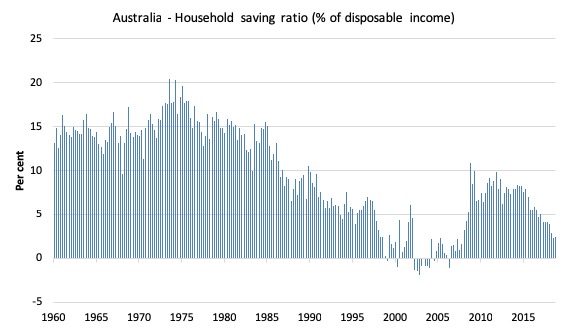
Household saving ratio continues decline towards zero
The saving ratio rose by 0.2 points to 2.5 per cent arresting the consistent decline since 2016.
This is in line with the slower household consumption growth in the context of flat wages growth and record levels of household debt.
The following graph shows the household saving ratio (% of disposable income) from the March-quarter 1960 to the current period.
In the December-quarter 2008, the ratio was 10.9 per cent having risen sharply in the early days of the GFC as households tried to stabilise the record debt situation.
Once the GFC threat was contained by the massive fiscal stimulus, the saving ratio began to fall again, especially as the squeze on wages has intensified.
In the December-quarter 2016, the household saving ratio was 5.5 per cent (still much lower than historical norms).
Whether the rise in the December-quarter 2018 marks a more permanent shift will have to be seen.
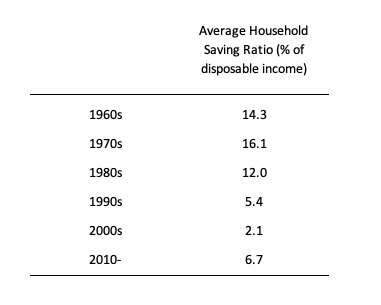
The following table shows the impact of the neoliberal era on household saving. These patterns are replicated around the world and expose our economies to the threat of financial crises much more than in pre-neoliberal decades.
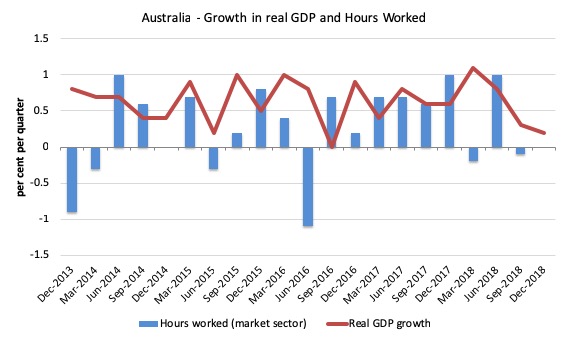
Real GDP growth and hours worked
The following graph presents quarterly growth rates in real GDP and hours worked using the National Accounts data for the last five years to the December-quarter 2018.
You can see the major dislocation between the two measures persisted throughout 2013 (began in 2011) and reasserted itself in early 2016.
From then until the most recent quarter, the two series moved more or less together, despite the blip in the March-quarter 2018.
The December-quarter data shows that total hours worked was flat and GDP rose by 0.2 per cent. This means that productivity growth rose modestly.
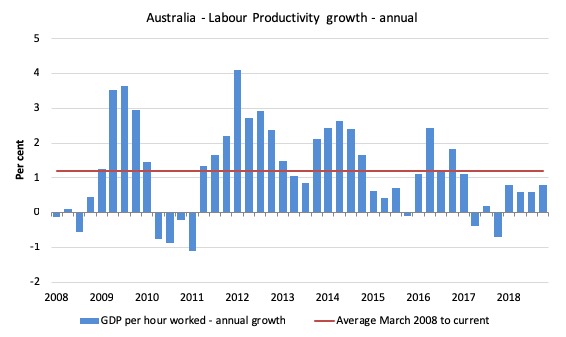
To see the above graph from a different perspective, the next graph shows the annual growth in GDP per hour worked (labour productivity) from the March-quarter 2008 quarter to the December-quarter 2018. The horizontal red line is the average annual growth since March-quarter 2008.
The relatively strong growth in labour productivity in 2012 and the mostly above average growth in 2013 and 2014 helps explain why employment growth was lagging given the real GDP growth. Growth in labour productivity means that for each output level less labour is required.
In the December-quarter 2018, annual labour productivity growth rose to 0.8 per cent but still below the average growth since March-quarter 2008.
Conclusion
Remember that the National Accounts data is three months old – a rear-vision view of what has passed and to use it to predict future trends is not straightforward.
Coming up with assessments of where the economy is heading requires analysis of the more recent data – such as labour force surveys and the like.
But the National Accounts data indicates that the Australian economy slowed rather significantly in the last 6 months of 2018.
The slowdown was driven by a slowdown in household consumption growth which had been reliant on increasing debt and savings rundown.
The rise in the saving ratio recorded in the December-quarter may signal that households are finally just accepting that their consumption growth will have to be more subdued.
That is a sign of weakness into 2019.
The large government infrastructure projects (State-level) are driving growth and without the government contribution in the December-quarter, the Australian economy would have recorded a zero growth rate.
Private investment spending continues its poor performance, declining again this quarter.
Net exports detracted from growth as exports fell despite the rising terms of trade.
Overall, the Australian growth outlook remains shaky.
That is enough for today!
(c) Copyright 2019 William Mitchell. All Rights Reserved.
Koukoulas on Twitter has claimed to have coined ‘per capita GDP’. I’m sceptical. There are a few of us who make a point of challenging his Surplus pursuit signalling, which is often. We try to be as polite as possible. He has (seemingly) around 36K Followers, (astounding in itself, as his Tweets are usually either obvious, or wrong, or as boring as batshit. Maybe they’re gamble-oholics, as he’s constantly quoting ‘political odds’.
Bill,
On another site a friend is open to MMT,but has an objection that I see as flawed.
Can you help me set him right?
He worries that long term deficits can cause problems in the long term, even if they re good in the short term.
I asked him to name just one example.
He responded that he thinks that the Repub’s massive deficits since Reagan have *caused* the flat wage growth that started with Reagan’s terms.
I think he is flat wrong. Not one of the rebel economist’s videos & articles I have seen even hints that this “cause” is true. Rebels like you, Kelton, Wray, Mosler, Keen and Blyth.
So, is there any sense in which he is right?