Today (April 18, 2024), the Australian Bureau of Statistics released the latest - Labour Force,…
US labour market weaker than it was at the end of 2018
Last week’s (March 8, 2019) release by the US Bureau of Labor Statistics (BLS) of their latest labour market data – Employment Situation Summary – February 2019 – is a little hard to believe and shows the sampling variability involved in survey work. In January, the BLS estimates that total non-farm payroll employment rose by 311,000 (revised up from 304,000). This month the estimate was only 20,000. So either the US economy is crashing (given employment is a lagging indicator) or some one-off factors (bad weather, shutdown, you name it) were present or the results are too variable to be believed. The most likely explanation is that employment growth is fading and the strength in the US labour market coming into 2019 is gone. Taking the Household Survey results, we saw employment rise by 255 thousand and the official unemployment rate fell by 0.2 points to 3.8 per cent on the back of a steady participation rate. Even with all this volatility in the estimates, the best guess is that the US labour market has probably weakened somewhat from where it was at the end of 2018. It is also clear that there is still a substantial jobs deficit remaining and considerable scope for increased participation.
Brief Advert – Event – Vienna, March 12, 2019
Before I continue with the US labour market analysis, here is a brief advertisement for my next presentation.
Tomorrow night, I will be the guest speaker at an event to be held at the – Impact Hub Vienna – which is located at Lindengasse 56, 1070 Vienna.
This is the first event as part of the „Talk Europe #offenegesellschaft” lecture series organised by the Der Bildungsverein – Offene Gesellschaft, and organisation aims at promoting cultural and civic education in matters of social importance.
In the series (in their own words) “9 führende internationale Intellektuelle ihre jeweilige Vision von Europa” (nine leading international intellectuals will present their respective vision of Europe).
The discussions will range from economics to environmental to education policy.
I am very honoured to be their first speaker in what will be a really engaging series designed to question the foundations of modern European politics.
Following the panel discussion, Café Depot (Hofmobiliendepot, Andreasgasse 7, 1070 Vienna) will hold a stimulating get-together with food and drinks, and I will be available with Johannes Voggenhuber and Robert Pfaller for questions and discussions.
I hope to see some of you in Vienna on Tuesday.
Overview for February 2019
- Payroll employment rose by 20,000, which is hardly at all.
- Total labour force survey employment rose by 255 thousand with some further volatility in the underlying working age population estimates continuing from last month.
- The seasonally adjusted labour force fell by 45 thousand which again was probably a correction in the underlying population benchmarks given the zero change in participation.
- Official unemployment fell by 300 to 6.235 million. There was a massive rise estimated last month when the population benchmarks were redone.
- The official unemployment rate fell by 0.2 points to 3.82 per cent.
- The participation rate was steady at 63.2 per cent but remains well below the peak in December 2006 (66.4 per cent). Adjusting for age effects, the rise in those who have given up looking for work for one reason or another since December 2006 is around 4,806 thousand workers. The corresponding unemployment rate would be 6.8 per cent, far higher than the current official rate.
- The broad labour underutilisation measure (U6) fell sharply from 8.1 per cent to 7.3 per cent (after a similar unreal rise last month which was due mainly to the enforced shutdown). So that is just returning to its usual level probably.
Further, for those who are confused about the difference between the payroll (establishment) data and the household survey data you should read this blog – US labour market is in a deplorable state – where I explain the differences in detail.
Payroll employment trends
The BLS noted that:
Total nonfarm payroll employment was little changed in February (+20,000), after increasing by 311,000 in January. In 2018, job growth averaged 223,000 per month. In February, employment continued to trend up in professional and business services, health care, and wholesale trade, while construction employment declined.
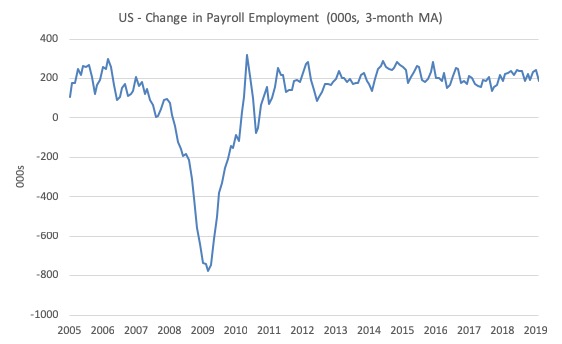
The first graph shows the monthly change in payroll employment (in thousands, expressed as a 3-month moving average to take out the monthly noise).
The monthly changes were stronger in 2014 and 2015, and then dipped in the first-half of 2016. By the end of 2016, job creation was stronger but then it tailed off again, somewhat.
This month was much more robust than the average over the last several years. We will wait to see if it lasts.
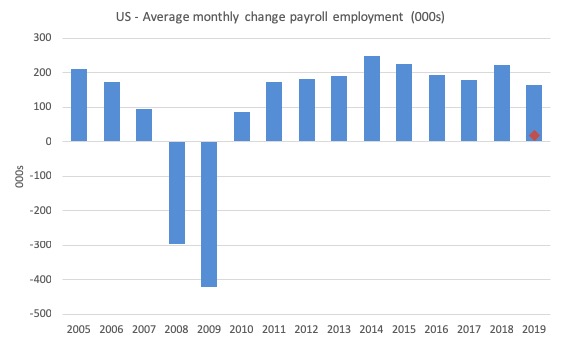
The next graph shows the same data in a different way – in this case the graph shows the average net monthly change in payroll employment (actual) for the calendar years from 2005 to 2019 (the 2019 average being the January observation at this stage).
The red diamond is the current month’s increase.
The slowdown that began in 2015 continued through 2017 was reversed last year. The 2018 average was 223 thousand compared to 179 thousand in 2017.
So far the average for 2019 is 166 thousand which would appear to be a better estimate of what is actually going on than thinking that a major swing between December to January to February has occurred.
That signals a slowdown rather than a crash.
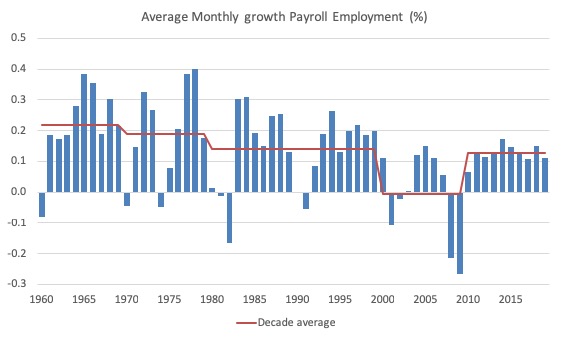
To put the current recovery into historical perspective the following graph shows the average annual growth in payroll employment since 1960 (blue columns) with the decade averages shown by the red line.
It reinforces the view that while payroll employment growth has been steady since the crisis ended, it is still well down on previous decades of growth.
Labour Force Survey – employment growth remains positive
The differences between the Payroll and Household surveys were large this month and the reader should make sure they understand how those differences may arise.
Employment as measured by the household survey rise by 255 thousand net (0.16 per cent) while the labour force fell by 45 thousand (-0.03 per cent).
As a result (in accounting terms), total unemployment fell by 300 thousand and the unemployment rate fell by 0.2 points to 3.82 per cent.
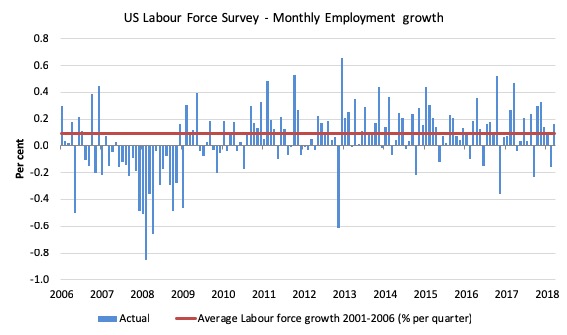
The next graph shows the monthly employment growth since the low-point unemployment rate month (December 2006). The red line is the average labour force growth over the period December 2001 to December 2006 (0.09 per cent per month).
Summary conclusion:
There is still no coherent positive and reinforcing trend in employment growth since the recovery began back in 2009. There are still many months where employment growth, while positive, remains relatively weak when compared to the average labour force growth prior to the crisis or is negative.
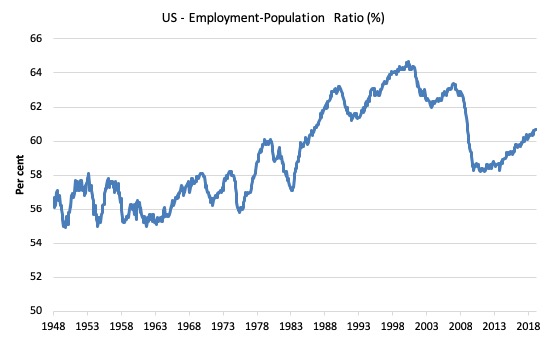
A good measure of the strength of the labour market is the Employment-Population ratio given that the movements are relatively unambiguous because the denominator population is not particularly sensitive to the cycle (unlike the labour force).
The following graph shows the US Employment-Population from January 1970 to February 2019. While the ratio fluctuates a little, the February 2019 ratio was steady at 60.7 per cent.
This time last year it was 60.2 per cent. So a larger proportion of the working age population are now in work of some kind.
Over the longer period though, we see that the ratio remains well down on pre-GFC levels (peak 63.4 per cent in December 2006), which is a further indication of how weak the recovery has been so far and the distance that the US labour market is from being at full capacity (assuming that the December 2006 level was closer to that state).
Unemployment and underutilisation trends
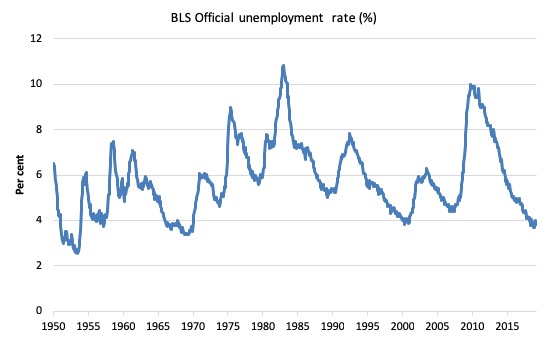
The first graph shows the official unemployment rate since January 1950.
It is clear that the US labour market is reaching unemployment rates not seen since the late 1960s (it is slightly lower than the most recent low-point in April 2000).
With inflation stable, the continued low unemployment rates make a mockery of official NAIRU estimates of full employment coinciding with an unemployment rate of 4.5 per cent.
The official unemployment rate is a narrow measure of labour wastage, which means that a strict comparison with the 1960s, for example, in terms of how tight the labour market, has to take into account broader measures of labour underutilisation.
The next graph shows the BLS measure U6, which is defined as:
Total unemployed, plus all marginally attached workers plus total employed part time for economic reasons, as a percent of all civilian labor force plus all marginally attached workers.
It is thus the broadest measure of labour underutilisation that the BLS publish.
In December 2006, before the effects of the slowdown started to impact upon the labour market, the measure was estimated to be 7.9 per cent.
In February 2019 it was down to 7.3 per cent.
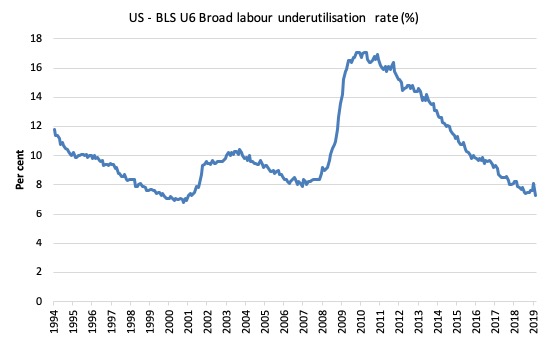
The U-6 measure is marginally below the pre-GFC level but remains above the trough of the early 2000s.
While it is signalling improvement, there is still some scope to go before full capacity is reached.
The US jobs deficit
The current participation rate of 63.2 per cent is a long way below the most recent peak in December 2006 of 66.4 per cent.
When times are bad, many workers opt to stop searching for work while there are not enough jobs to go around. As a result, national statistics offices classify these workers as not being in the labour force (they fail the activity test), which has the effect of attenuating the rise in official estimates of unemployment and unemployment rates.
These discouraged workers are considered to be in hidden unemployment and like the officially unemployed workers are available to work immediately and would take a job if one was offered.
In most advanced nations, the population is shifting towards older workers who have lower participation rates – so the US is not special in this regard.
Thus some of the decline in the total participation rate could simply being an averaging issue – more workers who have a lower participation rate as a proportion of the total workforce.
In this blog post (November 7, 2017) – Updating the impact of ageing labour force on US participation rates – I estimated that about 61 per cent of the decline in the participation rate since January 2008 has been due to non-cyclical shifts in the demographic weights (shifting age composition).
That still leaves a significant cyclical response.
Adjusting for the demographic effect would give an estimate of the participation rate in February 2019 of 65.2 per cent if there had been no cyclical effects (up from the current 63.2 per cent).
This would give an adjusted unemployment rate of 6.8 per cent rather than 3.8 per cent, if all the ‘hidden’ unemployed (since December 2006) were to be counted among the official unemployed.
To compute these job gaps, a ‘full employment’ benchmark of 3.7 per cent is used – this is where the US labour market reached in November 2018.
I explain in this blog post – US labour market – strengthened in February but still not at full employment (April 13, 2018) – is the best case scenario given that I actually think the cyclical losses are much worse than I provide here.
Using the estimated potential labour force (controlling for declining participation), we can compute a ‘necessary’ employment series which is defined as the level of employment that would ensure on 3.7 per cent of the simulated labour force remained unemployed.
This time series tells us by how much employment has to grow each month (in thousands) to match the underlying growth in the working age population with participation rates constant at their January 2008 peak – that is, to maintain the 3.7 per cent unemployment rate benchmark.
In the blog post cited above (US labour market – strengthened in February but still not at full employment), I provide more information and analysis on the method.
There are two separate effects:
- The actual loss of jobs between the employment peak in November 2007 and the trough (January 2010) was 8,582 thousand jobs. However, total employment is now above the January 2008 peak by 10,354 thousand jobs.
- The shortfall of jobs (the overall jobs gap) is the actual employment relative to the jobs that would have been generated had the demand-side of the labour market kept pace with the underlying population growth – that is, with the participation rate at its January 2008 value and the unemployment rate was constant at 3.7 per cent. This shortfall loss amounts to 4,8260 thousand jobs.
The following graph shows the US Jobs Gap, which depicts the gap between current employment and the level of employment that would have generated a 3.7 per cent unemployment rate, given current population trends.
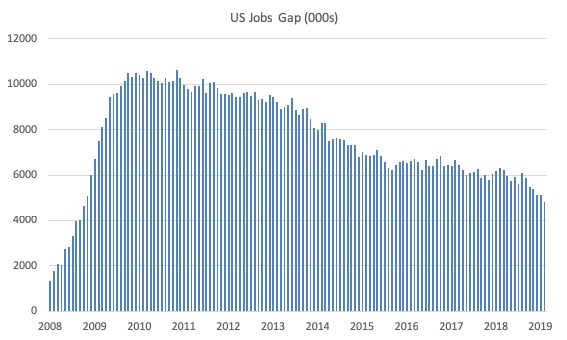
This reinforces the conclusion we reached above that the US labour market, while now enjoying a low official unemployment rate has not fully recovered from the GFC.
Conclusion
The February 2019 BLS labour market data release for the US tells me that the US labour market has probably weakened somewhat from where it was at the end of 2018.
Caution should always be exercised given the volatility of the monthly data especially this month, given the changes made to the population benchmarks last month.
We will get a better picture of where things are at next month.
However, it is clear that there is still a substantial jobs deficit remaining and considerable scope for increased participation.
That is enough for today!
(c) Copyright 2019 William Mitchell. All Rights Reserved.
“10,354 thousand jobs.
The shortfall of jobs (the overall jobs gap) is the actual employment relative to the jobs that would have been generated had the demand-side of the labour market kept pace with the underlying population growth – that is, with the participation rate at its January 2008 value and the unemployment rate was constant at 3.7 per cent. This shortfall loss amounts to 4,8260 thousand jobs. ”
I am unclear about the numbers. To me, 10,354 is ten thousand three hundred and fifty four. Or do you mean 10 million? Same for the number 4,8260. Four million, 8 thousand, 2 hundred and sixty?
Thank you!
Not being an economist, I must confess that much of the detailed analyses that Bill provides in this excellent blog escapes me. But I get the gist of it, as I get the gist of MMT in general, and that is more than enough to keep me visiting and participating here. I’ve now lived in the US for some 70 years, so I rely more on memory than statistics to try to get a handle on what has happened to my country. In my younger days, ample space was made for those who did not excel as students. You could graduate toward the bottom of your class or even drop out of school, and there was a factory job or similar position waiting for you that paid enough, was secure enough, to provide a viable life for you and your family. Today, there is nothing but a mad scramble to excel that kicks in even pre-school, and you either rise to the top and thrive or fall behind and wander about, for as long as you can, as a disposable person on the fringes of society. In today’s America, and it seems in many other countries, there is no longer any, much less ample space for the average or below-average person, for ordinary run-of-the-mill human beings like the vast majority of us. There are only winners and losers, with the breakdown appearing to be something of the order of 10% or 20% in the former category, 80% or 90% in the latter. This cruel, hyper-competitive system, so out-of-sync with the human scale (not to speak of the natural order) surely cannot last much longer, and thus the strain and anxiety, the deep sense of foreboding, which hang over us like a diagnosis of terminal cancer. Sorry for the rant, but this whole thing sickens me.
Newton Finn’s comment is excellent. It proves that economists today are mostly sociopathic idiots incapable of understanding the impact of their policies on society.
Newton – re March 12 at 1.12
I am surprised that after 70 years of US economic competition you are so astounded at its results – the change in composition of industrial activity, together with the re-location of much of international manufacturing only reinforces the unequivocal nature of its upheaval.
In keeping with this turmoil other countries have become involved in the educational struggle that underlies commercial dominance – that is their route to competitive living standards.
The fall-out from this re-positioning of world dominance can be brutal, but it brings with it the most creative benefits – not only in material prosperity but also in political and social developments; in the UK’s case as far back as the Plantagenet’s and Tudor’s.
There might perhaps come a time when humanity decides this cataclysmic chase for perpetual progress is not worth continuous resource depletion and the threat of extinction. But until we approach armageddon I guess the instinct to compete will rule our desires.
In fact, a mere five minutes of outright stability will have some people commenting that the whole thing makes them sick.
Didn’t say I was surprised or astounded, Gogs, just sickened. How can one maintain that neoliberal globalization has brought “prosperity” or “progress” in any lasting or meaningful sense, when one also realizes, as you apparently do, that the trajectory of this system is toward “armageddon” and cataclysm, entailing “the threat of extinction?” Sort of reminds me of the old line from the Vietnam War, that we had to destroy the village in order to save it. Surely you must hope, along with me, that humanity’s survival instinct will trump its competitive instinct, and that we will come up an alternative economic system we can live with, instead of die from. As for stability and change, do you know many human beings–any, in fact–who do not desire and need some of both?
Newton, you are correct in your supposition that people require an improved economic environment. Bill has often said that the best way to achieve this is by co-operation.
The economic system that we operate generally in the West is based on what is known as neo-liberalism, a format denigrated by MMT economists. And on the basis of their analysis of post-GFC results (upturns supported by private sector increasing debt), they could be right in their opinion.
My argument has its roots in a recognition that neo-liberalism is also associated with a competitive global economy that that breeds winners while dispossessing losers of livelihoods and thus imposing lower living standards. The solution that you would like is suggestive of greater government involvement in how the resources are allocated throughout the economy.
Bill has a preference for Public Goods over Private Goods, yet we live in a society that is driven by consumer demand. For Bill’s preference to materialize there will have to be a change in the ideology supporting economic policy – this would introduce greater government control over resource allocation.
AS a US based citizen are you content with that prospect and are there enough others who are willing to explore its implications.
I am, Gogs, and there is a growing number of Americans, especially among the young, who are eager to engage in this exploration, having found themselves, unlike their parents, largely disenfranchised from the current economic system. This goes back to my earlier rant. I would further argue that the environmental crises to which we’ve both alluded will compel increasing public control over the private sector. My hope is that the ideological shift will be toward what Schweitzer distilled at the close of the First World War: the elemental, universal principle of reverence for life, grounded in one’s personal survival instinct but expanding outward to include all of life itself. MMT seems to provide the appropriate agency to pursue this principle, because it is inherently cognizant of resource constraints, and the overriding one is the viability of the entire biosphere. Thanks for the back-and-forth.
Gogs – Neoliberalism is a political ideology, not an economic system. The key is the “Neo”. It has much less to do with the scale of “government intervention” than the aims of “government intervention”.
Aside: “Government intervention” is a logically nonsensical idea that fully deserves scare quotes. To think that governments intervene in a magically pre-existing “economy” – rather than economies by definition being embedded in self-governing societies is to be confused and not fully grasp MMT.
Again – the “neo” means this ideology is an attempt to return to the past – to use government to often massively intervene to re-create something that looks like 19th century classical liberal conditions – especially from the viewpoint and for the goals of the well off. In neoliberalism, societies cooperate to shield the well off and major corporations from competition. So it is not a simple cooperation vs competition thing, and lastly a great majority of writing about “international competition” or comparison to some Darwinian winner v. loser process is sheer nonsense.
For instance, FDR’s 1941 pre-Pearl Harbor USA had less “government intervention” than today, but was a great deal more consistent with MMT thought than today’s USA. Finally, there is no question that the neoliberal age saw slower growth in living standards, science and technology – in a word “progress” – than the earlier purportedly “interventionist” postwar era.
By gum Some Guy, that was quite a mouthful to take in.
If we start with neoliberalism, I’ve never been entirely comfortable with that phrase and generally think about it as being synonymous with mainstream economic attitudes.
Government intervention may be logical nonesense, but I’m not using it in any scientific context. It merely means (as far as my usage is concerned) that a government can be influential in the way the economy operates. That assumes it has some leverage over resource allocation and the distribution of any outcome from that action.
I note your comments about competition and the link you make with neoliberalism’s protective role (in terms of asset owners). Whilst acknowledging this aspect, my own approach to competition is to acknowledge a basic human instinct that allows competition to determine, to some extent, how our lives thrive – whether its in commercial activities or (for instance) even marriage.
I am also inclined to accept that competition favours those people with certain economic attributes more than others (as with entrpreneurs) and this must be mitigated if inequality is not to alienate whole sections of the populace.
Bill has spoken on many occasions of the benefits of implementing co-operation in preference to competition. I do not disagree with this sentiment, but looking around at the numerous ways competition is allowed to prevail it would appear that we are a long way off a point where competition is bridled within much tighter boundaries.
Because competition is allowed to prevail there are bound to be winners and losers, whether confined within national boundaries or not. I cannot recall making an explicit reference to a Darwinian interpretation of this. But if you accept that competition is an inherently human trait, perhaps there is an excuse for using the Darwinian comparison.
AS for the progressive benefits of government intervention, I have no objection to how progress is achieved. All I would say in that respect is that progress in my lifetime has been considerable, during a period that has seen “interventionist” socialist governments, neoliberal socialist governments and “free-market” governments.
The overriding point of all this conjecture is to establish what works; it is not necessarily down to ideological superiority. Visionary leadership and drive are worthy contenders.
I look forward to more opportunities to absorb the literature and practical application of a subject which captures so much of human activity and thought.
There was even a TV soapie series in Aust. recently, entitled ‘Winners and Losers’. A show for the times, then.
Yes, for those of us who’ve lived through the 60s and 70s, and then watched the ongoing Reagan~Thatcher~Friedmanite austerity-policy entrenchment, it’s a stark contrast. We at least here got the restoration of a national health system, due to a Labor resurgence; only then to have them foist an unnecessary superannuation system on us, which the later ascendent super-neoliberal LNP put on steroids as a fee-extractor. Not sure where the next couple of years will take us, TBH.
Labour has got lot of importance in the world. All big mansions, grand high ways and large mills and factories are fruit of labour of man. If there had been no labour, we would have lived in desert, but in our country we most of people are in habit of hating labour. We consider it menial work. We feel shame in doing work with our own hands.