It's Wednesday, and as usual I scout around various issues that I have been thinking…
The austerity attack on British local government – Part 1
On Sunday, May 12, 2019, I will be presenting a workshop in London on – Local Government Funding: Challenging the Status Quo. Basically, I will be speaking about the way in which flawed understandings of the capacities of currency-issuing governments, combined with a vicious, ideological attack on working people from a government fully invested in neoliberal transfers to the elites, have ravaged the capacity of local government in the UK to deliver essential public services. See the Events Page for more details. It is a public event and I hope people support it. To prepare for that workshop, I have been digging deeply into the data to fully acquaint myself with how the ideological austerity push has been distributed across central and local government service delivery. It is no easy task. The data is a ‘dog’s breakfast’ and coming to summary positions is quite time consuming. There are also nuances in the way local government is structured (particularly since the Thatcher years where devolution and cost-shifting was accelerated), which mean that care must be taken in making sensible comparisons. Here are some of the things I found. I have learned a lot in this process, which is a good thing. This is Part 1 of a two-part series.
Structure of Local Government in the UK
I live in a nation with three levels of government (federal, state and local) where the federal and six states and two territories states are tied together by the federation and the local governments (560 councils at last count) are creatures of Acts of Parliament passed in the state legislatures.
There is a major vertical imbalance in our system where the currency-issuing Federal government dominates in terms of revenue collection and the currency-using states have responsibilities for the major expenditure functions (hospitals, education, housing, police and fire services, etc).
The local councils are usually responsible for urban roads, planning controls and regulations, garbage disposal and that sort of thing.
While the local councils collects land value-based rates and levies fees for its services, they also receive a major share of their income from grants from higher levels of government.
This Parliamentary Education Service document – Closer Look – Governing Australia: three levels of law-making – is very informative.
Now, coming from that background and trying to come to terms with the UK system of government is no easy task.
First, the UK is not a federation. It is a unitary government system.
Second, local authorities in the UK are created by Acts of Parliament as statutory bodies but “they are not accountable to Parliament” (Source).
Third, for Scotland, Wales and Northern Ireland, local government is a “devolved responsibility”.
Fourth, local governments “deliver services in line with national objectives, and in a manner that meets the diverse requirements of different neighbourhoods and communities. Services are delivered directly through their employees and indirectly through other bodies. Outside agencies also play a role in service delivery.”
So, if was to try to be crude by way of comparison, they have the sort of responsibilities that Australia’s state and local governments have put together. Mostly that is accurate.
Fifth, local government in England are not all structured alike – there are, in fact, six forms (Metro Districts, London Boroughs, Unitary Authorities, Shire Counties, Shire Districts, and Single Purpose Authorities). The Shire Counties and Districts dominate the so-called “shire areas”, which are outside the large metro regions and London.
That complexity also makes it hard to track down and build a sensible summary database.
Sixth, the way fire and police services are provided is also an added complexity, which I won’t go into but am happy to know about.
Seventh, then we hit the “Parishes and Charter Trustees”, which are an additional tier of local government (there are in excess of 10,000 of these localised taxing bodies).
The way local governments spend is two-fold:
(a) they raise their own revenue (council taxes, etc).
(b) they receive central government grants.
Capital spending (infrastructure) is “principally financed through central government grants, borrowing and capital receipts”.
The complexity is that not all local authorities can collect council taxes. Some 94 (out of 444 local bodies) have only “precepting” status, which means they have to get money from a “billing authority” (a council that can collect taxes) or elsewhere.
The “Police and fire and rescue authorities are also precepting authorities.”
Central government spending trends since 2010
The current Tory government was elected in May 2010 on a platform to cut the fiscal deficit.
The most recent British Treasury data – Statistical Bulletin: Public Spending Statistics February 2019 – (published February 28, 2019) – provides details of the ‘outurns’ (actual spending) of the central government by department.
This data is the principal framework the British government uses to “to plan and control expenditure”.
It includes “departments’ own spending as well as support to local government and public corporations”.
The first graph shows the evolution of Total managed expenditure (TME) for the central government from 1997-98 to 2017-18 (at 2017-18 prices).
From 2010-11 to 2017-18, real public expenditure has declined by 1.1 per cent.
At the same time, the overall British population has increased by around 4.8 per cent.
Which means in per capita terms, real TME has declined by 5.7 per cent, which amounts to around £728 per person as at 2017-18.
So the British government’s austerity push has clearly reduced the material well-being of the British people.
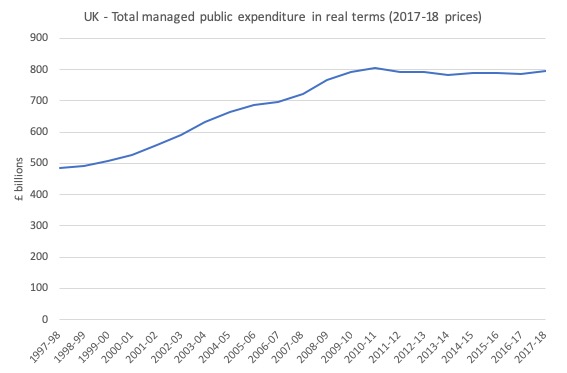
Overall managed public expenditure declined from 44.9 per cent of GDP in 2009-10 to 38.47 per cent of GDP in 2017-18. However, the average over the decade before the GFC was 36.5 per cent so the increasing proportion was mainly due to the large dip in GDP as a result of the crisis.
That is clear enough.
But with the service delivery functions of the British government there have been substantial shifts in the overall spending patterns, which provide a gloomier picture of the austerity impacts.
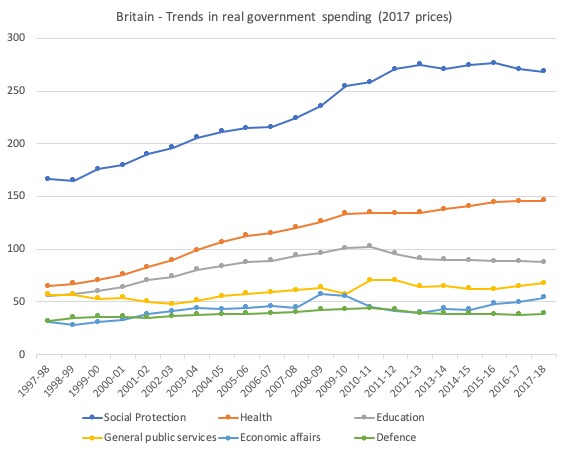
The following graph (Chart 1 in the publication) shows the real spending by department since 1997-98 (to 2017-18) on a comparable basis (given the changing departmental responsibilities).
The trends are clear enough. After some real growth in spending on social protection, there has been a 2.9 per cent contraction in the two years up to 2017-18.
Real spending on health has increased over the period of Tory rule but that growth has virtually disappeared in recent years.
Worrying is the real decline in spending on education (largely due to cuts in grants to local authorities) – it has been cut by over 14 per cent in real terms. Education is the major avenue for future productivity growth and social inclusion. It might be easy to trash in the short-run, but the long-run consequences are devastating (for both citizens and the overall national performance). Hacking into spending on education is a classic myopia that neoliberals fall into.
Real spending on Economic affairs has risen the most over the Tory period (20.9 per cent). Economic affairs includes enterprise and economic development (1.3 per cent of total spending); science and technology (0.7 per cent of total), employment policies (0.4 per cent of total), agriculture, fisheries and forestry (0.7 per cent of total), and transport (4.3 per cent of total).
Most of that growth has been in handouts to business and transport (mostly Network Rail) with employment policies taking a 44.6 per cent cut over the period from 2010-11 to 2017-18. That clearly reflects the priorities of the Tory government.
Both General public services and Defence spending contracted in real terms over the period examined. General public services includes public and common services (1.7 per cent of total spending), international services (1.5 per cent of total), and public sector debt interest (6.1 per cent of total).
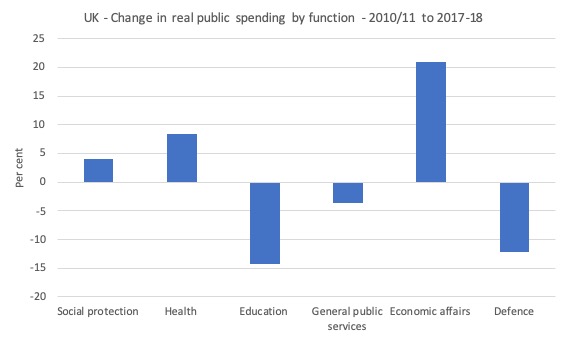
The next graph shows the percentage shifts in real expenditure in these service areas from 2009-10 to 2017-18.
Driving the austerity agenda
Britain’s governmental structure is dominated by the central government. The decentralisation of authority to local governments has always been highly conditional.
In their 2018 paper – The depths of the cuts: the uneven geography of local government austerity – published in the Cambridge Journal of Regions, Economy and Society (Vol 11, pp.541-563), Mia Gray and Anna Barford trace the way the shifting ‘public finance’ patterns in Britain have impacted on the regions.
They emphasise that:
Public finance is politics hidden in accounting columns.
They seek “to understand austerity and its role in reshaping the relationship between central and local government.”
The paper uncritically accepts the 2010 narrative from the Tories that there was an “unambiguous problem of sovereign debt” in Britain and “that invoked inevitability, the probable consequences of spooking financial markets and the prudence of fiscal responsibility”, which I found problematic in the extreme.
But their descriptive spatial analysis of the way this austerity has impacted on the capacity of central and local government to provide public service is interesting.
But their point that the UK has “one of the most centralised local government funding systems in the OECD, with diminished fiscal control and autonomy for local government … Despite its embrace of neoliberal policies, Thatcherism retained the highly centralised apparatus of the UK state” which maintained “tight control over local government”.
While devolution gave Scotland, Wales and Northern Ireland more autonomy in how they fund their local governments, the local authorities in England were held on a tight leash by the central government and have borne the worst of the austerity.
I would not, however, want to overstate the ‘freedom’ that devolution has given Scotland, Wales and Northern Ireland.
Austerity is drilled down from the centre to the local levels.
The SERC Discussion Paper 62 (October 2010) by Andy Pike and colleagues – In Search of the ‘Economic Dividend’ of Devolution: Spatial Disparities, Spatial Economic Policy and Decentralisation in the UK – traces the results (the so-called ‘economic dividend’) of the devolution of power in the neoliberal era.
They note that (p.5):
… the political-economic tide turned away from Keynesianism and its redistributive spatial policy toward neo-liberalism … during the 1970s. Characterised by de-regulation, liberalisation and the attempted ‘rolling-back’ of the state, the UK variant led by Margaret Thatcher’s Conservative administrations from 1979 emphasised individual responsibility, free markets and enterprise which underpinned the critique and dismantling of regional policy during the 1980s. The turn toward neo-classical economics and the free market interpreted Keynesianism and regional policy as distortions and impediments to rational and efficient decision-making amongst economic actors.
Please note that this paper was subsequently published in the Journal – Environment and Planning C: Government and Policy (Vol 30, pages 10-28) in 2012. I am using the 2010 pre-published version because it is freely available.
But it does cut both ways.
The Gray-Barner paper notes that in the face of cuts:
… local government associations in England, Scotland and Wales have consistently argued that capping local budgets and funding is ‘an affront to local democracy’
They have pushed for more autonomy to gain greater shares of business taxes and the like.
Many local governments have thus embraced the ‘competitive’ paradigm and engage in old-fashioned ‘smokestack chasing’ – competing for private investment via the offer of cheaper land, taxes.
The history of ‘smokestack chasing’ and the literature that has studied the phenomenon tells us that it not only undermines the welfare of other regions in the nation but also compromise the position of the region doing the ‘chasing’.
The Gray-Barner paper uses the term “race to the bottom” to describe the phenomenon.
It also tends to create further divergences between regions because more prosperous regions are typically more attractive to capital.
The conclusion is that this sort of neoliberal devolution, which has set local authorities up against themselves:
… leads to increased competition, aggressive and injurious local rivalries … and a widening of regional economic disparities.
Further, the dependency of local regions on central government grants varies considerably across the UK. The more prosperous local areas rely less on central support, while other areas depend on the central government for upwards of 80 per cent of their income, given their weaker tax bases.
Austerity in this context then creates massive disparities.
The March 2015 Report from Ron Martin, Andy Pike, Pete Tyler and Ben Gardiner – Spatially Rebalancing the UK Economy: The Need for a New Policy Model – published by the Regional Studies Association, concluded that:
1. “Regional disparities in economic performance in the UK are now greater than those found in any other European country”.
2. The “spatial economic imbalance in the UK has to do with the progressive concentration of economic, political and financial power in London and its environs.”
3. “UK’s northern areas have the underlying potential to ‘turn around’ from the decline of their industrial base but this will require a step change in the level and control of the resources that are made available to them”. As we will see in Part 2, austerity has deliberately deprived these regions of resources.
The reality is that the austerity push by the Tories has been a rather tawdry example of neoliberal depoliticisation – pushing the hard decisions of public sector cutbacks down to the local government level – to avoid having to take responsibility for the human impacts that the austerity has brought.
The Gray-Berner paper concludes that:
These targeted cuts to local government are intended to move Britain towards a ‘small state’ by reducing local governments’ ability to provide services that make up the broad array of services under Britain’s welfare state.
And as Wolfgang Streeck noted in his 2014 paper – The Politics of Public Debt: Neoliberalism, Capitalist Development, and the Restructuring of the State – published in the German Economic Review (Vol 15, pp.143-165 – you can download the Working Paper) “the consolidation state” (the hollowing out process using austerity) has been largely accomplished by “cutting expenditures by retrenching state activities in line with neoliberal standard recipes”.
Tax increases are eschewed.
In squeezing spending, austerity-minded governments have to choose between “cuts in either mandatory or discretionary public spending; the former being by definition more difficult to make than the latter, at least in the short term”.
As a result, they tend to cut discretionary spending which:
… includes public investment in the physical infrastructure and social investment in education, science and technology, labor market policy, family services, and the like.
The UK government’s attack on local authorities is consistent with this pattern.
I have written about this decentralised austerity before in these blog posts (among others):
1. The urban impact of the failure of austerity (January 26, 2016).
2. Brainbelts – only a part of a progressive future (July 25, 2016).
3. The blight of the visitor economy (February 6, 2018).
Part of the story is that the Third Way movement pioneered new ways to misrepresent the retrenchment of the public sector. New regionalism was one such tactic and claimed that that the nation state was dead and, instead, there were competitive regions whose fate depended on the entrepreneurial skills contained within.
They would prosper if they exported the products of these skills.
New Regionalism proposed a series of ‘solutions’ or separate policy agendas that built on individualistic explanations for unemployment and accepted the litany of myths used to justify the damaging macroeconomic policy stances of the type witnessed in Britain under the Tories.
It claim, consistent with the growing neoliberal emphasis on ‘individualism’ that policy, in general, was to be ‘light touch’ but focused on individuals (people) rather than places. This was classic ‘market incentives’ type reasoning.
It was motivated by the assertion that a person’s location was immaterial and that their efforts, ingenuity etc were the driving forces in determining improved economic outcomes.
See the blog post cited above (1) for more analysis.
It was a dud concept.
Most these claims were based on induction of regional ‘successes’ without regard for the specific cultural or institutional contexts, and lack any coherent unifying theoretical underpinning.
It is highly disputable whether the empirical examples advanced to justify the claims made by New Regionalist proponents actually represent valid evidence at all.
In all cases of regional success, a supportive macroeconomic policy framework – read deficit spending from the currency-issuing government – is also observed.
The future of regions thus is still tied in lock-step with the way in which the nation state conducts fiscal policy.
It appears obvious that, in words of Gray-Berner that:
… austerity at the local level is part of a longer-term political project to re-shape and redefine the welfare state at a national and local level; even if this is marked by complexity, fragmentation and incoherence.
And that is where the struggle has to be.
Focusing on crafty ways to get extra revenue – through the offer of ridiculous incentives to businesses to locate or whatever – is just accepting the process and dying a slow death.
It reminds me of the higher education cuts in Australia that began in the early 1990s. The Vice-Chancellors of the universities demonstrated appalling leadership as the cuts mounted and individual universities were set up in competition against each other – fighting for students, research grants etc.
The VCs individualised the problem and set about increasing ‘net revenue’ through a raft of dodgy courses, internal cuts, which eroded quality, and more.
If they had have, instead, combined and responded to the cuts by cutting student intake, thus denying the middle class and upwards kids a chance at university entry, they would have created a political problem for the federal government.
That would have changed the dynamic entirely.
So in Britain, that is the challenge.
Conclusion
In Part 2, we will examine how this austerity agenda initiated by the harsh central government cutbacks to the local authorities is impacting locally.
The numbers are devastating. But the impact on the human condition is where the focus should be and the class struggle emanate from.
That is enough for today!
(c) Copyright 2019 William Mitchell. All Rights Reserved.
Interestingly there’s a letter in FT addressing the difference between local and national debt in China – MMT positive: https://www.ft.com/content/c3b5ed20-6843-11e9-9adc-98bf1d35a056. Amazingly, the first letter was from Richard Murphy challenging Gavyn Davies’s article on MMT: https://www.ft.com/content/c27f83ee-6843-11e9-9adc-98bf1d35a056.
Wow. You are such a clear thinker. Thank you.
Sorry that I can’t find a decent reference, but my understanding is that schools here are largely funded by central government nowadays since the push for academisation (privatisation) whilst local authorities are responsible for special needs education.
Excellent read as usual.
Looking at Bill’s graphs, the expenditure in social protection and health has gone up despite the overall reduction in spending as a % of GDP. Maybe I missed it, but it would be interesting to have some more context on these two and why they are the only departments besides economic affairs to have gone up since 2010.
I would suspect theat the sharp rise around 2008 in social protection spending came as the result of the automatic stabilizers kicking in at the height of the GFC but wonder why they have failed to follow the decreasing unemployment rate afterwards.
As for health expenditure I’m thinking privatization of services. Particularly when it involves services that turn into defacto monopolies on regional scale (like water treatment and supply) it is quite often industry and “the market” themselves who cry foul, since prices usually follow the pursuit of profit of the new owners. So I’m wondering if the rise in health expenditure is a combination of austerity actually making more people sick and any partial privatization of NHS services. Given that no real “bump” in expenditure is noticable, it would fit the steady and gradual outsourcing of services.
Please indulge this little etymological excursion of mine:
Definition of private
(Entry 1 of 2)
1a : intended for or restricted to the use of a particular person, group, or class
comes from:
Definition of private (Entry 2 of 2)
1 archaic : one not in public office
comes from:
Definition of privo, privare, privavi, privatus (lat.)
1: deprive, rob, free*
* This one seems a bit odd, but I’d bet it refered to when a slave was “robbed” from his owner 😉
Cheers!
State and local governments are financially constrained to spending whatever Australian dollars they can obtain from tax receipts, fees, fines, bond issuance, asset sales, and grants from the federal government. These governments are not currency issuers. They are mere currency users. This limits their policy options.
From a macroeconomic standpoint there is no need for state and local taxes at all. It would be optimal for the federal government to negotiate with the states to effect the abolition of all state and local taxes, to enact its own version of those state and local taxes that serve useful public purposes (such as reducing inequality, encouraging sustainable resource use, and discouraging harmful activity), and to commit to fully funding the budgets of the state, territory, and local governments with no strings attached. The role of the state, territory, and local governments should be to manage and administer their federally guaranteed budgets, and to design and deliver public services and infrastructure that meets the needs of their constituents. It is a waste of their time to be raising revenue.
The Australian Government could guarantee that no state, territory, or local government area will be worse off than it is now in terms of per capita spending by all levels of government combined.
The Australian Government and each state, territory, and local government could agree to a methodology for determining the budget allocations to the sub-national governments.
This methodology would encompass factors such as
the population of the state, territory, or local government area
the demographic composition of the population
the extent of socioeconomic disadvantage
the spatial distribution of the residents
the costs of delivering services (which are typically higher for states with more geographically dispersed populations)
“(a) they raise their own revenue (council taxes, etc).
(b) they receive central government grants.”
This isn’t quite the whole story and it is changing.
First of all Business Rates are collected by Local Authorities and were, until 2013, remitted to the Treasury, supposedly for redistribution as grants to Local Authorities (but as MMT students know they are actually removed and then the Treasury distributes newly issued money). From 2013 Local Authorities were permitted to keep 50% of Business Rates and from 2020 that will be increased to 75%. Meanwhile, this increase in income is compensated for by reductions in Local Authority grants and, by 2020, under the Fair Funding Review (qv), most grants will cease altogether other than for infrastructure, schools and police which have their own hypothecated funding.
Second, until recently local authorities were responsible for paying housing benefits. Again this is changing with the roll-out of Universal Credit by which Central Government takes it over. You see nothing about any of this in Party manifestos for the elections this Thursday. Just complaints about how Local Authority funding is being cut and cut.
Sorry, I sound like a Tory which I most certainly am not.
I’m beginning to believe that Bill Mitchell is a forensic specialist who just happens to practice his craft in the economic academic community. Applied economics supreme. I like it. I wish someone would fund a Mitchell, or another equally qualified MMT expert, study into the US public finances. I believe much of what Britain is suffering from is alive and well in the US too.
Bill, what is the best way to determine whether an economy is operating at or close to capacity?
If we can gauge that, we should be able to offer guidance on the safe upper limits of net government spending.
Unemployment is an obvious candidate although there are well-known problems of definition and measurement. Interest rates might be another and perhaps bank lending. Maybe some combination of factors.
On the other hand, your blog on local government spending is a reminder that economies consist of regions and regional (not to mention class) disparities can make a nonsense of national data.
The UK is an extreme example. Central London is one of the wealthiest areas in the world, with a booming mini-economy (partly thanks to massive government largesse), while other parts of Britain are among the poorest and most deprived in western Europe. Is it even possible to talk sensibly about a British economy?
Nigel- the move to business rate retention is seen as a crazy policy because of it happening simultaneously to the collapse of High Streets and the almost inevitable increase in internet shopping and centralised delivery of groceries. bankruptcy rates have been increasing steadily.
The reduction in General Revenue from central Government means that there is MASSIVE financial uncertainty at a time when we least need it. Even my own Tory ruled council in the Tory heartlands admits this in their latest accounts.
Just to add that, although the austerity imposed by rich boys Cameron and Osborne was harsh, this came after years and years of more gradual cuts, starting with the Thatcher era. Those cuts cut into the “fat”, and then into the “flesh”. Cameron and Osborne, and then May’s and Hammond’s cut into the “bone”, designed to destroy the structure of public service, and make way for privatisation.
And Just to add to Carol’s comments about education: being born in the immediate post-war era, I had the luxury of growing up with a good and growing local infrastructure, provided largely by a well-funded local authority. As well as providing school education, they often also provided Further and Higher (especially technical) education. You would often see schools and colleges of FE on the same campus, and in some cases, polytechnics on the same campus. And while the universities were quasi-independent, the finances for the students were administered by their local authority, i.e. grants to cover fees and living expenses. Fees were always (I think) covered in their entirety (even for posh boys like Cameron and Osborne), but living expenses depended on parental income. Rich parents had to make a parental contribution. But for most working class kids, if they got to university, both fees and living expenses were provided in full. This system was gradually destroyed by other posh boys, some of them allegedly socialists (like Tony Blair), leading to a generation saddled by student debt.
Good radiography of the Neoliberal structure of the UK.
Will the People of the UK one day realise that the roots of their pathetic predicament are internal and due to Neoliberalism? Brexit will solve nothing and indeed it will make things worse by erecting unnecessary barriers between the Neoliberal UK and their major commercial partner, the EU.
But Neoliberalism is also a major barrier for the full and satisfactory integration of the EU at large.
A new Social Democracy is urgently needed, but it is an error to think that everything must be demolished and something that has never be seen before built over the ashes of the old system. There is much that can be utilised from previous Social Democratic experiences… People will embrace more willingly what they can better understand.
In reply to Mike Ellwood, who wrote: “And Just to add to Carol’s comments about education: being born in the immediate post-war era, I had the luxury of growing up with a good and growing local infrastructure, provided largely by a well-funded local authority. As well as providing school education, they often also provided Further and Higher (especially technical) education.”
Your comment describes a phase of the evolution of capitalism known as the Social Democratic period (end of WWII to mid-1970s). Social Democratic parties were subsequently allured by the emerging Neoliberalism into giving up their commitment to the social wellbeing of the people in order to achieve the dream of faster growth and greater competitive capacity. The end result of that experience is that the People lost all the old benefits of the original Social Democracy, that included lower levels of inequality, and gained nothing in return except fictitious wealth grown on debt. As a consequence, Social Democratic parties across the Western World became associated with Neoliberalism alongside their Conservative counterparts, giving raise to the common mantra that Conservatives and Social Democrats are just the same; or, in Australia: Libs and Labs are just the same.
We urgently need to return Social Democratic parties to a true Social Democratic path. The ALP in Australia has been abandoning Neoliberalism since Rudd’s Keynesian response to the GFC, hence Libs and Labs are not the same. The pace of change may not satisfy everybody, but it cannot be denied. Unless the current trend within the ALP is supported it will fail. If it fails, we get more Neoliberalism.
There is no minor party that can credibly stand up and take the country in a Social Democratic direction. We are at a crossroads and I hope that progressives from all walks of life will unite to get rid of the Neoliberal Coalition. Whatever you think of the Social Democratic Labor, they have demonstrated that they can evolve. Will they ever function within a full MMT paradigm? I don’t know but it’s unlikely to happen in the near future. However they can be supported in order to reinforce their more classical Keynesian approach. Over time we may witness further evolutionary changes and improvements.
The issue of the grotesquely regressive nature of council tax needs to be emphasised given that it is based on house values from 1993, if I remember correctly. This means the massive gains in house values are not reflected in the tax take for the local authority.
“Bill, what is the best way to determine whether an economy is operating at or close to capacity?”
I’m sure it’s more complicated than this, and would involve spatial and sectoral complexities, but I would assume, in aggregate, it’s when there’s no-one left working within the Job Guarantee scheme?
Hence the non-optional nature of the JG within MMT?
“Will the People of the UK one day realise that the roots of their pathetic predicament are internal and due to Neoliberalism? Brexit will solve nothing and indeed it will make things worse by erecting unnecessary barriers between the Neoliberal UK and their major commercial partner, the EU.”
This is the view I encounter expressed by so many remainers – that neo-liberalism and it’s associated austerity is mostly just a British Tory phenomenon and the EU is by contrast, something approaching a paragon of social democracy. Ergo, one need only change the national government to completely reverse all the malaises being inflicted. It must take a tremendous amount of denial to convince oneself that this is actually a factual position and that the EU is anything less than the ultimate expression of neo-liberalism which places austerity as among the loftiest of it’s goals and seemingly almost an end in itself.
Unless I have missed something, austerity is not merely Tory policy – it is a major foundation stone of EU policy. As long as one remains part of an arrangement where national governments agree to cede significant portions of their sovereign power over their own people’s affairs to a supra-national body which places primacy on arbitrary figures on a spreadsheet while virtually ignoring the staggeringly appalling growth and unemployment outcomes as though they were inconsequential – exactly how is merely shuffling the national leadership pack over and over likely to produce any greatly different result overall?
@Simon Cohen,
Hi Simon, I think the 1993 valuation issue is a bit of a red herring tbh.
Although the main iniquity lies in the low 3:1 ratio between the 8(?) minimum to maximum Council tax bands, the council still requires £x per annum, regardless of whether local property values go up or down, in aggregate.
It’s the relative values within the council boundaries that count, as well as the levels of local need, and central govt support that determine local authority revenue requirements, and their potential income.
Hitching local council revenue to absolute property values is creating a hostage to fortune if those values fall – but relative valuations within the council boundary are fairly constant over time, so a revaluation wouldn’t really change much, in aggregate – but if implemented on absolute 2019 values could make council tax potentially unaffordable for even lower banded properties, with no reference to ability to pay.
@Mr Shigemitsu, Council Tax valuations were actually done in haste in 1991. But they are almost irrelevant as councils are only able to apply a rate where the highest band gives a tax 3 times the lowest. It’s not much better than the Poll Tax which it replaced. As I keep reminding people, the owner of a mansion in Westminster pays almost the same Council Tax as the tenant of a bedsit in Weymouth (https://www.ft.com/content/d7eebd70-1e3e-11e9-b126-46fc3ad87c65). Not that long ago he actually paid less.
I agree with Simon Cohen that Council Tax is highly regressive.
However, (and I think Carol’s posting tends to support this), that with the banding system that was put in place, council tax was never really meant to relate directly to the absolute value of a property.
It was more to establish relative values among a group of properties (albeit in a very crude way and with very little “granularity”), as a basis for charging. It is certainly scandalous that owners of mansions can pay the same or less than occupiers of bedsits, but I don’t think raising council tax by the same ratio as property price inflation (which itself has been a horrible distortion, comparing say, average incomes to average property prices) would be a good solution.
The system certainly needs reform though.
@MikeE, see my proposal for scrapping Council Tax and introducing LVT on the Labour Land Campaign website under Resources/Papers and Articles, 2nd item. It was prepared for a discussion in the Labour Land Campaign, hence the unfamiliar names. I have to say not everyone agreed with me:o(
Nice read. Will you look at the issue of borrowing arrangements among local authorities (IIRC councils borrow from the government at a fixed spread over gilts, around 100bps, but the approvals process is cumbersome (also it was bloody cheeky of the government to lend at a fixed 100bps spread during QE – 3M £ LIBOR never hit 100bps over 3M Gilts over the last decade).
Mike Mr, Shigemitsu, Carol,
All good points about the relative value issue of the Council tax and ability to pay. In some cases the house will only offer ability to pay if you sell it!
Introducing LVT now when the genie is out of the bottle is also tricky. I think the option of a massive social housing building project combined with credit controls might help, it seems the loosening of credit controls in 1971 started the series of bubbles rolling and the ‘house as investment vehicle’
It’s now an unholy mess with house ownership in absolute decline since 2003-so much for Thatcher’s house ownership ‘revolution.’
Maybe we need a rethink of local taxes, linked to income-so a local income tax as well as a national one as MIke seems to suggest?
@Simon, I wasn’t consciously thinking of a local income tax, but I must admit, before I became aware of MMT concepts, that is what I would have favoured. (Although one argument against relying on income tax is that certain classes of people can always find ways of making their income look lower than it actually is, and avoiding a lot of tax; this is the argument instead for a property tax, or perhaps a hybrid system.
However, now being aware of MMT concepts, I feel I have to revise my views on local government funding, and certainly haven’t come to any clear ideas. As MMT-aware people, we know that national taxes don’t fund anything. But local government taxes do. But local government has traditionally been funded by a mixture of grants from central government and locally-raised taxation (although those grants have been heavily cut back in recent years). As MMTers, we know that national taxes do not raise money for spending; rather they actually drain off money from the wider economy. But local taxation does not work that way; it actually (well, if spent wisely), actually injects money into the local economy (although local taxpayers lose some of their spending power, as a result – I think that would be an example of re-allocation of resources for the public good).
How you get the balance right between local taxation and central government funding is a difficult question. Ideally, in an MMT-aware world, I think I’d like to see it all funded centrally, with no local taxes at all (at least not for funding purposes – I could see that they might be useful for affecting people’s behaviour, i.e. imposing charges for certain sorts of activity that are not in the public interest.
But this would demand a high degree of co-operation between local and central government, and a sensitivity on the latter’s part for local needs. I can see this working in places like Scandinavia, where co-operation seems to come as second nature. But not here in the UK, certainly not since the end of the post-war “golden era” where people of all political hues shared at least a basic common vision of how society should grow. Thatcherism destroyed that (but if Thatcher hadn’t, someone else would have; that post-war vision could not realistically survive more than about one generation, sadly).
Mike, a local income tax is the way to go under present and foreseeable circumstances. In the US, one is taxed a lot. There are federal taxes, state taxes, and sometimes county and local taxes. Each state has its own take on this, so it is difficult to make specific statements. Given the way the US is structured, it is unlikely that this will change. There are also sometimes sales taxes, which, where they are applied, can be avoided if the goods are shipped either out of the city (as in NYC) or out of the country.
So, council tax based on property values can go. It is regressive anyway. Carrying this view forward, business rates should be based on how much income the business generates and not on where in the city, for instance, it is. The assumption is that, if a business is in the center of town, it will generate more business and, therefore, more income. This is not invariably the case. I have simplified the situation somewhat but not distorted it.