Today (April 18, 2024), the Australian Bureau of Statistics released the latest - Labour Force,…
Australian labour market improves slightly but remains in a fairly weak state
The Australian Bureau of Statistics released the latest data today – Labour Force, Australia, May 2019 – which reveals a slightly improved labour market although full-time employment growth was weak and total hours worked declined. Underemployment rose slightly (0.1 points) to 8.6 per cent further accentuating the fairly weak overall situation. The total labour underutilisation rate (unemployment plus underemployment) remained steady at 13.7 per cent and the persistence of that level of wastage makes a mockery of claims by commentators that Australia is close to full employment. The other disturbing outcome was that full-time and total teenage employment also fell. My overall assessment is the current situation can best be characterised as remaining in a fairly weak state. Most of the dynamics over the last few months have been due to swings up and down in part-time employment.
The summary ABS Labour Force (seasonally adjusted) estimates for May 2019 are:
- Employment increased 42,300 (0.3 per cent) – full-time employment increased 2,400 and part-time employment increased 39,800.
- Unemployment decreased 2,400 to 704,700 persons.
- The official unemployment rate remained steady at 5.2 per cent.
- The participation rate increased 0.1 points to 66 per cent.
- Aggregate monthly hours worked decreased 5.9 million hours (-0.33 per cent).
- The monthly broad underutilisation estimates for May 2019 show that underemployment increased 0.1 points to 8.6 per cent (1,160.7 thousand). The total labour underutilisation rate (unemployment plus underemployment) remained steady at 13.7 per cent. There were a total of 1,865.4 thousand workers either unemployed or underemployed.
Employment increased 42,300 in May 2019
Employment growth was stronger in May 2019.
Full-time employment increased 2,400 and part-time employment increased 39,800.
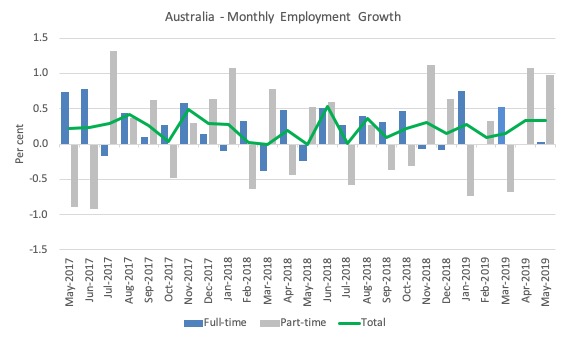
The following graph shows the month by month growth in full-time (blue columns), part-time (grey columns) and total employment (green line) for the 24 months to May 2019 using seasonally adjusted data.
The zig-zag pattern where employment growth has regularly been around zero remains evident.
All the dynamics in the last few months have been marked by swings in part-time employment.
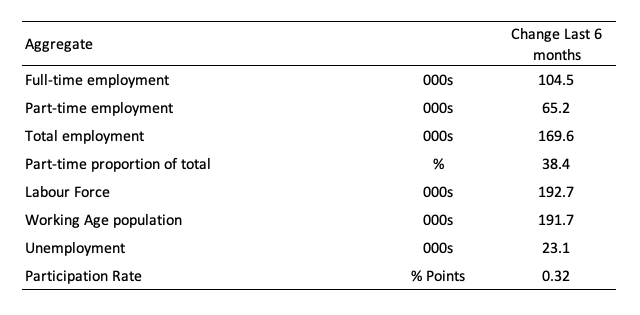
The following table provides an accounting summary of the labour market performance over the last six months. As the monthly data is highly variable, this Table provides a longer view which allows for a better assessment of the trends.
Assessment:
1. Total employment has lagged behind population growth which has resulted in the rise in unemployment.
2. Participation has been rising over the period.
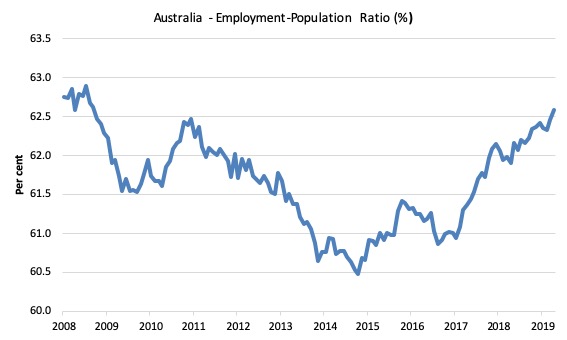
Given the variation in the labour force estimates, it is sometimes useful to examine the Employment-to-Population ratio (%) because the underlying population estimates (denominator) are less cyclical and subject to variation than the labour force estimates. This is an alternative measure of the robustness of activity to the unemployment rate, which is sensitive to those labour force swings.
The following graph shows the Employment-to-Population ratio, since February 2008 (the low-point unemployment rate of the last cycle).
It dived with the onset of the GFC, recovered under the boost provided by the fiscal stimulus packages but then went backwards again as the Federal government imposed fiscal austerity in a hare-brained attempt at achieving a fiscal surplus in 2012.
The ratio rose 0.1 points in May 2019 to 62.6 per cent and remains below pre-GFC peak in April 2008 of 62.9 per cent.
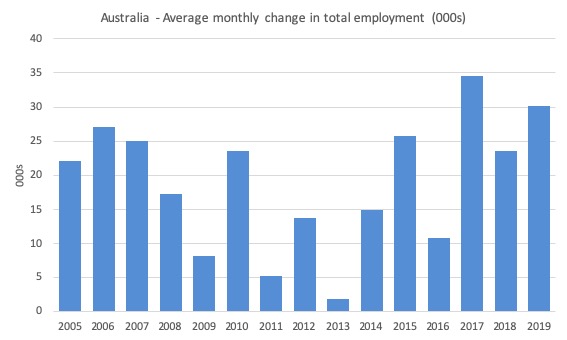
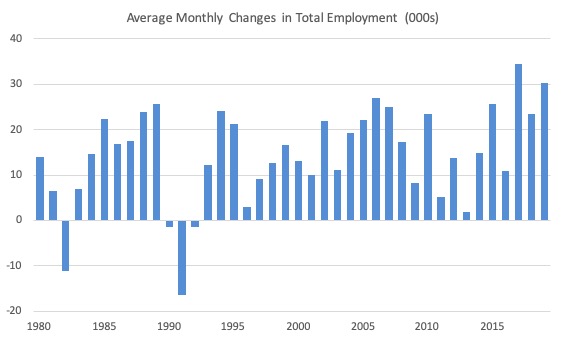
To put the current monthly performance into perspective, the following graph shows the average monthly employment change for the calendar years from 2005 to 2019 (the current year having only 4 observations in the average so far – so caution in interpretation is necessary).
It is clear that after some lean years, 2017 was a much stronger year if total employment is the indicator.
It is also clear that the labour market weakened considerably over 2018.
So far 2019, has been stronger than 2018.
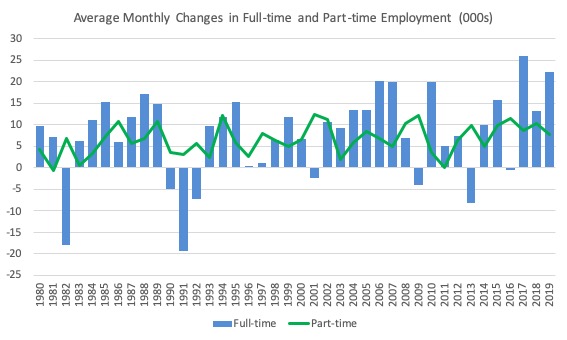
To provide a longer perspective, the following graphs shows the average monthly changes in Total employment (upper panel), and Full-time and Part-time employment (lower panel) in thousands since 1980.
The interesting result is that during recessions or slow-downs, it is full-time employment that takes the bulk of the adjustment. Even when full-time employment growth is negative, part-time employment usually continues to grow.
Unemployment decreased 2,400 to 704,700 persons
The official unemployment rate remained steady at 5.2 per cent.
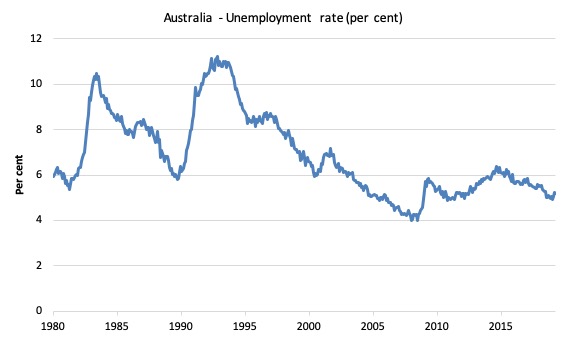
The following graph shows the national unemployment rate from January 1980 to May 2019. The longer time-series helps frame some perspective to what is happening at present.
Assessment:
1. It is still 0.3 points above the level it fell to as a result of the fiscal stimulus (which was withdrawn too early) and 1.2 point above the level reached before the GFC began.
2. There is clearly still considerable slack in the labour market that could be absorbed with fiscal stimulus.
Broad labour underutilisation remained steady at 13.7 per cent
The results based on the Monthly data for May 2019 are (seasonally adjusted):
1. Underemployment increased 0.1 points to 8.6 per cent (1,160.7 thousand).
2. The total labour underutilisation rate (unemployment plus underemployment) remained steady at 13.7 per cent.
3. There were a total of 1,865.4 thousand workers either unemployed or underemployed.
The following graph plots the seasonally-adjusted underemployment rate in Australia from January 1980 to the May 2019 (blue line) and the broad underutilisation rate over the same period (green line).
The difference between the two lines is the unemployment rate.
The three cyclical peaks correspond to the 1982, 1991 recessions and the more recent downturn.
The other difference between now and the two earlier cycles is that the recovery triggered by the fiscal stimulus in 2008-09 did not persist and as soon as the ‘fiscal surplus’ fetish kicked in in 2012, things went backwards very quickly.
The two earlier peaks were sharp but steadily declined. The last peak fell away on the back of the stimulus but turned again when the stimulus was withdrawn.
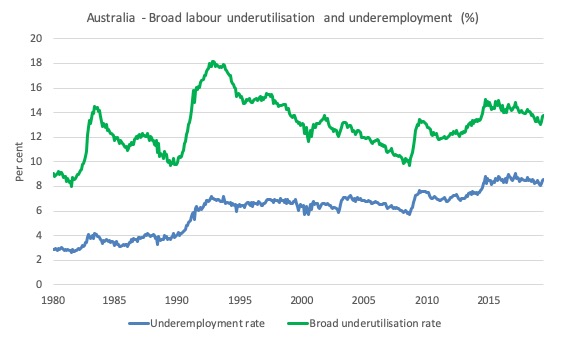
If hidden unemployment (given the depressed participation rate) is added to the broad ABS figure the best-case (conservative) scenario would see a underutilisation rate well above 15 per cent at present. Please read my blog post – Australian labour underutilisation rate is at least 13.4 per cent – for more discussion on this point.
Teenage labour market deteriorates further in May 2019
Total teenage net employment fell 2.3 thousand in May 2019.
Full-time teenage employment fell by 1 thousand and total part-time employment fell by 1.3 thousand.
The following graph shows the distribution of net employment creation in the last month by full-time/part-time status and age/gender category (15-19 year olds and the rest)
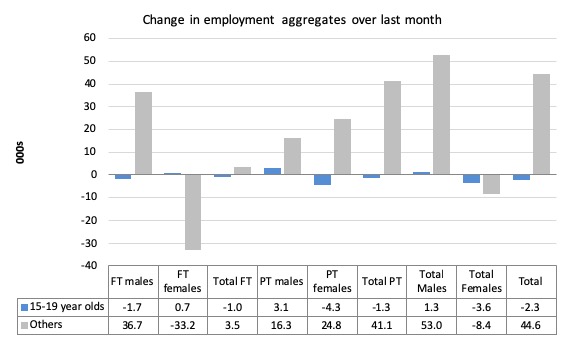
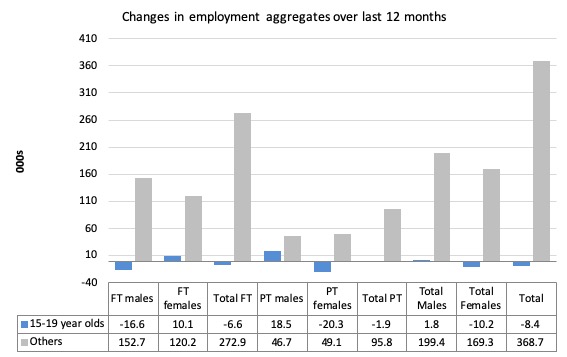
Over the last 12 months, teenagers have lost 8.4 thousand (net) jobs overall while the rest of the labour force have gained 368.7 thousand net jobs.
The following graph shows the change in aggregates over the last 12 months.
In terms of the current cycle, which began after the last low-point unemployment rate month (February 2008), the following results are relevant:
1. Since February 2008, there have been 2,220.7 thousand (net) jobs added to the Australian economy but teenagers have lost 65.3 thousand over the same period.
2. Since February 2008, teenagers have lost 106.1 thousand full-time jobs (net).
3. Even in the traditionally, concentrated teenage segment – part-time employment, teenagers have gained only 40.8 thousand jobs (net) even though 1068.9 thousand part-time jobs have been added overall.
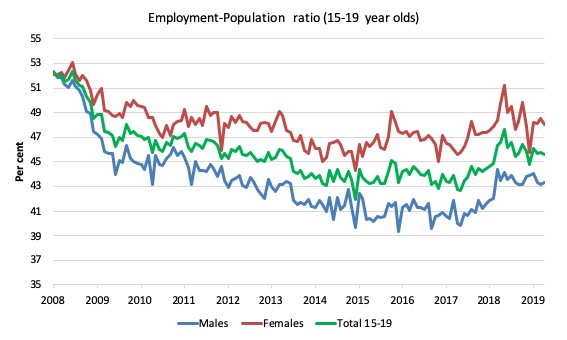
To put the teenage employment situation in a scale context (relative to their size in the population) the following graph shows the Employment-Population ratios for males, females and total 15-19 year olds since February 2008.
You can interpret this graph as depicting the loss of employment relative to the underlying population of each cohort. We would expect (at least) that this ratio should be constant if not rising somewhat (depending on school participation rates).
The absolute loss of jobs reported above has impacted more on males than females.
The male ratio has fallen by 9 percentage points since February 2008, the female ratio has fallen by 4.1 percentage points and the overall teenage employment-population ratio has fallen by 6.6 percentage points.
The other statistic relating to the teenage labour market that is worth highlighting is the decline in the participation rate since the beginning of 2008 when it peaked in February at 61.4 per cent.
In May 2019, the participation rate was 54.8 per cent (down 2 points on the previous month). This is a very unreliable statistic overall – it fluctuates widely on a monthly basis.
However, the difference between the 2008 level, amounts to an additional 89.9 thousand teenagers who have dropped out of the labour force as a result of the weak conditions since the crisis.
If we added them back into the labour force the teenage unemployment rate would be 25 per cent rather than the official estimate for May 2019 of 16.8 per cent.
Some may have decided to return to full-time education and abandoned their plans to work. But the data suggests the official unemployment rate is significantly understating the actual situation that teenagers face in the Australian labour market.
Overall, the performance of the teenage labour market leaves a lot to be desired. The decline in full-time employment for teenagers was particularly worrying.
This situation doesn’t rate much priority in the policy debate, which is surprising given that this is our future workforce in an ageing population. Future productivity growth will determine whether the ageing population enjoys a higher standard of living than now or goes backwards.
I continue to recommend that the Australian government immediately announce a major public sector job creation program aimed at employing all the unemployed 15-19 year olds, who are not in full-time education or a credible apprenticeship program.
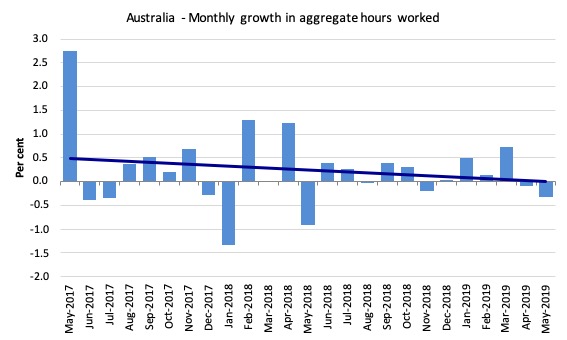
Hours worked decreased 5.9 million hours (-0.33 per cent) in May 2019
A very weak result driven by the weak growth in full-time work.
The following graph shows the monthly growth (in per cent) over the last 24 months.
The dark linear line is a simple regression trend of the monthly change – which depicts a slight downward trend – distorted somewhat by the outlier in May 2017.
Conclusion
My standard monthly warning: we always have to be careful interpreting month to month movements given the way the Labour Force Survey is constructed and implemented.
The May data reveals a slightly improved labour market although full-time employment growth was weak and total hours worked declined.
Underemployment rose slightly (0.1 points) to 8.6 per cent further accentuating the fairly weak overall situation.
The total labour underutilisation rate (unemployment plus underemployment) remained steady at 13.7 per cent and the persistence of that level of wastage makes a mockery of claims by commentators that Australia is close to full employment.
The other disturbing outcome was that full-time and total teenage employment also fell.
My overall assessment is:
1. The current situation can best be characterised as remaining in a fairly weak state.
2. Most of the dynamics over the last few months have been due to swings up and down in part-time employment.
3. The Australian labour market remains a considerable distance from full employment. There is clear room for some serious policy expansion at present
That is enough for today!
(c) Copyright 2019 William Mitchell. All Rights Reserved.
Bill, I hope you can keep your promise and delay the Quiz to publish Part 3 this week on Fri. and do the Quiz. on Sat.
I want to post all three parts to other forums all at once and not wait.
I don’t reach that many people (just a few hundred) but maybe it will include just the RIGHT *ONE*.
Dear Steve_American (at 2019/06/13 at 5:21 pm)
Part 3 will be published on Monday. I had forgotten that the Labour Force data was coming out today.
Sorry to disappoint.
best wishes
bill
In Australia today there are 1.1 million underemployed, 1.1 million marginally attached to the labour force, and 700,000 unemployed.
https://www.abs.gov.au/ausstats/abs@.nsf/mf/6226.0
These 2.9 million Australians are unwilling and unwitting conscripts in an effort to maintain stable prices.
It is good to have stable prices but it is immensely wasteful to secure price stability in this way.
It is possible and desirable to have an unemployment rate that is never above 2 percent and underemployment and marginal attachment rates that hover around zero.
The way to do it is to set up a Job Guarantee whereby the federal government makes an unconditional offer of living wage employment to everyone who wants employment.
The employers in the program would be local governments, state governments, NGOs, not-for-profit social enterprises, cooperatives… anyone except for-profit firms (it is important that it doesn’t degenerate into a wage subsidy scheme).
It is a good idea to be very creative and imaginative when we think of what counts as a valid job.
Caring for children, elderly relatives, and relatives with disabilities could be a paid Job Guarantee job if a person wanted.
The JG could validate and affirm caring work that is currently hidden and underappreciated.
Participating in education and training could be a paid Job Guarantee job if a person wanted.
Planning, launching and consolidating a small enterprise could be a paid Job Guarantee job if a person wanted.
There would be a panoply of Job Guarantee jobs related to social and community services, environmental services, artistic and cultural services, and small-scale public works.
The employer and the jobseeker would design a role around the jobseeker’s interests, preferences, and abilities.
For the vast majority of people, a Job Guarantee job would be a transition job – a stepping stone to a higher paid job in the private sector or in the regular public sector.
But there would be no obligation to move on. If a person wanted to do a Job Guarantee job on a long term basis and they were fulfilling their obligations satisfactorily there would be nothing stopping them from doing the job indefinitely.
A Job Guarantee would make it easy for people to create a role that is rich in meaning and purpose, that serves an obvious public good, that has positive social interactions, and that has relevant and rewarding opportunities for learning and development.
Macroeconomically the Job Guarantee would have one purpose: to be an automatic stabiliser that ensures that the federal government is automatically doing precisely the correct amount of spending in precisely the right places at precisely the right time to achieve full employment with stable prices.
When the private sector is recovering, federal government spending would automatically fall as people leave the Job Guarantee for higher paid jobs elsewhere.
When the private sector experienced a downturn, federal government spending would automatically increase as people lose their private sector jobs and enter the Job Guarantee.
“Most of the dynamics over the last few months have been due to swings up and down in part-time employment.” Here is displayed the beautiful, sharp teeth of the JG. With one bite, it would put an end to part-time employment, temps, gig jobs, on-call employment, and other such exploitative arrangements (when not desired by the workers themselves). Here’s a perceptive little article about how this exploitation has filtered down not only in our economies but, finally, into us (at least in the States):
https://eand.co/how-capitalism-taught-americans-to-love-exploitation-5db12d3a6e93
I fear the already weak Australian labour market may soon take a turn for the worse – the government have just announced the federal budget is close to balance.