Yesterday (April 24, 2024), the Australian Bureau of Statistics (ABS) released the latest - Consumer…
Inverted yield curves signalling a total failure of the dominant mainstream macroeconomics
At different times, the manias spread through the world’s financial and economic commentariat. We have had regular predictions that Japan was about to collapse, with a mix of hyperinflation, government insolvency, Bank of Japan negative capital and more. During the GFC, the mainstream economists were out in force predicting accelerating inflation (because of QE and rising fiscal deficits), rising bond yields and government insolvency issues (because of rising deficits and debt ratios) and more. And policy makers have often acted on these manias and reneged on taking responsible fiscal decisions – for example, they have terminated stimulus initiatives too early because the financial markets screamed blue murder (after they had been adequately bailed out that is). In the last week, we have had the ‘inverted yield curve’ mania spreading and predictions of impending recession. This has allowed all sorts of special interest groups (the anti-Brexit crowd, the anti-fiscal policy crowd, the gold bug crowd, anti-trade sanctions crowd) to jump up and down with various versions of ‘I told you so’. The problem is that the ‘inverted yield curve’ is not signalling a future recession but a total failure of the dominant mainstream macroeconomics. The policy world has shifted, slowly but surely, away from a dependence on monetary policy towards a new era of fiscal dominance. We are on the cusp of that shift and bond yields are reflecting, in part, the sentiment that is driving that shift.
Yield curve inversion hysteria
In recent days there has been a lot of talk about the inverted US yield curve. This means that the yields on short-term bonds are above the longer-term yields.
I will explain what that might mean later.
Typically, in the US context, the difference (spread) between the US 10-year Treasury bond yield and the 2-year yield is used as a signal of the shape of the yield curve (normal, inverted or – see later).
The 2-year US Treasury bond yield is seen as the proxy for interest rate expectations.
The behaviour in recent months is that the 2-year yield has not risen much at all, whereas the 10-year yield has fallen quite a way.
The following graph shows the difference (spread) between the US 10-year Treasury bond yield and the 2-year yield from January 1990 to August 16, 2019.
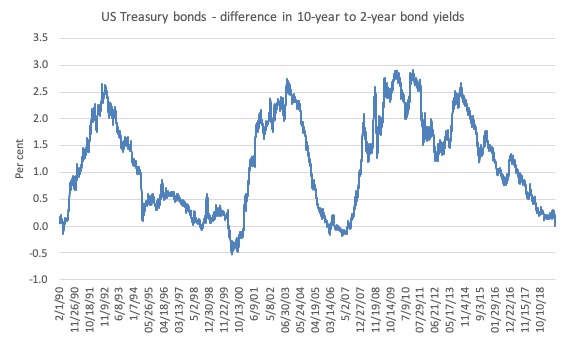
On August 14, the spread went to 0.01 per cent (almost zero) and led to the ‘inversion’ hysteria.
I also made a short animation of the US Treasury yield curve from August 1 to August 16, 2019.
Each day takes a few seconds to elapse so you have to watch the graph patiently to track through the days.

How do we interpret these movements?
Essential concepts
The conventional view propagated by mainstream economists and those with vested interests is that bond markets call the shots and that governments, desperate to fund their spending, have to be mindful that the markets might turn on them if they are extravagant.
Extravagance to many begins when the government goes into deficit.
In Modern Monetary Theory (MMT), we would not use a term such as extravagance. But it would be irresponsible for a government to continue to increases its net spending when the economy had already reached full employment.
The only reasonable prediction in that situation would be rising inflation.
We should also be clear that bond markets for currency-issuing governments are unnecessary and are better seen as examples of corporate welfare.
I discussed that notion in this early blog post – Who is in charge? (February 8, 2010).
A currency-issuing government could stop issuing debt at any time it wanted and the bond markets would have to create their own benchmark, low-risk asset to replace the risk-free government assets.
The current yield behaviour is arising because the US government bond market is booming.
Many readers regularly write asking me to help them understand these markets. The current ‘inversion’ mania presents me with a chance to explain how bond markets work.
Ignoring specific nuances of a particular country, governments match their deficits by issuing public debt. It is a totally voluntary act for a sovereign government.
The debt-issuance is a monetary operation and is entirely unnecessary from an intrinsic perspective.
Governments (more or less) use auction systems to issue the debt. The auction model merely supplies the required volume of government bonds at the price that emerges in the bidding process Typically the value of the bids exceeds by multiples the value of the overall amount the government is seeking.
A primary market is the institutional machinery via which the government sells the bonds. There are, typically, selected financial institutions that participate in the primary issue and ‘make’ the market.
A secondary market is where existing financial assets are traded by interested parties. So the financial assets enter the monetary system via the primary market and are then available for trading in the secondary.
Secondary market trading has no impact at all on the volume of financial assets in the system – it just shuffles the wealth between wealth-holders.
The way the auction works is simple. The government determines when a tender will open and the type of debt instrument to be issued. They thus determine the maturity (how long the bond would exist for), the coupon rate (the interest return on the bond) and the volume (how many bonds).
The issue is then put out for tender and demand relative to the fixed supply in the market determines the final price of the bonds issued. Imagine a $1000 bond had a coupon of 5 per cent, meaning that you would get $50 dollar per annum until the bond matured at which time you would get $1000 back.
Imagine that the market wanted a yield of 6 per cent to accommodate risk expectations. So for them the bond is unattractive and so they would put in a purchase bid lower than the $1000 to ensure they get the 6 per cent return they sought.
The general rule for fixed-income bonds is that when the prices rise, the yield falls and vice versa.
Thus, the price of a bond can change in the market place according to interest rate fluctuations.
When interest rates rise, the price of previously issued bonds fall because they are less attractive in comparison to the newly issued bonds, which are offering a higher coupon rates (reflecting current interest rates).
When interest rates fall, the price of older bonds increase, becoming more attractive as newly issued bonds offer a lower coupon rate than the older higher coupon rated bonds.
So for new bond issues the government receives the tenders from the bond market traders which are ranked in terms of price (and implied yields desired) and a quantity requested in $ millions.
The government then issues the bonds in highest price bid order until it raises the revenue it seeks. So the first bidder with the highest price (lowest yield) gets what they want (as long as it doesn’t exhaust the whole tender, which is not likely). Then the second bidder (higher yield) and so on.
In this way, if demand for the tender is low, the final yields will be higher and vice versa. There are a lot of myths peddled in the financial press about this. Rising yields may indicate a rising sense of risk (mostly from future inflation although sovereign credit ratings will influence this).
But rising yields on government bonds do not necessarily indicate that the bond markets are sick of government debt levels.
In sovereign nations (not the EMU) it typically either means that the economy is growing strongly and investors are willing to diversify their portfolios into riskier assets. It is also usually a time that the central bank pushes up rates and bond yields more or less follow.
There are two ways we can use yield data on bonds available from the government. First, to see what is happening to the demand for bonds from investors. Rising yields signal falling demand which then has to be interpreted according to the state of the economy as noted above. Second, to see what is happening to inflationary expectations and risk-assessments.
The yield curve is a way of looking at the bond markets.
he yield curve is a graphical depiction of the term-structure of risk-free interest rates and plots the maturity of the government bond on the horizontal axis against the respective yields (return) on the vertical axis.
The US Treasury Department issues bonds which have maturities from 1 month out to 30 years and various gaps in between.
What determines the slope of the yield curve?
There are broadly three shapes that the curve will take:
- Normal – Under normal circumstances, short-term bond rates are lower than long-term rates. The central bank attempts to keep short rates down to keep levels of activity as high as possible and bond investors desire premiums to protect them against inflation in longer-term maturities. Combined, the yield curve is upward sloping.
- Inverted – Sometimes, short-term rates are higher than long-term rates and we say the yield curve is inverted. The usual events which lead to an inverted yield curve are that the economy starts to overheat and expectations of rising inflation lead to higher bond yields being demanded. The central bank responds to building inflationary pressures by raising short-term interest rates sharply. Although bond yields rise, the significant tightening of monetary policy causes short-term interest rates to rise faster, resulting in an inversion of the yield curve. The higher interest rates may then lead to slower economic growth.
- Flat – A flat yield curve is seen most frequently in the transition from positive to inverted, or vice versa. As the yield curve flattens the yield spreads drop considerably. A yield spread is the difference between, say, the yield on a one year and a 10-year bond. What does this signal about the future performance of the economy? A flat yield curve can reflect a tightening monetary policy (short-term rates rise). Alternatively, it might depict a monetary easing after a recession (easing short-term rates) so the inverted yield curve will flatten out.
There are various theories about the yield curve and its dynamics. All share some common notions – in particular that the higher is expected inflation the steeper the yield curve will be other things equal.
The basic principle linking the shape of the yield curve to the economy’s prospects is explained as follows. The short end of the yield curve reflects the interest rate set by the central bank.
The steepness of the yield curve then depends on the yield of the longer-term bonds, which are set by the auction process.
But the short end of the curve is the primary determinant of its slope. In other words, the curve steepens mainly because the central bank is lowering the official cash rate, and it flattens mainly because the central bank is raising the official cash rate.
Bond traders link the dynamics of the yield curve to their expectations of the future economic prospects. When the yield curve flattens it is usually accompanied by deflation or steady and low inflation and vice versa.
One of the risks in holding a fixed coupon bond with a fixed redemption value is purchasing power risk.
Economists believe that most people would prefer to consume now rather than later if there was to be a trade-off. To encourage foregone consumption now, a yield on savings must be provided by markets.
The yield is intended to allow a person to consume more in the future than has been sacrificed now. But if the prices of real goods and services increases in the meantime, then even with the yield, the individual’s command over real things is less than it would be if prices were stable. It is possible, that the inflation could wipe out the yield.
Purchasing power risk is more threatening the longer is the maturity. So it is one reason why longer maturity rates will be higher. The market yield is equal to the real rate of return required plus compensation for the expected rate of inflation.
If the inflation rate is expected to rise, then market rates will rise to compensate. In this case, we would expect the yield curve to steepen, given that this effect will impact more significantly on longer maturity bonds than at the short end of the yield curve.
The current situation
So what are the movements in the US Treasury bond yield curve telling us about the outlook?
The knee-jerk response to the flattening and ‘inversion’ last week was that there recession coming and investors are seeking refuge from risk by pushing down longer term yields as they bought up in those segments of the maturity range in the expectation of capital gains.
Share markets dropped as investors shifted funds into bonds.
The current issues that might be driving these trends are:
1. Germany is in all likelihood in recession as its export-led growth strategy and fiscal surplus obsession grinds its economy into the ground in the wake of tepid European growth and declining growth rates in China, the UK and the US – all major trading partners.
2. Continuing austerity in Britain is killing growth.
Many think that the negative GDP number recorded by the ONS recently is due to the Brexit. Perhaps there is some negative impact – not because of the decision to leave but the lengthy and fraught process the UK government is undertaking to make the decision operational.
But austerity is the major reason for slow economic growth in the UK.
3. Japan is about to hike sales taxes because it thinks it must reduce its fiscal deficit.
That will almost certainly drive Japan into recession if the Government actually goes through with its tax hike timetable.
4. The US and China are going head-to-head on a tariff war.
5. The general bias towards austerity around the world has led to stagnant growth, massive and unsustainable levels of private debt, and finally, negative yields on government debt – from short to long maturities.
6. Economies are fighting low inflation rather than high inflation despite the massive liquidity injections by central banks via bond-buying programs.
Just yesterday (August 19, 2019), Eurostat latest inflation report – Annual inflation down to 1.0% in the euro area – showed that far from moving towards the ECB’s stated ‘price stability’ target of 2 per cent, inflation is falling in the Eurozone.
The ECB has categorically failed to meet its target over an extended period. Portugal is now deflating (-0.7 per cent) and Member States such as Italy (0.3), Greece (0.4), Ireland (0.5) and Spain (0.6) are heading in that direction.
7. Central bankers are increasingly calling out for fiscal interventions from governments – telling them that monetary policy has more or less run its course.
If you put all this together it tells us that the mainstream macroeconomic consensus that has dominated the neoliberal period after the rise of Monetarism is all but dead.
We are now in an austerity-driven, low growth, low yield, low inflation environment where financial markets are struggling to cope.
All the macroeconomic aggregates are going counter to the direction that mainstream macroeconomics has predicted.
High deficits did not drive up interest rates.
Nor bond yields.
QE did not drive up inflation.
Austerity, in turn, did not stimulate private spending growth – exactly the opposite.
When in doubt, the investors – struggling to find yield in an increasingly risky environment – flood into US Treasury bonds.
The problem is that in using the movements in the yield curve as a predictor of recession we have to make assumptions about central bank behaviour which in the recent decade or so have not been justified.
Central banks have been acting outside of the limits usually suggested by mainstream macroeconomists. This has led to outcomes that have confounded the mainstream theories (for example, no inflation surge from QE).
In the US, the recent cries of inversion belie the fact that that the yield curve has been inverting for a long time now.
On May 25, 2019, the short-end of the US Treasury yield curve inverted – in the sense that the yield for 1 month bonds was 2.35 per cent, 2 month 2.36 per cent, while the 10-year bond yield fell to 2.26 per cent and continued falling.
Further, the 30-year bond yield fell below 2 per cent (1.98) on August 16, 2019. It has never been that low. A month ago (July 11, 2019), the yields were are 2.65 per cent
What does that imply?
It means that if yields rose back to their more normal (recent) levels, then anyone who purchased those bonds in recent days will be making large capital losses.
It also means that the investors are not expecting any likelihood of accelerating inflation or significant interest rate increases into the distant future which would suggest interest rates and yields would be rising.
And the response of the US Federal Reserve was to drop interest rates even though employment growth remains relatively strong.
The US central bank is clearly thinking that the danger to the real economy is not from what happens in bond markets, but, rather, the signal received each time the BLS publish the low inflation figures.
Also, investors are learning that they have been mislead by mainstream economists.
Inflationary-expectations are low and, generally falling around the world.
Moreover, bond markets are learning that with most governments locked into fiscal austerity obsessions, macroeconomic policy becomes the responsibility of central banks.
In the Eurozone, where that austerity bias is at elevated levels, the investors are clearly punting on the ECB unleashing a further round of QE which will push interest rates down (more negative) and bond prices up.
So the government bonds become attractive if the central bank is driving capital gains for purchasers despite low to negative yields.
Conclusion
In the past, a flattening or inverting US Treasury yield curve (depending on how you measure it) has been a fairly reliable predictor of recession some 6 or so months down the track.
But, in the current period that reliability will not be sustained.
The risks of recession are more obvious and have been staring us in the face for years now.
The obsession with fiscal austerity and the dependence on the relatively ineffective monetary policy for counter-stabilisation is driving the low-growth , low yield, low inflation environment.
The movements in the US bond markets are just reflective of the relative attractiveness of US Treasury bonds in this environment, where yields in Germany, for example, are now negative.
I cannot see a recession coming from the China-US stand-off or Brexit for that matter.
It is clear that the US President is not a fiscal hawk and will spend freely if a recession was to threaten. And I predict Boris Johnson will not constrain himself by the austerity nonsense that his party has inflicted on the British people since May 2010.
That is enough for today!
(c) Copyright 2019 William Mitchell. All Rights Reserved.
Thank you Bill. I have been responding to a number of articles by Michael Roberts for what I perceive to be incorrect statements/criticisms of MMT. I am a rank amateur and hope I did not do MMT injustice. However, aside from his digs at MMT, one consistent theme of Roberts is that economic upturns/downturns must be attributed to rising/falling levels of business profitability (I am assuming he is refering to real productive business and not financial operators). So, he also criticises the bond yield inversion mania (and the unlikely success of fiscal pump priming), and instead predicts a recession based on his analysis of falling business profitability. Your comments on this, and the general tenor of Michael Robert’s views would be interesting.
‘It is clear that the US President is not a fiscal hawk and will spend freely if a recession was to threaten. ” The problem with Trump is that he will just have another tax cut for the rich. That won’t work any better than his last one. We will just suffer the way we are going to because of his BS about raising tariffs on China.
Many thanks for these fascinating pieces of analysis.
I hope you will also tackle Argentina and Brazil (Brazil is interesting from MMT perspective because they have large fiscal spending but still enormous problems, would like to know why).
Just one question: in the end you simultaneously posit that the inverted and negative yields are due to markets realizing inflation is not coming back and austerity is destroying the economies but also that this situation is not, as per the past, predictive of a coming recession (even though you admit one is overdue). Isn’t this contradictory?
for Wilfrid:
I noticed this comment from Michael Roberts (who describes himself as a Marxist):
“Workers need to get wages to spend first. So they need to be employed by capitalists first”.
Obviously he has discounted a role for the public sector, specifically the JG of MMT as a countercyclical mechanism.
And I gather from his comments (re funding government) he supposes ‘wealth’ is only created in the private sector, hence he regards government spending as unproductive.
I like to point to the significance of public education – which can be regarded as a *renewable resource* (after the physical infrastructure is built) as an example of value creation by the public sector.
Wilfrid. I don’t know of Michael Roberts, but based on Neil’s observation that Mike lays claim to being a Marxist, I posit that Mike is an ass, or a neoliberal spreading lies and confusion. After all, a socialist believes that the greatest strengths of the community, comes from the community, acting together, and not the actions of the individual, acting for his individual gain. Maybe the correct word is arse.
Dekin. Normally an inverted yield is caused by the Central Bank raising rates to slow down rising inflation and growth. The situation we are in now, is because long term rates are falling to below the rates set by the Central Bank. The perceived prospects for long term economic growth are falling, falling to below the perceived prospects of short term economic growth. There is a throttling, a strangulation of long term growth because of austerity. Instead of a bubble being popped, there is a wringing out. A wringing out of demand. So we may see a world gradually slowing, then stopping growth. Then maybe decline. For me it means the wealthy and the powerful are siphoning all elements of value to themselves.
The SPD in Germany is now showing really impressive control of narrative qualities. They are claiming that given their exemplary discipline in the previous years, the public shouldn’t worry because of the “fiscal room” they made available in the process. Sometimes I think we deserve our big coalition of dunces and plutocrats. This is literally like depraving someone of food out of concern for future hunger and telling him not to despair because the fridge is full.
@Wilfrid
I kinda have to agree with Yok, here. Particularly if Roberts doesn’t offer any insight into what led to the falling levels of profitability.
For example, Michael Hudson has some interesting analysis about how the rising cost of doing business, be it because of despotic rule or partial or full enslavement of the population via private debt has led every empire to it’s downfall. The simplest example being the right to use a bridge. If a despotic government decides who gets to use it and who doesn’t or if they or a private entity that has gotten into a highly leveraged positon (monopolistic at worst), the cost of getting to the other side will lead to either reduced transit or the indebtment of those that cross that bridge. I’d say in recent history we’ve seen a combination of these simple effects in state-sponsored oligopolies. Particularly in the privatization processes of former publicly owned industries and infrastructure.
Other authors refer to “extractive economies” were profit/goods/services are taken out of the economic cycle, but little or no re-investment or redistribution downwards ever takes place.
Then again, I think Yok’ gift is brevity:
“For me it means the wealthy and the powerful are siphoning all elements of value to themselves.”
Cheers
“[…] positon (monopolistic at worst), GET TO DETERMINE THE PRICE FOR CROSSING, the cost will […]”
I desperately need to hire an editor.
@Dekin:
Argentina got themselves a new neoliberal President in Macri that signed the on the dotted line the IMF put in front of him. As a consecuence, the cycle of foreign indebtment and cronic default was again set in motion. At the same time the capital flight by the elites and the privatization wave hit the regular Argentinians hard.
I will make an exception and link to Prof. Hudson’s analysis of the latest round of credits that included the (at the time) biggest in IMF history:
https://michael-hudson.com/2018/07/argentina-loans-upon-loans/
Cheers!
“We are now in an austerity-driven, low growth, low yield, low inflation environment”. Could not that austerity and environment be driven by limits to growth. In particular oil reached a peak in 2005. The new oil coming from the USA is not viable both financially and environmentally. The financial system is propping up oil production in the USA to keep itself going. Hence austerity and low growth.
I’m afraid I don’t share Bill’s optimism.
Europe is stuck down an austerity hole, China’s is engaged in the low level trade war with the US that will escalate if they send the tans into Hong Kong.
The world is full of neoliberal governments like Australia’s that promise surpluses at a time the economy is weak.
Global recession seems inevitable to me.
Argh
“If they send the tanks into Hong Kong”
The ‘view’ of a ‘monetarist’.
“Given that the Fed and the ECB have shown a welcome pragmatism in responding to the current global slowdown, and given also that – despite our concerns – money growth trends remain more or less satisfactory, a central forecast for 2020 can sensibly be for roughly trend growth of the world economy accompanied by low inflation. As ever, many worries surround a benign view of this sort, but recent financial events in China and India – like those in the developed world – also support it. “
Of interest?
“The IMF Confirms That ‘Trickle-Down’ Economics Is, Indeed, a Joke” https://psmag.com/economics/trickle-down-economics-is-indeed-a-joke?fbclid=IwAR2jDcNQR8jUPp_1ce3Ao9L7_rxA2d9tz72qnoDCu1R5sn9pWp_f_h3obUk
Let me add some practical observations from my 40 years in international finance that may (or may not) be incorporated into MMT:
1) financial assets (including bank loans) tend to be more debt than equity financed at the margin.
2) debt used to finance financial assets no matter what their legal maturity tend to be short term (often overnight)
3) real asset finance tends to be medium to longer term (equipment medium term of 3 to 5 years and plant/real estate tends to 10+ years)
So flattening of the curve first hits investors in financial assets, who are heavily financing these assets short term. Think of typical overnight repo of long term government bond.
This causes a sell off in financial assets or less liquidity in asset financing markets.
This can work it’s way through the economy from wealth effects on consumption. Or can lead to bad loans secured with financial assets on banks balance sheet with subsequent pull back in lending ( see below).
Or an inverted yield curve can lead to a reluctance of banks to make loans. This works its way through the now well discussed “credit impulse” into the real economy.
Wether through wealth effects or through bank lending/credit impulse, inverted yield curve is not good for economic growth.
I would love to see these life long practical observations incorporated into MMT dialogue.