Today (April 18, 2024), the Australian Bureau of Statistics released the latest - Labour Force,…
Long-term unemployment – stats and myths
Today I have been looking at long-term unemployment as part of a larger project. It is on the rise again and always lags behind the overall unemployment movements given it takes time for people to work their way through the duration categories until they get to 52 weeks. The longer the recession the higher average duration of unemployment becomes and the larger the pool of long-term unemployed. However, the way we feel about long-term unemployment is conditioned heavily by how it is defined. Moreover, we also have built up an elaborate set of myths about the way long-term unemployment behaves and consider it needs to be dealt with via training rather than job creation – the so-called irreversibility hypothesis. This blog looks at these issues.
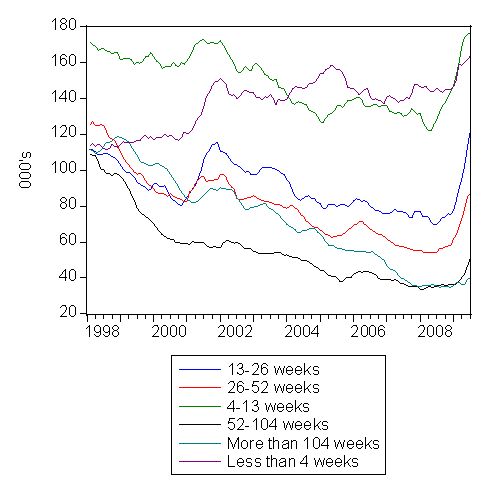
First, what is the pattern of unemployment duration? The next graph provides some information – it shows the evolution of the workers (000s of persons unemployed) across the duration of unemployment categories (in weeks) since February 1998. The time-series are 6-month trailing moving averages of seasonally adjusted ABS data to allow you see trends a bit better. This data is only available since September 1997.
The graph provides interesting information about how the pool of unemployment builds as the cycle turns down. After a long period of growth, long-term unemployment (currently defined as more than 52 weeks of continuous joblessness) is relatively low and workers enter and exit the unemployment pool regularly as jobs are created and destroyed.
Once the downturn started (February 2008), the short-duration categories obviously take the initial unemployment. So the 4-13 weeks; 13-26 weeks; 26-52 weeks categories all rise sharply in a lagged pattern with the shorter-duration categories lead. As the recession persists, you start to see the longer-duration categories rising sharply (the dynamics are suppressed somewhat by the moving-average construction of the time series).
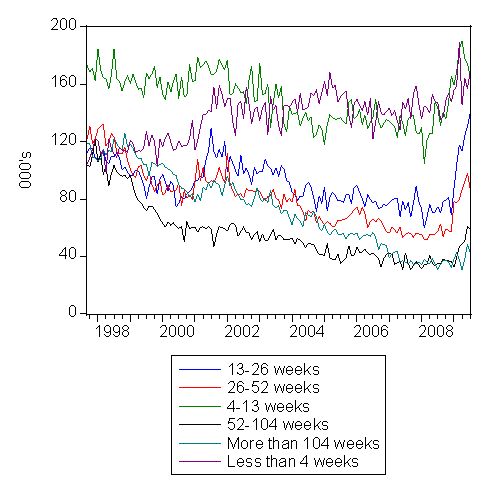
This is what the seasonally-adjusted data looks like without the moving-averages. You see the pass-through of the duration categories quite clearly with the lagged pattern now impacting (some 17 months into the downturn) on the longer-duration categories. The rapid deterioration began in December 2008 and has gathered pace since then.
Definitions
The first issue to clear up is the definition of long-term unemployment. Long-term unemployment tracks the total unemployment rate in a lagged fashion. So as governments abandoned full employment in the in the 1970s and allowed unemployment to rise significantly, they also had to then contend with the politically troubling issue of long-term unemployment.
The solution they took was the most deplorable of the options available – they redefined long-term unemployment. So in the early 1970s, a person was long-term unemployed if they has been unemployed for 13 or more weeks. This was changed in the late 1970s to 26 weeks and from the mid-1980s to 52 weeks. There has been pressure in recent years to change it to 104 weeks and confine it to a small number of so-called intransigents (more about which later).
To put it in perspective, in November 1967 only 13 per cent of the unemployed were considered long-term (using the definition of the day) and, of-course, unemployment itself was very low.
So were there valid reasons for this change over time? None at all. Purely ideological – to disabuse us of the severity of the problem that the failed government policy had created.
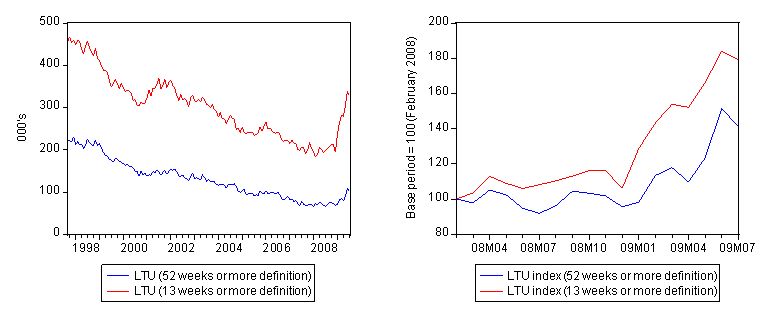
To see what you might think of difference definitions, the following graph compares the current definition of long-term unemployment (52 weeks or over) with the original definition (more than 13 weeks). The graphs are in index number form with the base period being defined in the following. The left-hand panel shows the data from September 1997 while the right-hand panel charts the time series since the start of the current downturn (February 2008). You get a very different view of the severity of the current downturn if you consider long-term unemployment to be more than 13 weeks continuous joblessness.
Just in the current downturn, long-term unemployment has risen by 41 per cent whereas using the old definition the percentage change since February 2008 would be almost twice that figure (79 per cent) on the base period.
In terms of levels, the ABS estimate there were 101 thousand long-term unemployed persons out of a total unemployment pool of 660 odd thousand workers in July 2009. If we took the old definition of 13 weeks or more the number of long-term unemployed would rise to 329 thousand. Again a reflection that some 230 thousand workers have been unemployed for more than 3 months but less than 1 year already.
Using the full sample for the data (September 1997 to July 2009) that breaks the unemployment down into the weekly duration categories, the following graph shows the evolution of the long-term unemployment using the current definition (blue line) against the old definition (red line). As a result of the long growth period long-term unemployment was falling
Does long-term unemployment have strong irreversibility properties?
As unemployment started rising in the 1970s and has persisted at high levels ever since, orthodox economists concentrated on the supply side of the labour market, hypothesising that full employment should be redefined to occur at much higher unemployment rates than in the past. Remember my definition of full employment is less than 2 per cent official unemployment, zero hidden unemployment and zero underemployment.
However, Michael Piore (1979: 10) reminder is worth remembering always:
Presumably, there is an irreducible residual level of unemployment composed of people who don’t want to work, who are moving between jobs, or who are unqualified. If there is in fact some such residual level of unemployment, it is not one we have encountered in the United States. Never in the post war period has the government been unsuccessful when it has made a sustained effort to reduce unemployment. (emphasis in original)
(Reference: Piore, Michael J. (ed.) (1979) Unemployment and Inflation, Institutionalist and Structuralist Views, M.E. Sharpe, Inc.: White Plains.)
The orthodox approach, however, has been to consider long-term unemployment to be a (linear) constraint on a person’s chances of getting a job. The so-called negative duration effects are meant to play out through loss of search effectiveness or demand side stigmatisation of the long-term unemployed. That is, they become lazy and stop trying to find work and employers know that and decline to hire them. Over this period, skill atrophy is also claimed to occur.
So it has been common for mainstream economists and policy makers to postulate that there is a formal link between unemployment persistence, on one hand and so-called “negative dependence duration” and long-term unemployment, on the other hand. Although negative dependence duration (which suggests that the long-term unemployed exhibit a lower re-employment probability than short-term jobless) is frequently asserted as an explanation for persistently high levels of unemployment, no formal link that is credible has ever been established.
However, despite the lack of evidence, the entire logic of the 1994 OECD Jobs Study which marked the beginning of the so-called supply-side agenda defined by active labour market programs was based on this idea.
This agenda has seen the privatisation of the Commonwealth Employment Service, the obsession with training programs divorced from a paid-work context and the raft of pernicious welfare-to-work regulations. All have largely failed to achieve their aims.
Once you examine the dynamics of the data you quickly realise that short-term unemployment rates do not behave differently to long-term unemployment rates. The irreversibility hypothesis is unfounded.
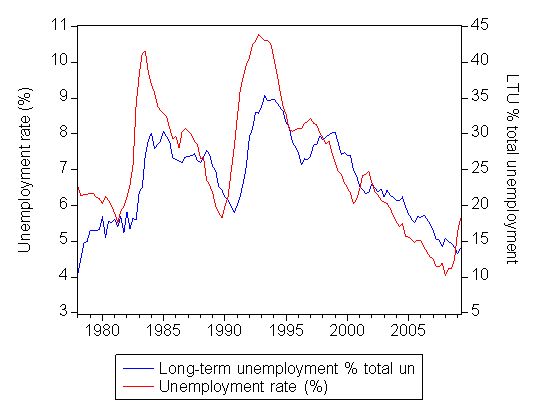
The relationship between long-term unemployment and the unemployment rate is very close as can be seen in the following graph. As unemployment rises (falls), the proportion of long-term unemployment in total unemployment rises (falls) with a lag. Several studies have formally examined this relationship. My earlier work has found that a rising proportion of long-term unemployed is not a separate problem from that of the general rise in unemployment. This casts doubt on the supply-side policy emphasis that OECD governments have adopted over the last two decades. So while the mainstream economics profession may claim search effectiveness declines and this contributes to rising unemployment rates, the overwhelming evidence is that both are caused by insufficient demand. The policy response then is entirely different.
To argue that long-term unemployment is a constraint on growth and therefore needs supply-side programs rather than direct job creation, you would have to find that even during growth periods, long-term unemployment was resistant to decline.
How have the LTUR and STUR behaved over the business cycle? Is there evidence that the LTUR is resistant to growth as is claimed by the irreversibility hypothesis?
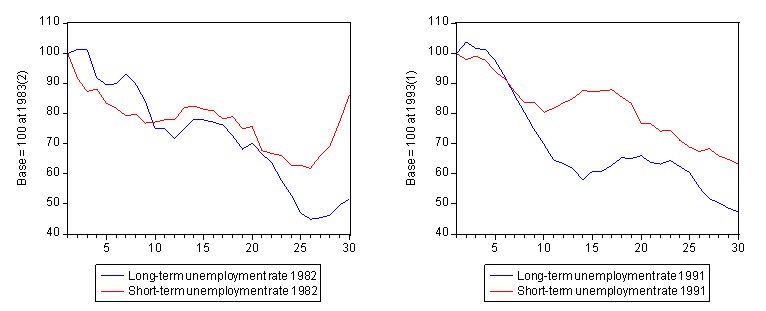
The following graph shows the decline in the LTUR and the STUR from the unemployment rate peaks coinciding with the 1982 and 1991 recessions, respectively. The peaks were in 2nd quarter 1983 and the 1st quarter 1993. The observations are indexed with the peak observations being 100. The behaviour is charted for 30 quarters following the peak.
The peaks for the short-term unemployment rate precede that of the long-term unemployment, which in turn, lag the related troughs in GDP. The important finding is that the growth phase provides job opportunities for both pools of unemployment. There does not appear to be any sequential accessing of the short-term first, followed by the long-term unemployed, as the irreversibility hypothesis would suggest.
Indeed, following the 1991 recession, the long-term unemployment rate fell much more sharply than the short-term rate. I also have examined the possibility that this could have been due to labour force exit and largely rejects that proposition as an explanation.
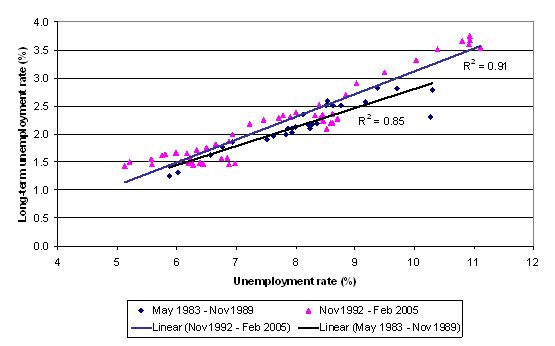
The next graph compares the relationship between the official unemployment and the long-term unemployment rate for two recovery cycles coinciding with the peak of the official unemployment rate in May 1983 and November 1992 until the respective troughs were reached at the end of the cycle (November 1989 and February 2005, respectively).
The lines (and R2) are simple linear regressions for each of the two sets of (differently notated) pair-wise observations. Don’t take the regressions too seriously but they do support the general point being made here.
The graph confirms that the LTUR moves closely with the official rate as the business cycle improves. There does not appear to be any strong indication of hysteresis operating. Hysteresis, in this context,is the notion that the LTUR is resistant to the aggregate growth cycle, perhaps because skill atrophy requires retraining before the person is able to work.
The two recoveries are also strikingly similar so that the any notion that structural changes (or policy regimes) within the economy have increased hysteresis or that the period of Active Labour Market Programs in the 1990s have decreased it cannot be substantiated by this data.
Conclusion
The evidence very strongly supports the view that long-term unemployment rises and falls with net job creation. The stronger is employment growth the lower long-term unemployment is and vice-versa.
What is the direction of long-term unemployment at present? It is already increasing and will rise as a proportion of total unemployment as the downturn persists. Even when GDP growth returns long-term unemployment will continue rising.
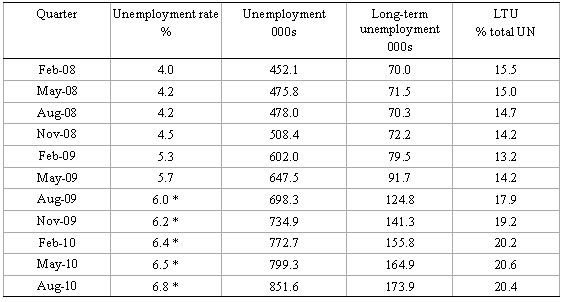
I ran a regression or two today and built a forecasting model (the structure of which has provided good forecasts for me in the past). The following table captures my conservative estimates. The * beside the unemployment rate for the 3rd and 4th quarters of 2009 and the first three quarters of 2010 are just assumed unemployment rates (very conservative). The model then provides forecasts of long-term unemployment.
So even using the current definition which I think is a disgrace and hypothesising fairly modest rises in the unemployment rate, long-term unemployment will rise from 70 odd thousand (15.5 per cent of total unemployment) at the start of the downturn to 173.9 thousand (20.4 per cent of total sometime later next year).
That is a huge waste of people and their potential.
Further, given that the irreversibility hypothesis fails to capture the labour market dynamics adequately, then I conclude that the training strategy adopted by the current government to deal with unemployment (particularly the long-term unemployed) is a waste of resources and a cruel joke.
Dear Bill,
Excellent post. Providing the facts in an easy to read form is what you do best. Unfortunately, those imbeciles in Canberra will continue to honour whatever contracts they currently have with employment agencies, regardless of the consequences.
Cheers, Alan.
Hello Bill,
I discovered the CofFEE website recently and was amazed. Your ideas paralleled my own but on a vastly higher intellectual level. Surely there must be some politicians with even a modicum of intelligence who can see the massive monetary and human costs of unemployment and underemployment.
You have analysed the problem and provided the solution. When will they see the light?
The work you are doing is heartening.
Ian