Today (April 18, 2024), the Australian Bureau of Statistics released the latest - Labour Force,…
Australia labour market deteriorating – symbolises massive Federal government policy failure
After yesterday’s disastrous wages growth data release, today’s Australian Bureau of Statistics release of its latest data – Labour Force, Australia, October 2019 – confirms, as if we need confirmation, that the Australian economy is weakening and the labour market is is poor shape. The culprit – the Australian government which is starving spending by its obsessive pursuit of a fiscal surplus. It is likely that the economy will thwart that ambition anyway – in the wrong way – by reducing tax revenue below that projected. Meanwhile the well-being of millions of Australian workers is being abused by our elected officials. Employment growth was negative. Full-time employment fell sharply. The participation rate fell. Unemployment rose even though the participation rate fell. Hidden unemployment is up. Underemployment is up. The broad labour underutilisation is at 13.8 per cent with an upwards bias. The unemployment rate is 0.8 percentage points above what even the central bank considers to the level where inflationary pressures might be sourced from the labour market. My overall assessment is The current situation can best be characterised as deteriorating from an already weak state. The Australian labour market remains a considerable distance from full employment and the gap is widening. This persistence in labour wastage indicates that the policy settings are to tight (biased to austerity) and deliberately reducing growth and income generation. There is clear room for some serious fiscal policy expansion at present. The Federal government is willfully undermining our economy with its irresponsible policy position.
The summary ABS Labour Force (seasonally adjusted) estimates for October 2019 are:
- Employment decreased by 19,000 (-0.1 per cent) – Full-time employment decreased by 10,300 and part-time employment decreased by 8,700.
- Unemployment increased by 17,100 to 726,100 persons.
- The official unemployment rate increased by 0.1 points to 5.3 per cent.
- The participation rate decreased by 0.1 points to 66 per cent.
- Aggregate monthly hours worked decreased by 2.8 million hours (-0.15 per cent).
- Underemployment increased by 0.2 points (25.9 thousand) to 8.5 per cent (1,163.2 thousand) and the total labour underutilisation rate (unemployment plus underemployment) increased 0.3 points to 13.8 per cent. There were a total of 1,889.3 thousand workers either unemployed or underemployed.
Employment declines overall in October 2019
Employment decreased by 19,000 (-0.1 per cent) – Full-time employment decreased by 10,300 and part-time employment decreased by 8,700.
The decline in both full-time and part-time meant that hours of work decreased overall and underemployment rose by 0.2 points (see below).
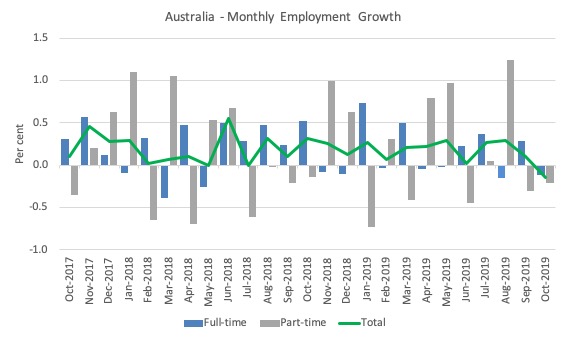
The following graph shows the month by month growth in full-time (blue columns), part-time (grey columns) and total employment (green line) for the 24 months to October 2019 using seasonally adjusted data.
The zig-zag pattern where employment growth has regularly been around zero remains evident.
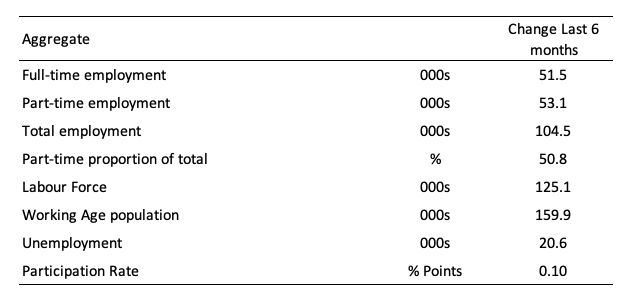
The following table provides an accounting summary of the labour market performance over the last six months. As the monthly data is highly variable, this Table provides a longer view which allows for a better assessment of the trends.
Assessment:
1. Total employment has failed to keep pace with the underlying population growth.
2. As a consequence unemployment has risen up.
3. More than half the net employment change has been part-time.
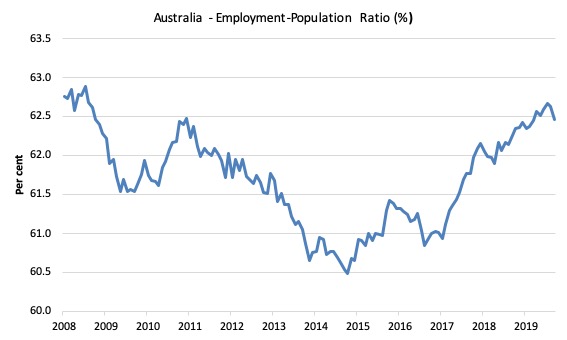
Given the variation in the labour force estimates, it is sometimes useful to examine the Employment-to-Population ratio (%) because the underlying population estimates (denominator) are less cyclical and subject to variation than the labour force estimates. This is an alternative measure of the robustness of activity to the unemployment rate, which is sensitive to those labour force swings.
The following graph shows the Employment-to-Population ratio, since February 2008 (the low-point unemployment rate of the last cycle).
It dived with the onset of the GFC, recovered under the boost provided by the fiscal stimulus packages but then went backwards again as the Federal government imposed fiscal austerity in a hare-brained attempt at achieving a fiscal surplus in 2012.
The ratio was fell by 0.1 points in October 2019 at 62.5 per cent and remains below pre-GFC peak in April 2008 of 62.9 per cent.
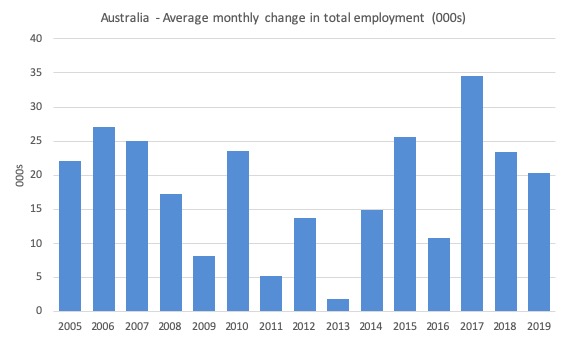
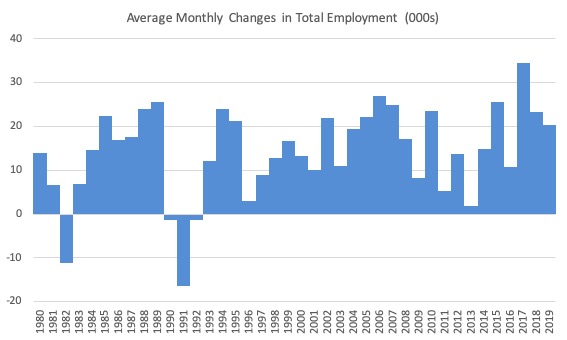
To put the current monthly performance into perspective, the following graph shows the average monthly employment change for the calendar years from 2005 to 2019 (to date).
It is clear that after some lean years, 2017 was a much stronger year if total employment is the indicator.
It is also clear that the labour market weakened considerably over 2018.
So far 2019, is performing worse than the weakening performance from 2018.
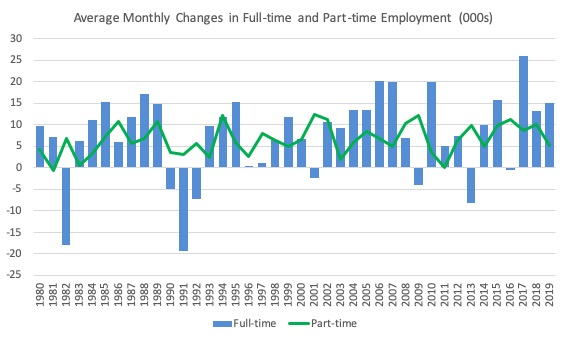
To provide a longer perspective, the following graphs shows the average monthly changes in Total employment (upper panel), and Full-time and Part-time employment (lower panel) in thousands since 1980.
The interesting result is that during recessions or slow-downs, it is full-time employment that takes the bulk of the adjustment. Even when full-time employment growth is negative, part-time employment usually continues to grow.
Unemployment increased by 17,100 to 726,100 persons
The official unemployment rate increased by 0.1 points to 5.3 per cent even though the participation rate fell in the face of weak employment growth (see below).
The policy settings are such (austerity bias) that unemployment is now stuck at elevated levels with an upward bias.
It is well above the level that would be associated with any inflationary impulses being sourced from the labour market
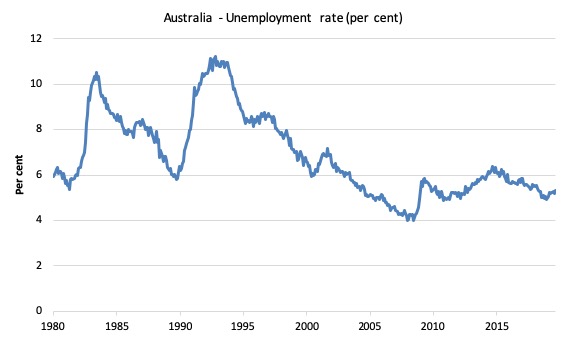
The following graph shows the national unemployment rate from January 1980 to October 2019. The longer time-series helps frame some perspective to what is happening at present.
Assessment:
1. It is still 0.4 points above the level it fell to as a result of the fiscal stimulus (which was withdrawn too early) and 1.3 point above the level reached before the GFC began.
2. There is clearly still considerable slack in the labour market that could be absorbed with fiscal stimulus.
3. Its upwards trajectory is directly related to the fiscal austerity that the Federal government has in place.
Aggregate participation rate – decreased by 0.1 points to 66 per cent
The employment situation is so dire that unemployment continued to increase even though the participation rate fell.
In other words, the unemployment rate would have risen by a greater amount than it actually did. That is an indictment of the government policy position.
By how much would unemployment have risen if the participation rate had not fallen?
The labour force is a subset of the working-age population (those above 15 years old). The proportion of the working-age population that constitutes the labour force is called the labour force participation rate. Thus changes in the labour force can impact on the official unemployment rate, and, as a result, movements in the latter need to be interpreted carefully. A rising unemployment rate may not indicate a recessing economy.
The labour force can expand as a result of general population growth and/or increases in the labour force participation rates.
The following Table shows the breakdown in the changes to the main aggregates (Labour Force, Employment and Unemployment) and the impact of the rise in the participation rate.
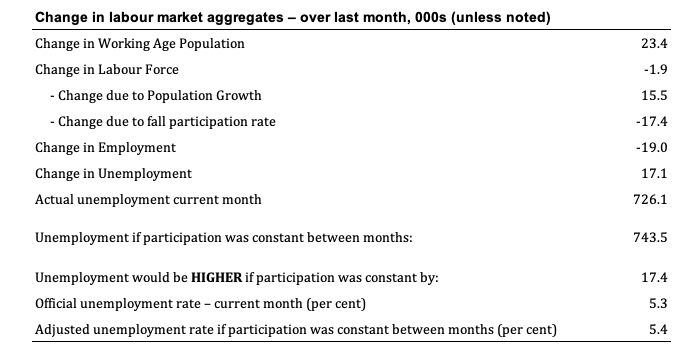
The change in the labour force in October 2019 was the outcome of two separate factors:
- The underlying population growth added 15.5 thousand persons to the labour force. The population growth impact on the labour force aggregate is relatively steady from month to month but has slowed in recent months; and
- The fall in the participation rate meant that there were 17.4 thousand workers dropping out of the labour force (relative to what would have occurred had the participation rate remained unchanged).
- The net result was that the labour force decreased by 1.9 thousand (rounded).
Assessment:
1. If the participation rate had not have fallen, total unemployment, at the current employment level, would have been 743.5 thousand rather than the official count of 726.1 thousand as recorded by the ABS – a difference of 17.4 thousand workers (the ‘participation effect’).
2. Without the fall in the participation rate in October 2019, the unemployment rate would have been 5.4 per cent (rounded) rather than its current value of 5.3 per cent (rounded).
3. Hidden unemployment rose slightly in October 2019 – a sign of a weakening situation.
Broad labour underutilisation increased 0.3 points to 13.8 per cent
We are approaching a disaster situation with labour wastage at these levels (and an upward bias).
The results for October 2019 are (seasonally adjusted):
1. Underemployment increased by 0.2 points (25.9 thousand) to 8.5 per cent (1,163.2 thousand).
2. The total labour underutilisation rate (unemployment plus underemployment) increased 0.3 points to 13.8 per cent.
3. There were a total of 1,889.3 thousand workers either unemployed or underemployed.
The following graph plots the seasonally-adjusted underemployment rate in Australia from January 1980 to the October 2019 (blue line) and the broad underutilisation rate over the same period (green line).
The difference between the two lines is the unemployment rate.
The three cyclical peaks correspond to the 1982, 1991 recessions and the more recent downturn.
The other difference between now and the two earlier cycles is that the recovery triggered by the fiscal stimulus in 2008-09 did not persist and as soon as the ‘fiscal surplus’ fetish kicked in in 2012, things went backwards very quickly.
The two earlier peaks were sharp but steadily declined. The last peak fell away on the back of the stimulus but turned again when the stimulus was withdrawn.
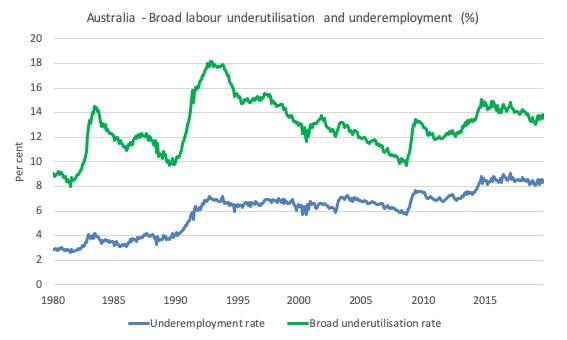
If hidden unemployment (given the depressed participation rate) is added to the broad ABS figure the best-case (conservative) scenario would see a underutilisation rate well above 15 per cent at present. Please read my blog post – Australian labour underutilisation rate is at least 13.4 per cent – for more discussion on this point.
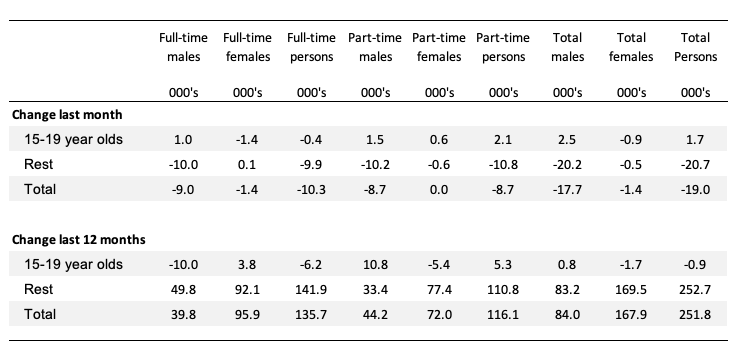
Teenage labour market – employment rose slightly in October 2019
Total teenage net employment rose by 1.7 thousand in October 2019 with full-time teenage employment falling by 0.4 thousand.
The teenage unemployment rate rose by 0.3 points to 17.9 per cent.
The following Table shows the distribution of net employment creation in the last month and the last 12 months by full-time/part-time status and age/gender category (15-19 year olds and the rest)
Over the last 12 months, teenagers have gone backwards losing 900 net jobs, while the rest of the labour force gained 252.7 (net) jobs. The overall shift in employment is very poor.
In terms of the current cycle, which began after the last low-point unemployment rate month (February 2008), the following results are relevant:
1. Since February 2008, there have been 2,271.6 thousand (net) jobs added to the Australian economy but teenagers have lost 68.6 thousand over the same period.
2. Since February 2008, teenagers have lost 105.5 thousand full-time jobs (net).
3. Even in the traditionally, concentrated teenage segment – part-time employment, teenagers have gained only 36.9 thousand jobs (net) even though 1,078.9 thousand part-time jobs have been added overall.
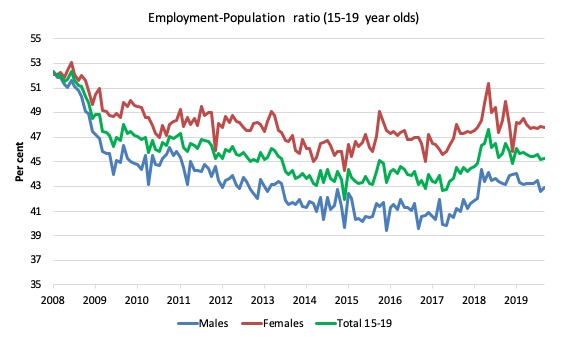
To put the teenage employment situation in a scale context (relative to their size in the population) the following graph shows the Employment-Population ratios for males, females and total 15-19 year olds since February 2008.
You can interpret this graph as depicting the loss of employment relative to the underlying population of each cohort. We would expect (at least) that this ratio should be constant if not rising somewhat (depending on school participation rates).
The absolute loss of jobs reported above has impacted more on males than females.
The male ratio has fallen by 9.4 percentage points since February 2008, the female ratio has fallen by 4.3 percentage points and the overall teenage employment-population ratio has fallen by 6.9 percentage points.
The other statistic relating to the teenage labour market that is worth highlighting is the decline in the participation rate since the beginning of 2008 when it peaked in February at 61.4 per cent.
In October 2019, the participation rate was 55.2 per cent. This is a very unreliable statistic overall – it fluctuates widely on a monthly basis.
However, the difference between the 2008 level, amounts to an additional 85.1 thousand teenagers who have dropped out of the labour force as a result of the weak conditions since the crisis.
If we added them back into the labour force the teenage unemployment rate would be 25.5 per cent rather than the official estimate for October 2019 of 17.9 per cent.
Some may have decided to return to full-time education and abandoned their plans to work. But the data suggests the official unemployment rate is significantly understating the actual situation that teenagers face in the Australian labour market.
Overall, the performance of the teenage labour market leaves a lot to be desired. The decline in full-time employment for teenagers was particularly worrying.
This situation doesn’t rate much priority in the policy debate, which is surprising given that this is our future workforce in an ageing population. Future productivity growth will determine whether the ageing population enjoys a higher standard of living than now or goes backwards.
I continue to recommend that the Australian government immediately announce a major public sector job creation program aimed at employing all the unemployed 15-19 year olds, who are not in full-time education or a credible apprenticeship program.
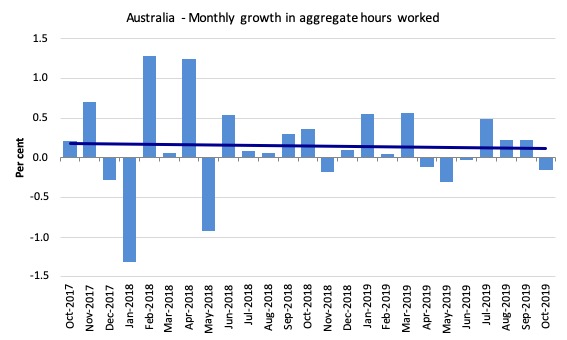
Hours worked decreased by 2.8 million hours (-0.15 per cent) in October 2019
This reinforces the failing labour market.
The following graph shows the monthly growth (in per cent) over the last 24 months.
The dark linear line is a simple regression trend of the monthly change – which depicts a slightly declining trend.
Conclusion
My standard monthly warning: we always have to be careful interpreting month to month movements given the way the Labour Force Survey is constructed and implemented.
The October data reveals a deteriorating labour market conditions.
Employment growth was negative.
Full-time employment fell sharply.
The participation rate fell.
Unemployment rose even though the participation rate fell.
Hidden unemployment is up.
Underemployment is up.
Broad labour underutilisation is at 13.8 per cent with an upwards bias.
The unemployment rate is 0.8 percentage points above what even the central bank considers to the level where inflationary pressures might be sourced from the labour market.
My overall assessment is:
1. The current situation can best be characterised as deteriorating from an already weak state.
2. The Australian labour market remains a considerable distance from full employment and the gap is widening.
3. This persistence in labour wastage indicates that the policy settings are to tight (biased to austerity) and deliberately reducing growth and income generation.
4. There is clear room for some serious fiscal policy expansion at present.
That is enough for today!
(c) Copyright 2019 William Mitchell. All Rights Reserved.
Bill or anyone,
Near the top of this post I see this, “The official unemployment rate increased by 0.1 points to 5.3 per cent.”
In the conclusion I see this, “The unemployment rate is 7 percentage points above what even the central bank considers to the level where inflationary pressures might be sourced from the labour market.”
It seems to me that if the ARB thinks that 1% unemployment is the max. without any inflation pressure then
7 percentage points more than 1% is 8%, not 5.3%.
What don’t I understand clearly?
” No one is pretending that it is anything other than a difficult payment (Newstart)
to live on for anything other than a short period of time. But the design of Newstart
is to ensure that people come into the system and go out. And fundamentally
as a government our focus is this – getting people out of the welfare system.”
Christian Porter, Attorney General SMH October 16, 2019
What sort of knucklehead government refuses to acknowledge the chronic deterioration of labour market conditions and rely on interest rate cuts to stimulate a cash strapped, heavily indebted economy to create employment. Meanwhile, the unemployed try to survive on meagre Newstart stopgap payment while they wait for the economy to magically improve
“What sort of knucklehead government refuses to acknowledge the chronic deterioration of labour market conditions and rely on interest rate cuts to stimulate a cash strapped, heavily indebted economy to create employment. Meanwhile, the unemployed try to survive on meager Newstart stopgap payment while they wait for the economy to magically improve.”
The basic idea is that if you drive the unemployment “safety net” down to punitive levels you undermine labors’ bargaining power and drive wages down even further.
Neoliberalism was never about maximizing economic growth. It was always about higher profitability by suppressing wages to increase capital’s share of the income distribution.
@Steve_American,
I find that confusing, too. I know the RBA governor says the Australian unemployment rate should be 4.5% (not above 5% as at present). So 4.5 + 7 = 11.5…..
Needless to say, the RBA figure is likely based on NAIRU fiction,
Bill,
I can be wrong about this, but I don’t think so.
I think you have it backwards. When we say the the cost of a thing for sale and now on sale was reduced by 50%, that means it was cut from {say}$10 down to $5.
When we say that the unemployment rate of 6% was cut by 50% over the last {say 3 years} we mean it is now 3%. Or we could say it was cut by 3 percentage points.
But, I could be wrong about this. And Aust. might say it different.
Bill,
I see that you changed the blog to say it is 0.8 percentage points higher. Good.
OTOH, to me 0.8 percentage points seems like nothing at all.
However, 4.86% or “almost 5% just sounds like a bigger amount. Even if they are the same amount.
So, if it were me {it isn’t} I would have said “almost 5% higher”.
@Steve _American
So we can say the 5.3% Oz unemployment rate is 0.8 of a full percentage point higher than the RBA inflation stable estimate of 4.5%.
Now, 5.3% is c.18% higher than 4.5%, which no doubt translates to quite a few jobs
@ Neil,
I just used Bill numbers. I didn’t double check them. Maybe I should have.
So, yes, 18% sounds like a lot more than 5%.
But then, maybe you didn’t figure it right either.
Neil,
If your 18% figure is correct, then is it not true the 18% of all those who are “unemployed” are unemployed unnecessarily?
And of course the NLIF* figure is not based on any sot of reality. It is just BS. The economists change it at will to say what they want it to say. So when unemployment is 25% they will claim that it is 15% and when it is 5% they will claim it is 4%.
.* . Sorry if I got the letters wrong, I’m not an economists and I’m too lazy to look it up. I hope You can figure out what I’m referring to.
Steve_American,
I think the letters you are referring to are the NAIRU number (4.5% according to the RBA).
And yes, as you say, any number higher than that, in this example 18% higher, or 0.8 percentage point higher, ie, 5.3%, will no doubt be regarded as “unnecessary” by the neoliberal economists at the RBA.