Yesterday (April 24, 2024), the Australian Bureau of Statistics (ABS) released the latest - Consumer…
Fiscal stimulus disappears into saving – solution – bigger stimulus was needed in the first place
On February 7, 2020, the Reserve Bank of Australia’s Governor, Philip Lowe appeared before the Federal House of Representatives Standing Committee on Economics to discuss the – Reserve Bank of Australia Annual Report 2019 – which is a bi-annual event where the Parliament scrutinises the activities of the unelected and largely unaccountable central bank. The – Transcript – of the session makes interesting reading. The discussion highlighted how mainstream economists fail to understand the nature of the monetary system. Last year, the Federal government introduced a fiscal stimulus (tax cut) as a bribe in the May election campaign. But economic growth continued to slow, in the face of flat real wages growth and an overall fiscal contraction (despite the tax cuts). The tax cuts didn’t stimulate private spending growth and mainstream economists then claim this proves that fiscal policy is ineffective, and by implication, that Modern Monetary Theory (MMT) is a load of nonsense. The problem is that the tax cuts were used by households to reduce the precarious debt levels that have been building up as they try to maintain spending growth in the face of fiscal drag and flat real wages growth. All that this episode tells us is that the government really should have introduced a much larger fiscal stimulus in the first place to help the balance sheet restructuring effort and provide net growth stimulus.
Philip Lowe’s testimony highlights the message I have been putting to audiences during my current speaking tour of Europe and the UK – that the mainstream macroeconomics policy obsession with monetary policy and the accompanying denial of active fiscal intervention in favour of blind pursuit of surpluses, has pushed other aggregates into dangerous spaces and undermined the concept of sustainable prosperity for all.
In his Opening Statement – the RBA Governor said that while projected economic growth was likely to increase over the next year, there were significant risks in those forecasts.
He mentioned the on-going China-US trade issues, and, more recently, the Coronavirus outbreak as possible global issues that will stifle growth.
But then he turned to the domestic economy and said:
… perhaps the most significant one at the moment is that household consumption spending has been very soft. For some time now, households have been gradually adjusting their spending to slower growth in income. It appears that this adjustment accelerated last year in response to falling housing prices. Faced with the reality of slow growth in wages and falling housing prices, many households scaled back their spending and adjusted their finances last year.
The problem then is two-fold.
First, the fact that households are carrying such high debt levels relative to disposable income and are not enjoying much income growth has focused their attention on increasing saving to reduce the debt levels.
That means that Australia’s reliance on private credit growth to continue to maintain spending overall spending growth (and remember consumption expenditure is the dominant source of total demand in the economy), in the face of fiscal drag coming from the Government’s obsession with fiscal surplus pursuit, is now faltering.
Second, when the Federal government did introduce its tax cuts in July last year as a concession to the dramatic slowdown in economic growth and rising unemployment (but also as an election bait to win the May 2019 election), the expected spending boost from households did not eventuate.
Why?
Because the tax cuts, which increased disposable income a little, were mostly applied to saving to pay down the huge debt levels.
In my last lecture at Helsinki University last week, I introduced the students to the concept of a ‘balance sheet’ recession.
I wrote about that concept in this blog post (among others) – Balance sheet recessions and democracy (July 3, 2009).
A normal V-shaped recession is typically driven by business firms becoming pessimistic and reduce the rate of investment spending, which, then, via the multiplier process causes a generalised slowdown in economic activity and can lead to a short, sharp and sometimes deep recession.
Typically, government will then intervene with a stimulus, which helps sentiment improve and private spending recovers fairly quickly.
Hence the V-shape. Down and Up fairly quickly.
A balance sheet recession is different.
It starts as a result of the private sector build up of massive debt levels, typically, to buy property and speculative assets. But it also could be to maintain consumption and investment spending in the face of fiscal drag and flat income growth.
Asset prices rise as demand rises but then eventually the bubble bursts and the private sector is left with declining wealth but huge debt.
The private sector then start restructuring their balance sheets – and stop borrowing – no matter how low interest rates go.
All effort is devoted to paying back debt (de-leveraging) and households increase their saving and reduce spending because they become pessimistic about the future.
A credit crunch emerges – not because there is enough funds but because banks cannot find credit-worthy borrowers to make loans to.
Attempts at pumping liquidity into the banks will fail because they are not reserve-constrained. The reason they are not lending is because no-one worthy wants to borrow.
The faltering spending causes the macroeconomy to enter recession.
The process of balance sheet reconstruction is a slow one and requires protracted saving over a long period.
During that process, the only way out is via sustained public sector deficit spending for a lengthy period.
Governments encountering this situation, will then typically come under political pressure after a short time to curb their deficits and pursue austerity.
That is the worst thing they can do because it undermines the private balance sheet restructuring process.
Governments should also not be concerned that stimulus measures such as tax cuts are applied by the recipients to increase saving rather than increase spending.
That is just a reflection of the restructuring task ahead and tells us that the stimulus provided by the government is not large enough to drive growth and help private households and firms reduce the precariousness of their debt positions.
I discussed the Household debt situation in Australia in this blog post (among others) – Household debt is part of a broader problem – be informed (November 22, 2017).
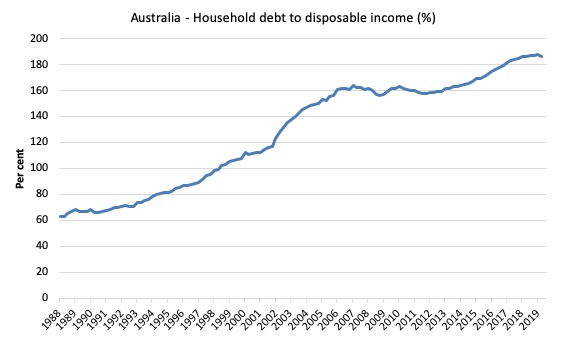
The most recent RBA data – Household Finances – Selected Ratios – E2 – shows that the ratio of household debt to annualised household disposable income is now at record levels – each month a new record is established.
The following graph shows the ratio from 1988 (the beginning of the series) to the June-quarter 2017.
In June 1988, the ratio was 63.2 per cent. It peaked at 171 per cent in the June-quarter 2007, just before the GFC emerged.
It stabilised for a while as the fear of unemployment and the economic slowdown curbed credit growth for a while. But that didn’t last.
Over the last two years it has accelerated considerably and in the September-quarter 2019, the ratio was 186.5 per cent, although in recent quarters we have seen a tapering, as economic conditions become less buoyant.
The position of Australian households, carrying record levels of debt, is made more precarious by the record low wages growth and the conduct of the private banks.
Please read my blog post – Australia’s household debt problem is not new – it is a neo-liberal product (February 22, 2017) – for more discussion on this point.
The banksters have sought to load as much debt onto households as they can in search of their profits.
They have ignored the obvious risk that in a flat wages growth environment the risk of household insolvency is elevated because they know the neoliberal game is to privatise the gains and socialise the losses.
They have used tactics ranging from cutting corners on documentation to outright fraud to push credit onto households.
For a while, the rise in debt (driven by the credit binge) was allowing household consumption growth to continue, even though household incomes were growing slowly if at all.
But as the debt levels rose, eventually, the precariousness of the household balance sheets had to have an effect.
This is the point that the RBA Governor was making.
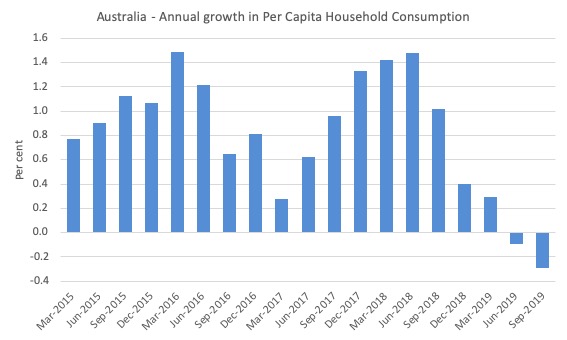
The next graph shows the quarterly growth in Australian household consumption expenditure from the March-quarter 2016 to the September-quarter 2019.
It is now grinding towards zero.

If you look at growth in real household consumption spending per capita (next graph), that has now been in decline since the middle of 2018 and recorded negative growth in the June- and September-quarters of 2019.
So, on average, Australian households are cutting their consumption spending quite sharply despite the tax cuts in July 2019.
I have long argued that sustaining household consumption growth by pushing ever-increasing levels of debt onto households is not a sustainable strategy.
The data is now supporting that view.
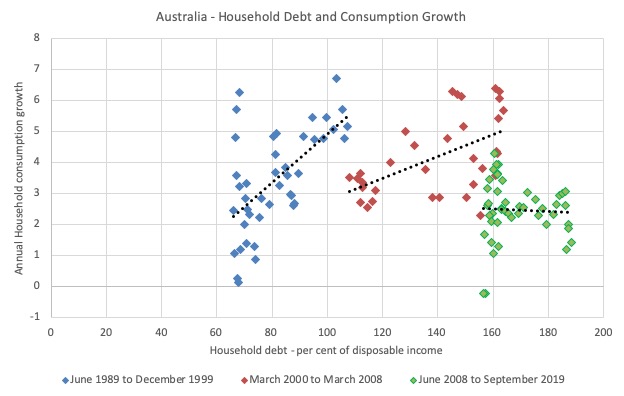
The final graph shows the way in which the evolution of the household debt ratio relates to the annual growth in household consumption expenditure.
When I first plotted the data (as a single sample), I noticed that there was clear evidence of temporal instability, which means that the relationship was seemingly shifting over time.
I did some more sophisticated econometric regime-switching analysis and confirmed my suspicions.
The graph thus shows three segments of the sample:
1. June-quarter 1989 to December-quarter 1999 – at which point the relationship started to shift outwards. At this point, the household debt ratio was 107.9.
2. March-quarter 2000 to March-quarter 2008 – taking us up to the GFC, at which point I detected further instability.
3. June-quarter 2008 to September-quarter 2019 (latest data).
And the dotted lines are the linear trends for each sub-sample derived from a simple regression equation.
The analysis is simple and illustrative. We should never infer too much from cross plots (correlation versus causation and all that) but the patterns are interesting.
As the household debt ratio rose in the late 1980s and into the 1990s, with the deregulation of the financial sector, growth in household consumption was stronger. Hence the upward sloping dotted line for the blue marker period.
In the second period, the relationship remains positive but it is weakening (flatter dotted line). So an increase in the household debt ratio is associated with a lower growth in household consumption than it would have in the earlier period.
Finally, in the post-GFC period, as the debt ratio flattened out and then accelerated again, the relationship has turned negative.
Which is what the RBA Governor is worried about.
Conclusion
The point is that:
1. The government thinks it is being smart squeezing the non-government sector of liquidity by pursuing fiscal surpluses.
2. The fiscal drag that resulted has suppressed economic activity and led to slow income growth and for some workers real wage cuts.
3. For a time, the non-government sector has been able to maintain expenditure and pursue the housing ambitions that are part of Australian culture by borrowing. The financial markets are continually trying to push debt onto households and bend rules to do so.
4. That process ultimately fails because the debt becomes too large and household solvency becomes vulnerable to small shifts in things like interest rates, unemployment rates etc.
5. Then they stop consuming and start to save again to try to bring the debt levels back down to manageable levels.
6. The government, to win a federal election, offers tax cuts. But nothing much happens to growth – it continues to fall because by then the slowdown in consumption is taking effect.
7. The government wonders why there is no stimulus effect and stupid economists start claiming that fiscal policy is ineffective and Modern Monetary Theory (MMT) is all wrong and they told you so!
8. But they just don’t understand the nature of the slowdown – being of balance sheet origins – and the tax cuts are being deployed by households to help then bring down the debt levels.
9. What the government really should be doing is introducing a much larger fiscal stimulus – to help the balance sheet restructuring effort and provide net growth stimulus.
That is enough for today!
(c) Copyright 2020 William Mitchell. All Rights Reserved.
In neoliberal terms, the confidence fairy needs to sprinkle some more magical gold dust to convince people to consume beyond their means.
Either way, it’s the government’s fault.
That last scatter plot is very interesting. It looks like the trend line through that last scatter does slope down, showing that by now in the aggregate, additional borrowing by households makes them worse off. Suggesting that there’s evidence that they can see that tells them it’s time to start paying back.
If the usual suspects had a good theory of paying-back as counterpoise to their theory of credit, they could be less surprised when their recovery stays L-shaped.
In my opinion it is the housing bubble pulsating but the signals are so far somewhat confusing. “RBA Chart Pack Household Sector Released on 5 February 2020” shows that there is an increasing trend in owner-occupier lending but other measures of household aggregate demand are falling.
There is a couple of research papers written by Brett Fiebiger and Marc Lavoie where they argue that it is the housing investment tail what is wagging the whole economy dog. One of the papers is “Trend and Business Cycles with External Markets: Non‐Capacity Generating Semi‐Autonomous Expenditures and Effective Demand” Metroeconomica 2019
Let me write something rather controversial. It is a design bug in the Australian constitution, depriving the states from having reliable sources of taxation revenue while putting the burden of providing various services to the population. This, combined with neoliberal obsession of running surpluses in federal budget and unwillingness of the RBA to simply fix the price of individual states’ debt instruments, has been forcing the states to rely on stamp duty.
The end result is that in such an empty country like Australia, the supply of residential land has been severely constrained. I know the stories that “Sydney is full” (invented by Bob Carr, the former premier of NSW). I am sorry I am not buying this garbage. I know that there is an issue with water but this can be fixed by reducing the amount wasted. I was born in a country where average population density is much higher. I travelled extensively across Europe, saw a few places in the US and even went to China. I have a lot of family in Canada (not in Vancouver) and in Poland. I know how much their properties are worth.
It is not Sydney what is full. We are fools with vested interests. The last elections were framed by Scotty from Marketing as a referendum on the preservation of the housing bubble and the ridiculous privileges enjoyed by Baby Bummers (Boomers) such as the negative gearing. This was also a referendum on intergenerational theft and exploitation of the migrants. The parasites have won again but in the end the system must collapse – this year, next year on in 10 years time.
Even with the current exchange rate our real estate is much more expensive than anywhere else except for the places where the supply of land is objectively constrained (such as Vancouver or Hong Kong) or other places with active housing bubbles (in China). But if we go to Perth we will see how the landscape looks like when the bubble finally bursts. There were boarded up shops in 2018 near the city centre (I saw them with my own eyes).
Now the key point. A very significant fraction of the demand for real estate was coming from China. It is difficult to find hard data but this could be the flea which is causing the dog’s tail to move what in the end is wagging the whole dog. I can write more about this topic later. Thanks to coronavirus, this component of demand will not be present here for at least a few months. Will this be enough to prickle the bubble? I don’t know.
The main problem is not that the government is stupid because they don’t want to stimulate the economy. Stupid are the people who elected the government which is hell bent on destroying the environment. But who cares about carbon dioxide emissions when a grave threat to franking credit and negative gearing emerged? The country may literally burn but my house price and my wealth is sacrosanct. In this contest I would like to say that I am waiting for the bubble to finally collapse and bring down the whole house of card called the Australian economy with it. We deserve this.
Basically there needs to be a buffer stock of residential land on the outskirts of the major cities or people should be able to easily rezone. This condition has been met in the most of American cities after the GFC even if the prices here and there may wobble. The buffer stocks around Perth and Adelaide have been replenished after the prices collapsed. One can buy a decent block for less than 200k. Near Sydney the closest place is Singleton. We will see what happens when the impact of bushfires filters through…
I am not talking about the places where this policy is physically impossible, there high prices are unavoidable. At the same time there needs to be a buffer stock of social housing like in Montreal. This anchors rents. To suppress unnecessary demand, a highly progressive tax needs to be imposed on all residential properties. Someone who has a 3-4 bedroom house in Mount Druitt would not pay anything. Someone who owns a mansion in Vaucluse would pay a lot. Also land banking should be taxed.
If this does not happen, the dysfunctional dynamics has to prevail and in my opinion private debt / GDP ratio will keep growing until the bitter end when you know what happens – either a bust or 40 years of stagnation.
I think it is now too late for the great country-continent inhabited by stupid people with corrupted minds.
Bill, you wrote, “A credit crunch emerges – not because there is [not] enough funds but because banks cannot find credit-worthy borrowers to make loans to.”
Doesn’t it need the ‘not’ I added?
In terms of economic effect on household consumption, spending all or part of the tax cuts to increase newstart would have achieved a much larger impact. My thinking is based on two assumptions. Firstly, people on newstart will not hold onto any money -> it will circulate quickly through the economy. Secondly, it means larger injections to areas with larger unemployment -> this is potentially areas where local businesses may also be struggling. Win win!
I get a sense that this is what will happen in the UK. We already have a housing bubble that, in cycles, has lasted 40 years creating a wealth transference and an absolute fall in home ownership from 2003.
So despite Johnson ‘mouth-farting’ about ‘levelling up the country’ and his Party suddenly having no problem spending after trashing local authorities, ostensibly killing tens of thousands and leaving a real debt of trashed lives and worsening health we get this immediately after the election:
‘Britain’s property market is in the grip of fresh boom, according to Rightmove, with asking prices jumping by more than £2,500 over the past month alone.
The average asking price for a home rose to £309,399 in February, £40 shy of its all-time record, said Rightmove. Buyers and sellers have been invigorated by renewed economic confidence, described as the “Boris bounce”, it added.’
So much for ‘taking back control’ and the much vaunted miracle cure of Brexit which people up North thought would cause a national resurgence regardless of Government policy. It appears, waiving a Union Jack is enough to make housing affordable! The Tories have not committed to building enough social housing that could alleviate this problem the manifesto merely saying that they will build a million homes of ‘mixed tenure.’ This will mean business as usual:
1. Developers maximising profit
2. By building houses that are energy sieves.
3. Renege on the social housing component by using ‘a feasibility study.’
4. Land owners still getting the land price as ‘hope value.’
5. More land banking.
6. Increasing numbers of people in rip-off landlord housing with rents exceeding 50% of income in some instances.
levelling up?
As Bill has mentioned, to deal with a balance sheet recession with millions in debt peonage will take very significant deficits- how can the Tories square that with the wealth extraction scam that is housing and from which many of their M.P’s draw their unearned increments?
I read most of the transcript of the inquiry into the RBA report cited in the introduction. If these are the people steering the ship, it is enough to drive one to desperation.
Damn that MMT ‘red pill’!
The Report exposes denial by both the government committee members and the RBA governor on the fact that, firstly, monetary policy has become largely ineffective and, secondly, that fiscal policy should be fearlessly engaged. The governor occasionally suggests fiscal policy as being an option for stimulating the economy, but when pressed, timidly backs away from advocating it.
Another grim discovery – though not surprising – is that the RBA is happy tolerating housing-bubbles in order to support its wider policy objectives, even though it is socially corrosive and adds further to household debt, and all of what that brings.
It just goes to show how utterly disconnected these people are from the economic challenges facing ordinary citizens.
There is a long way to go.
Typo alert:
->“elevated”
@Adam K: Good points on the housing bubble. In the UK, housing has a similarly distorting effect on the economy, as detailed by @Simon Cohen.
@Mike Ellwood:
Perhaps, in writing ‘eleated’, Bill was creating a neologism that combined the ‘elevated’ insolvencies with the ‘elation’ of the banksters in knowing that their risks are socialised 🙂