Yesterday, the Bank of Japan increased its policy target rate for the first time in…
Japan national accounts – sales tax rise, growth collapses – as night follows day
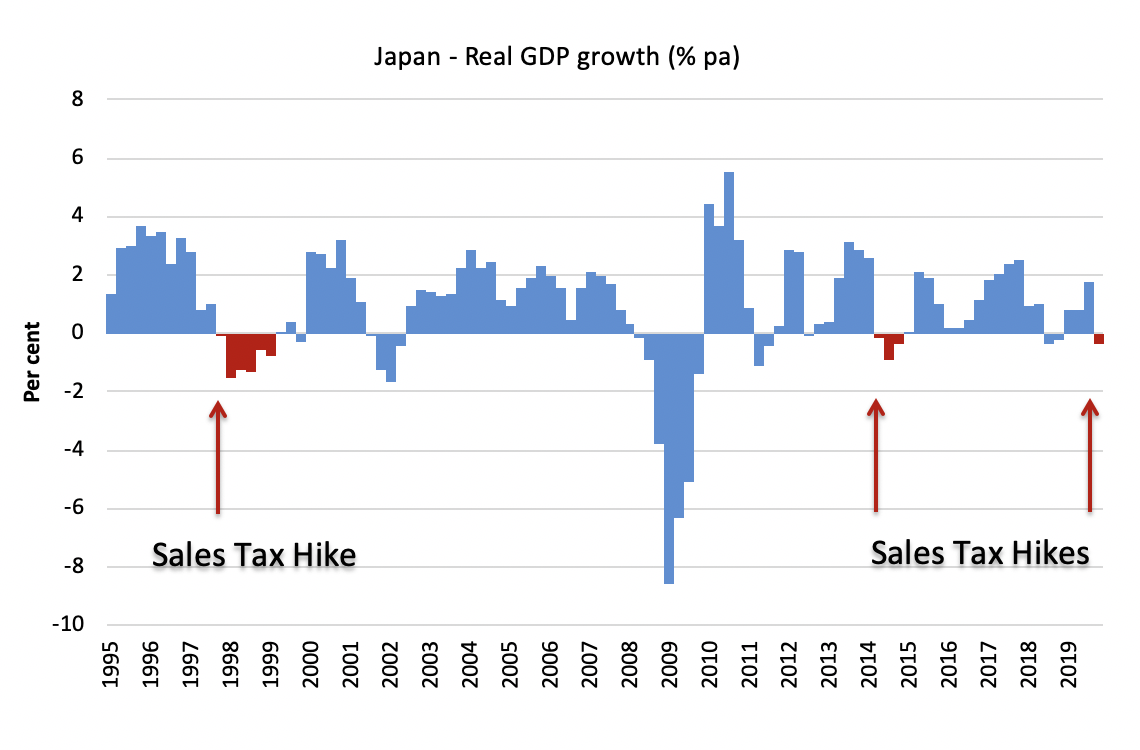
In my blog post – Japan about to walk the plank – again (September 30, 2019) – I predicted that the decision by the Japanese government to increase the sales tax from 8 per cent to 10 per cent on October 1, 2010 would undermine non-government spending and growth and was totally unnecessary anyway. The government had fallen prey to the deficit terrorists who have been consistently bullying them into believing that their fiscal position is about to collapse and the bond markets would desert them. Funny that! The Bank of Japan has been buying the bulk of the public debt issued over the last several years anyway. The reality is that, given the instability of world conditions (US-China trade, European slowdown, Brexit, and, more recently, the Corona virus impacts), the Japanese government should have been increasing its fiscal deficit. Yesterday (February 17, 2020), the latest national accounts data from Japan tells us the damage that this policy folly has inflicted. Every time the Japanese government has hiked the sales tax (1997, 2014, 2019) real GDP growth has plummetted and pushed the economy into recession. In the final quarter of 2019, Japan’s growth rate slumped by an annualised 6.3 per cent, driven by a massive 11.1 per cent decline in consumption spending and capital investment decline of 14.1 per cent. Sure enough, Typhoon Hagibis was also a factor but it is undeniable that the sales tax hike was instrumental. The Spanish philosopher George Santayana had it in one when in his first volume (1905) of his book – The Life of Reason: The Phases of Human Progress – said: “Those who cannot remember the past are condemned to repeat it”.
Two days after the Japanese government hiked its sales tax rate in a futile pursuit of cutting its deficit, I wrote in my blog post – Leading indicators are suggesting recession (October 3, 2019):
With the export sector (manufacturing) in trouble as a result of the world slowdown, the last thing that the Japanese government should have done was to introduce a destabilising negative force into its domestic sector (such as the consumption tax).
We will see in coming months how damaging that move will prove to be.
Well we have seen.
Yesterday, the Cabinet Office released the latest – Japanese National Accounts data – which told a sorry story.
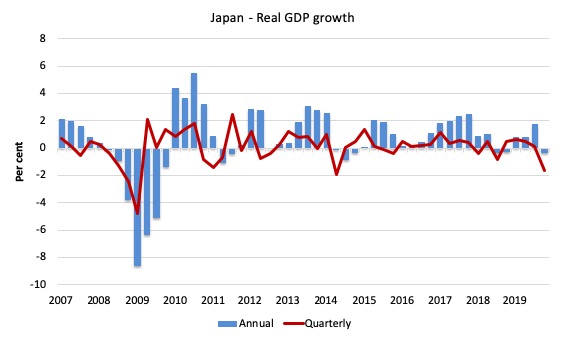
The first graph shows the quarterly and annual real GDP growth rates from the March-quarter 2007 to the December-quarter 2019.
1. Quarterly growth was down 1.61 per cent for the last three months of 2019. When the financial press report that Japan lumped by an annualised 6.3 per cent, they do that to make the quarterly result look worse than what it actually is.
Annualised means they assume the current quarterly performance will persist for the next three quarters so 1.61 by 4 gives the 6.3 result (approximately).
It is unlikely that the decline will be that severe, especially given the Government announced a stimulus package in November.
2. Annual growth was down 0.38 per cent.
You can also see the ‘sales tax’ recession of 2014, which was the direct outcome of neo-liberal policy incompetence.
Domestic demand took a beating.
1. Household consumption fell by 2.1 per cent over the 12 months and 3 per cent over the quarter.
2. Private non-residential investment fell by 2.9 per cent over the 12 months and 3.7 per cent over the quarter.
The downturn would have been worse had not the government maintained strong consumption spending growth (2.23 per cent over the 12 months, 0.22 per cent for the quarter) and public investment growth (6.4 per cent over the 12 months, 1.13 per cent for the quarter).
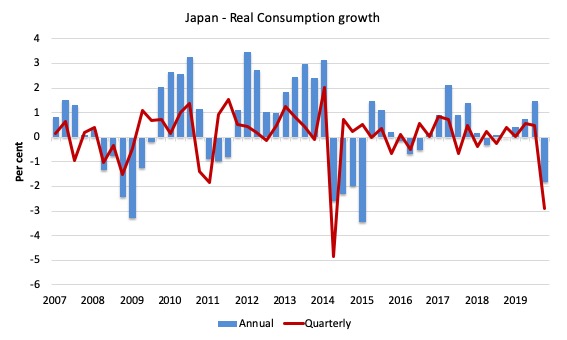
The following graph shows growth in private consumption spending since the March-quarter 2007 to the December-quarter 2019. The blue bars are the annual (year-on-year) outcome, while the red line is the quarterly result.
This is one of those magnificent graphs that you show students to demonstrate intervention effects of government policy. Private consumption growth was growing fairly strongly on up to the beginning of 2014, after the impacts of the GFC and the Tsunami had been overcome.
The sales tax hike had the predictable negative effect and the quarterly growth of private consumption ever since was rather subdued until confidence returned.
Then the Typhoon struck and this set back growth. But with government support, household consumption expenditure recovered somewhat only to be confronted with the October 1 sales tax hike.
And down it goes again following a similar trajectory to 2014.
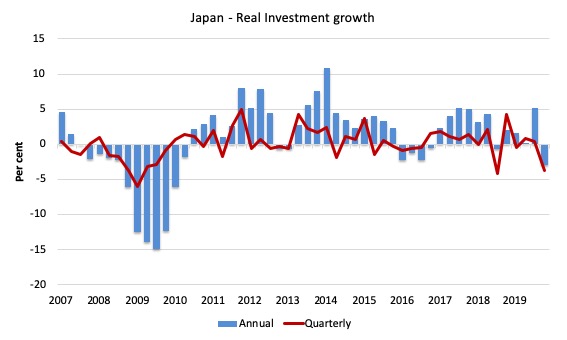
A similar story applies for private investment spending.
Fiscal stimulus boosts confidence, consumers start spending, sales increase, and firms a motivated to expand productive capacity – a virtuous cycle.
These boosts are in contrast to the mainstream macroeconomics, which consistently claims that the non-government sector will cut spending if the fiscal deficit rises. History tells us otherwise.
The following graph shows the annual and quarterly growth in private investment expenditure from the March-quarter 2007 to the December-quarter 2019.
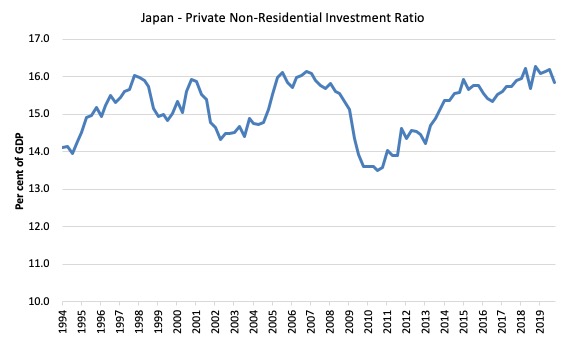
The following graph shows the Private non-residential investment ratio (per cent of GDP) frmo 1994 to the December-quarter 2019.
It fell from 16.2 per cent to 15.8 per cent in the final quarter of 2019, which is significant given that the denominator (GDP) was also falling.
The ‘Sales Tax’ impact – a recurring nightmare for Japan
It is worth reminding ourselves of the folly of sales tax policy in Japan.
In April 2014, the Abe government raised the sales tax from 5 per cent to 8 per cent.
After the sales tax hike, there was a sharp drop in private consumption spending as a direct result of the policy shift. At the time, I predicted it would get worse unless they changed tack.
It certainly did get worse. Consumers stopped spending and the impact of static consumption expenditure was that business investment then lags.
Here is the history of real GDP growth (annualised) since the March-quarter 1994 to the December-quarter 2019. The red areas denote sales tax driven recessions.
In the three episodes shown, these recessions were followed by a renewed bout of fiscal stimulus (monetary policy was ‘loose’ throughout).
And in all the episodes, there was a rapid return to sustained growth as a result of the fiscal boost.
Nothing could be clearer.
I provided detailed analysis of these historical shifts in these blog posts (among others):
1. Japan thinks it is Greece but cannot remember 1997 (August 12, 2012).
2. Japan’s growth slows under tax hikes but the OECD want more (September 16, 2014).
3. Japan returns to 1997 – idiocy rules! (November 18, 2014).
4. Japan – signs of growth but grey clouds remain (May 21, 2015).
5. Japan about to walk the plank – again (September 30, 2019).
You might wonder what happened in 2002? The recession that occurred then in Japan was largely driven by an export collapse (remember the US went into recession during this period) and a tightening of net public spending. This then provoked a fall in private investment spending and a rising saving rate. It had nothing to do with the ratings decision.
Once exports recovered and public spending support resumed the economy then grew relatively strongly despite the lower sovereign debt ratings.
And then the 2007 crisis arrived.
Contributions to growth
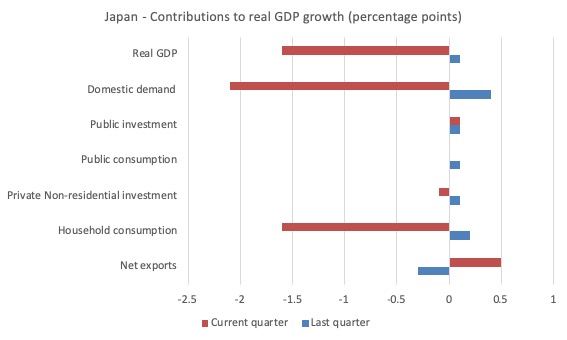
The next graph shows the contributions (in percentage points) to real GDP growth of the major expenditure categories in Japan for the September-quarter 2019 (denoted last quarter) and the December-quarter (denoted current quarter).
The major categories of expenditure that you would expect to be affected by the sales tax hike, either directly (private consumption) or indirectly (private investment) were negatively impacted.
You may wonder why net exports contributed positively to growth in the December-quarter. It was on the back of a zero contribution from exports but a slump in import spending (sales tax related), which, of course, means the external drain on growth reduces.
Consumer and Business Confidence
The Japanese Cabinet Office publishes a – Monthly survey of Consumer Confidence. The latest results, released on January 29, 2020 (for a survey conducted in January 15, 2020) tells us:
1. “The Consumer Confidence Index (seasonally adjusted series) in January 2020 was 39.1, the same as the previous month.”.
2. All components that influence the Consumer Perception Indices were positive:
Overall livelihood: 37.8 (down 0.6 from the previous month)
Income growth: 39.9 (down 0.3 from the previous month)
Employment: 41.8 (up 0.5 from the previous month)
Willingness to buy durable goods: 37.0 (up 0.4 from the previous month)
This suggests that the household spending will improve again after taking the sales tax hit.
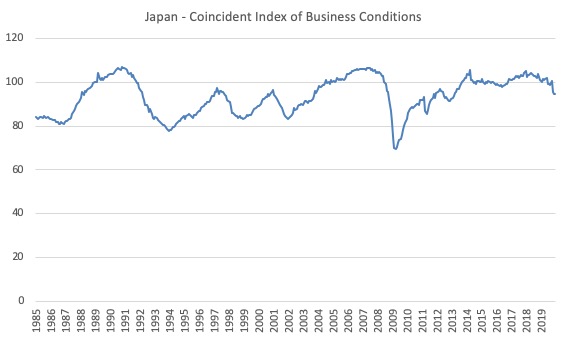
The Cabinet Office also publishes Monthly – Indexes of Business Conditions.
The latest result (February 7, 2020) showed that conditions were “Worsening” in December 2019.
The following graph is their latest time series (since January 1985) of their ‘Coincident Index’, which is explained in this document – Guide for Using Composite Indexes and Diffusion Indexes.
Basically, the “composite indexes mainly aim to measure the tempo and the magnitude (“the volume”) of economic fluctuations”. The “coincident index … coincides with the business cycle, and is used to identify the current state of the economy.”
An:
… increasing the coincident index reflects that the economy is in an expansion phase, and decreasing coincident index reflects that the economy is in a contraction phase. The magnitude of the changes in the coincident index reflects the tempo of the expansion or contraction phases.
There has been a sharp drop in the CI since September 2019 when it stood at 100.4. Then, after the sales tax hike, it fell to 95.3 (October), 94.7 (November) and 94.7 (December).
Conclusion
The latest Japanese National Accounts data continues to teach us lessons about monetary and fiscal policy.
We learn from the sales tax debacles and the most recent data that:
1. Fiscal policy works in both directions – trying to cut deficits when the economy is below full employment will reduce economic growth (and vice versa).
2. Monetary policy does little to stimulate real spending in a monetary economy and can not offset contractionary movements in fiscal policy. The Bank of Japan has been engaging in more quantitative easing and interest rates remain around zero – but there has so far been very little real GDP impact.
Current calendar
Today I am in Athens and later will be in Paris.
Upcoming events:
- Tuesday, February 18, 2020 – Paris, Reception, French Senat, Palace of Luxembourg – 18:00.
- Wednesday, February 19, 2020 – Presentation to the French Treasury, Closed event. 9:00 to 12:00. Afternoon – press interviews.
- Thursday, February 20, 2020 – Paris, Presentation to French Senate Commission, Palace of Luxembourg – 8:30-10:30.
- Thursday, February 20, 2020 – London, GIMMS presentation, MMT education – afternoon – Details.
- Friday, February 21, 2020 – Manchester, GIMMS presentation, The Harwood Room in the Barnes Wallis Building, University of Manchester, Details.
- Saturday, February 22, 2020 – MMTed Masterclass Workshop, London, for Details and Tickets. Limited spaces available.
- Sunday, February 23, 2020 – Amsterdam – private meetings.
I encourage you to support these public events in the UK:
1. February 20, 2020 – I will speaking in London about the recent political events in the UK and how an understanding of MMT is essential to rebuild a progressive political force in Britain. Criminologist Steve Hall will also talk and will focus on the current rise of populism in the West.
The event will be at the Unite the Union (Diskus Theatre) in central London and will run from 13:30 to 17:00.
For – Details.
2. February 21, 2020 – The same show moves to Manchester.
The event will be at the Barnes Wallis Building (The Harwood Room) at the University of Manchester and will run from 13:30 to 16:30.
For – Details.
3. February 22, 2020 – MMTed – with help from – GIMMS – will hold a three-hour MMT Masterclass in London between 14:00 and 17:00.
This is a teaching seminar exclusively and will suit those who want to build their understanding of macroeconomics from an MMT perspective.
For more details – MMT Masterclass, London.
There are still vacancies available.
That is enough for today!
(c) Copyright 2020 William Mitchell. All Rights Reserved.
1. Quarterly growth was down 1.61 per cent for the last three months of 2019. When the financial press report that Japan [s]lumped by an annualised 6.3 per cent, they do that to make the quarterly result look worse than what it actually is.
You need the ‘s’ I added.
This seems pretty straightforward. Did the tax rate hike create unemployment? Or was the primary effect just a slump in consumption that might eventually create unemployment if the tax rate hike remains in effect? Also, I wonder if there is a change in the savings rate caused by such a tax hike? Could they both be pro cyclical and magnify the negative effects of a tax hike?
If the Japanese authorities want to increase inflation (which they are said to want to do, are they not?), I wonder why they don’t simply reduce sales tax to zero.
I assume this is a decision that the government could take, independently of the independent (more so than most CB’s, as I understand it) Bank of Japan.
Mike: is it not that they believe they must reduce the national debt, and they think raising the sales tax will help achieve this?
Do you have the data to track what happened to government revenues during these periods? When taxes were cut in the U.S., adversaries claimed that tax revenues would fall; they didn’t. So, did tax revenues in Japan rise after they increased taxes? (I think I know the answer but I can’t find the data.)
Dear Tom Nugent (at 2020/02/22 at 6:09 pm)
You can find some data here – https://www.mof.go.jp/english/budget/statistics/201006/index.html
You will see that after the sales tax increases, overall tax revenue fell because of the recession the spending collapse caused.
In general, you can get data from the Cabinet Office site.
best wishes
bill