Today (March 6, 2024), the Australian Bureau of Statistics released the latest - Australian National…
Australian National Accounts – continued weakness and highly vulnerable to recession
We have had a long drought. Massive bushfires. Floods. And, now, the coronavirus to deal with. The latest release by the Australian Bureau of Statistics of the – December-quarter 2019 National Accounts data (March 4, 2020) – allows us to see some of the impacts of the bushfires, given it is a rear-vision view of where the economy was at in the last three months of 2019. The next quarter’s data (due early June) will start to tell us about the coronavirus effects. Today’s data confirms what we have been tracing for several quarters – the Australian economy is grinding to a halt with private business investment continuing to decline and only a falling household saving ratio keeping Household Consumption expenditure moving in the face of flat income growth. The data shows that annual GDP growth of 2.2 per cent remains well below the historical trend rate of between 3.25 and 3.5 per cent. The weaker performance started in the last 6 months of 2018 and has continued through 2019. Further, as the recent favourable terms of trade (as a result of the Brazilian environmental disaster) have reversed, Real net national disposable income is now falling, signifying falling material living standards. As a result of the falling terms of trade, exports have shrunk and will shrink further on the back of the virus impacts. In an environment where household debt is at record levels, the risks of unemployment are rising, wages growth remains stagnant, and business investment continues to contract – the recent negative shocks from fire, flood and now the virus expose the economy to a major contraction. The overall picture is not good and the future is looking rather dim at present. An urgent and major shift in fiscal policy towards expansion is definitely required.
The main features of the National Accounts release for the December-quarter 2019 were (seasonally adjusted):
- Real GDP increased by 0.5 per cent for the quarter – signalling continued weakness. The annual growth rate was 2.2 per cent, well below historical trend of between 3.25 and 3.5 per cent.
- Real GDP per capita growth was 0.2 per cent.
- The main positive contributors to real GDP growth was Household Consumption (0.2 points), Inventory accumulation (0.2 points), Government consumption (0.1 points) and Net exports (0.1 points).
- The main negative contributor was Private Capital Formation (0.2 points).
- Australia’s Terms of Trade (seasonally adjusted) fell by 5.3 per cent in the quarter and 0.6 per cent over the 12 month period.
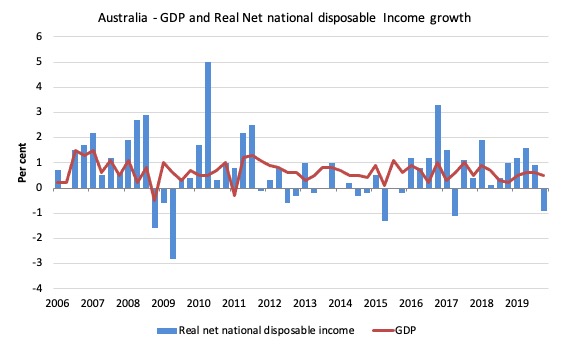
- Real net national disposable income, which is a broader measure of change in national economic well-being fell by 0.9 per cent for the quarter but rose by 2.7 per cent for the 12 months to the December-quarter 2019, which means that Australians are better off (on average) than they were at that point 12 months ago, but worse off than they were in the September-quarter. These swings are being driven by the fluctuating terms of trade – the usual story for Australia.
- The Household saving ratio (from disposable income) fell by 1.2 per cent to 3.6 per cent. The saving ratio is still well below the levels that were observed following the GFC.
Overall growth picture poor
The ABS – Press Release – said that:
The Australian economy grew 0.5 per cent in seasonally adjusted chain volume terms in the December quarter 2019 and 2.2 per cent through the year
… the rate of growth remains below the long run average.”
Domestic demand remained subdued with 0.1 per cent growth in the December quarter. A pick up in household discretionary spending and continued increases in the provision of government services was dampened by falls in dwelling and private business investment …
Falling prices for key export commodities impacted the terms of trade in the December quarter, which fell 5.3 per cent …
Real net national disposable income declined 0.9 per cent. “Fluctuations in commodity prices have significant effects on the Australian economy in terms of export revenues and real income,
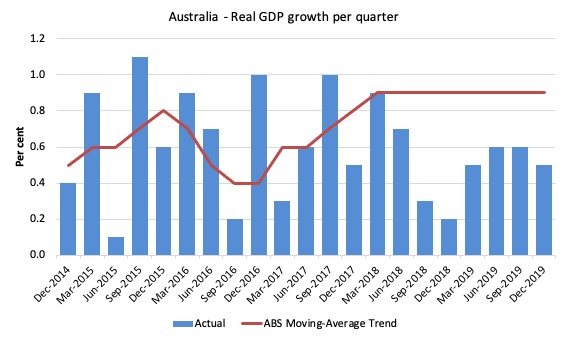
The first graph shows the quarterly growth over the last five years (with the red line being the ABS moving average trend). The trend growth is now flat.
I predict the trend will start pointing downwards as the coronavirus impact starts moving into the data.
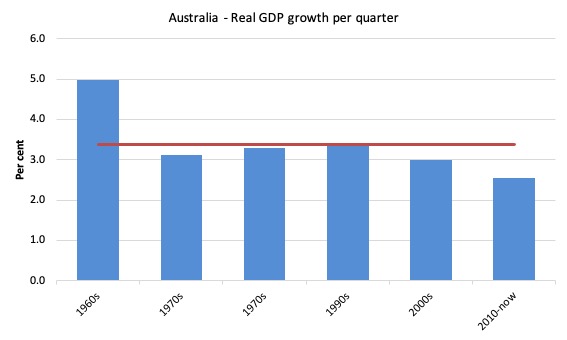
To put this into historical context, the next graph shows the decade average annual real GDP growth rate since the 1960s (the horizontal red line is the average for the entire period (3.4 per cent) from the March-quarter 1960 to the December-quarter 2019).
It is easy to see how far below historical trends the growth performance of the last 2 decades have been as the fiscal surplus obsession has intensified on both sides of politics.
Even with a massive household credit binge and a one-in-a-hundred-years mining boom that was pushed by stratospheric movements in our terms of trade, our real GDP growth has declined substantially below the long-term performance.
And it is not that we are eschewing material aspirations in favour of climate action. Our carbon emissions continue to rise as well.
Analysis of Expenditure Components
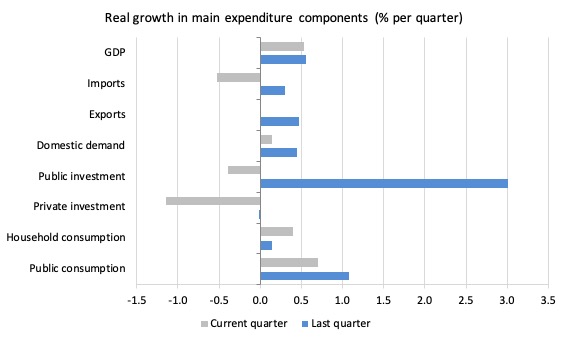
The following graph shows the quarterly percentage growth for the major expenditure components in real terms for the December-quarter 2019 (grey bars) and the June-quarter 2018 (blue bars).
Points to note:
1. The overall growth performance is being driven by the strength of Household Consumption (as the Saving ratio declines again) and Export expenditures.
2. The decline in Import expenditure (-0.53 per cent) is a sign of weakness.
3. Private investment expenditure growth declined by 1.15 per cent for the quarter. It has declined every quarter since the March-quarter 2018. It declined by 3.4 per cent over the 12 months.
4. Household consumption expenditure growth was steady over the year by increased over the quarter from 0.14 per cent to 0.4 per cent. Overall, it remains subdued compared to recent years.
5. The growth in exports has virtually ended (0.01 per cent) as the terms of trade decline. I predicted that the recent surge in exports driven by the impact of the environmental problems in Brazil would not be long-lived. The coronavirus will also impact severely in the coming quarter – particularly in terms of tourism and foreign student income.
6. Public investment decline by 0.4 per cent for the quarter as the big public infrastructure projects (State government – large transport projects mainly) start to reach fruition.
Contributions to growth
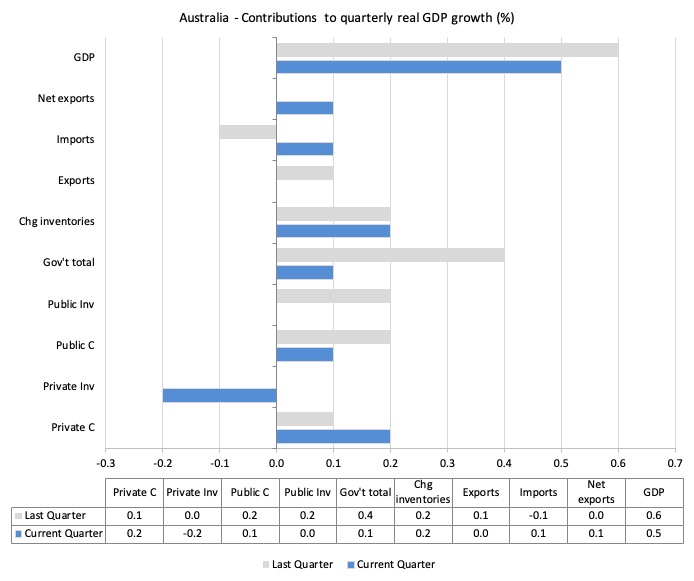
What components of expenditure added to and subtracted from the 0.4 per cent real GDP growth in the December-quarter 2019?
The following bar graph shows the contributions to real GDP growth (in percentage points) for the main expenditure categories. It compares the December-quarter 2019 contributions (blue bars) with the June-quarter 2018 (gray bars).
In order of contribution:
1. Household consumption expenditure contributed 0.2 points to the overall growth result – a relatively weak but stable result.
2. Growth in inventories contributed 0.2 points. This is related to firms stockpiling.
3. Net exports added 0.1 percentage points driven by falling imports.
4. Public consumption contributed 0.1 points. Overall, the government sector contributed 0.1 points (given the zero contribution from public capital formation).
5. Private investment expenditure undermined growth by 0.2 points (negative 0.2 points last quarter).
Material living standards fall in December-quarter 2019
The ABS tell us that:
A broader measure of change in national economic well-being is Real net national disposable income. This measure adjusts the volume measure of GDP for the Terms of trade effect, Real net incomes from overseas and Consumption of fixed capital.
While real GDP growth (that is, total output produced in volume terms) grew by 0.5 per cent in the December-quarter 2019, real net national disposable income growth fell by 0.9 per cent.
Over the 12 months to the December-quarter 2019, Real net national disposable income grew by 2.7 per cent, which means that Australians were better off (on average) in real income terms than they were twelve months prior but poorer than they were in the September-quarter.
This is mostly due to the terms of trade effect rather than domestic demand growth.
The following graph shows the evolution of the quarterly growth rates for the two series since the December-quarter 2006.
Household saving ratio rises – as households save the tax cuts
The saving ratio fell by 1.2 per cent to 3.6 per cent.
Ultimately, the credit-fuelled and draw down on saving cannot be sustained. The impacts of the coronavirus (lost income) will clearly exacerbate the tension households have been facing with flat income growth for several years.
So it will be recession or the government will dramatically shift its policy mentality.
The following graph shows the household saving ratio (% of disposable income) from the December-quarter 1960 to the current period.
In the December-quarter 2008, the ratio was 10.9 per cent having risen sharply in the early days of the GFC as households tried to stabilise the record debt situation.
Once the GFC threat was contained by the massive fiscal stimulus, the saving ratio began to fall again, especially as the squeeze on wages has intensified.
In the December-quarter 2016, the household saving ratio was 5.5 per cent (still much lower than historical norms).
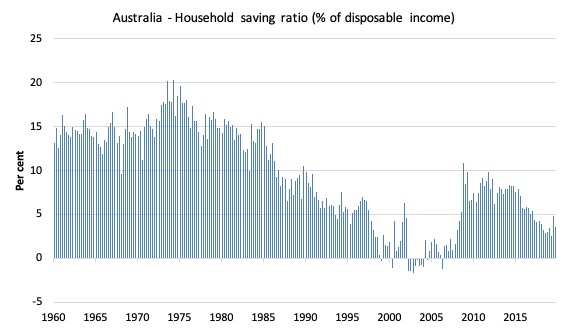
The following table shows the impact of the neoliberal era on household saving. These patterns are replicated around the world and expose our economies to the threat of financial crises much more than in pre-neoliberal decades.
| Period | Average Household Saving Ratio (% of disposable income) |
| 1960s | 14.3 |
| 1970s | 16.1 |
| 1980s | 12.0 |
| 1990s | 5.4 |
| 2000s | 2.2 |
| 2010- | 6.4 |
Real GDP growth and hours worked
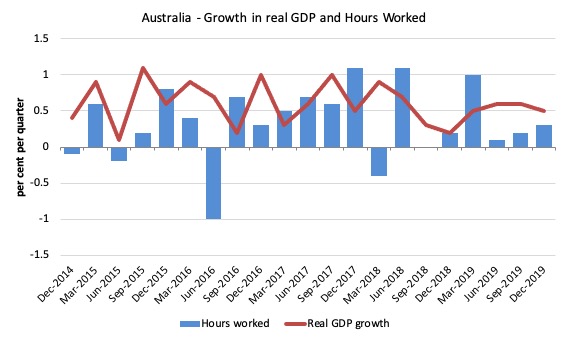
The following graph presents quarterly growth rates in real GDP and hours worked using the National Accounts data for the last five years to the December-quarter 2019.
You can see the dislocation between the two measures over the period to mid-2016 (it actually began in 2011). In other words, GDP was growing while hours worked growth was variable but often zero or negative.
From then until the December-quarter 2018, the two series moved more or less together, despite the blip in the December-quarter 2018.
But the December-quarter data shows that growth in total hours worked lagged behind GDP growth, which means that productivity growth rose quite strongly (0.4 per cent).
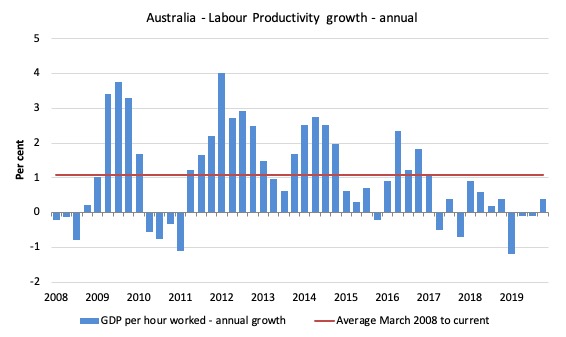
To see the above graph from a different perspective, the next graph shows the annual growth in GDP per hour worked (labour productivity) from the December-quarter 2008 quarter to the December-quarter 2019. The horizontal red line is the average annual growth since December-quarter 2008, which itself is an understated measure of the long-term trend growth of around 1.5 per cent per annum.
The relatively strong growth in labour productivity in 2012 and the mostly above average growth in 2013 and 2014 helps explain why employment growth was lagging given the real GDP growth. Growth in labour productivity means that for each output level less labour is required.
In the December-quarter 2019, annual labour productivity growth rose by 0.4 per cent.
Conclusion
Remember that the National Accounts data is three months old – a rear-vision view – of what has passed and to use it to predict future trends is not straightforward.
Economic growth remains weak in Australia and I expect it will weaken further, and probably go into a recessed state unless there is a major shift in macroeconomic policy.
I will write separately about the impact of the coronavirus and how government can offset those impacts.
But the interest rate cut yesterday will do nothing much. A large fiscal stimulus is required with significant cash payments to those losing income.
I doubt the Federal government will be able to do that. It will offer some stimulus soon but probably not enough.
The Australian economy is being hit with cumulative effects of drought, bushfires, floods and now the virus. That is not the time to be pursuing a fiscal surplus.
Combining all the signals, the conclusion is that the Australian economy is stagnating and in danger of fall off a cliff.
The National Accounts data indicates that the Australian economy continued to perform poorly in the December-quarter, a trend that has now persisted for the last 12 months.
Annual growth is just 2.2 per cent well below the historical trend rate of between 3.25 and 3.5 per cent.
The weakness is exemplified by slackness in private domestic demand – weak household consumption growth and negative business investment growth.
The continuing contraction in business investment will also undermine potential GDP growth, locking the economy into a high labour underutilisation state.
The contribution of Net exports was positive but only because import expenditure fell sharply – another sign of weakness.
Overall, the Australian growth outlook remains poor.
A major shift in fiscal policy towards expansion is definitely required – now and big.
That is enough for today!
(c) Copyright 2020 William Mitchell. All Rights Reserved.
I will be interested to see what Bill writes regarding dealing with any economic fallout from the coronavirus situation.
While expansionary fiscal policy should be the number one tool for dealing with most economic shocks – could it possibly be less effective in this particular case?
Giving people money to spend and launching major public projects was effective in the wake of the 2008 collapse but when supply chains grind to a halt on quarantine measures and people are afraid to leave their homes except when absolutely necessary and unavoidable, I’m not sure whether regular stimulus could be nearly as effective.
Government could certainly assist the economy in the aftermath, when fear has subsided and people and goods are moving freely again – exactly what they might effectively do between now and them I’m not certain.
And what is it with supermarkets running out of toilet paper – which end do people think the virus affects?
I’m looking forward to the post on the corona virus impacts and what we can do about it also. I actually wrote President Trump an email about what I thought our country should do and have been the subject of quite frequent replies from the White House or their computers since then.
Actually, it seems that for whatever probably unrelated reason the government here is doing most of what I asked for. The government announced that there will be billions of $ for state governments to spend in order to deal with it. And that the Feds will be spending also. They announced that they were willing to assist other more seriously affected countries (like Iran) despite our political disagreements which lets me be proud of my country at least a little. Not sure exactly how we could help but maybe we can. They inform me they are working with our top pharmaceutical companies to develop a vaccine and treatments for sick people. No word yet about compensating people who are sick but have to go to work when they should stay home because we mostly don’t have sick days here in US though. And Trump complained about the Federal Reserve so much that they actually cut their interest rates- not that I have any idea if that is useful or not in this situation. Plus I seem to get constant updates from the White House about it all which probably helps to keep me from going out and catching the thing or spreading it if I did.
I wonder what else I should have asked them to do, seeing that they seem to have listened to me so far…
Oh latest White House update- President Trump has announced he is donating his presidential salary to “aid the coronavirus response”. Well we MMT types know that the US federal government doesn’t need his money so it is symbolic at best- but maybe symbolism can be important at times.
“Oh latest White House update- President Trump has announced he is donating his presidential salary to “aid the coronavirus response”.
He’ll just claim it as a tax-deductiion – assuming he pays any tax of course, which must be highly doubtful.
What is relevant in my opinion is halting the panic engulfing the society (the panic spreading with the little help of conspiracy theorists paid 85 roubles per comment). This ridiculous thing about buying toilet paper here in Sydney clearly demonstrates how the emergence of bad virus can cause a “catastrophe” in the social media space, even if the overwhelming majority of people will only ever experience mild symptoms and we are weeks or even months away from the peak of the epidemics here in Australia.
The economic and social effects of the panic are far worse than the epidemics itself. Putting the whole country in a lockdown like China (which has worked) is not an option in non-authoritarian countries so we have to accept that the spread of coronavirus is inevitable. I don’t know what means of controlling the spread of stupidity the American administration has. Perhaps the law should be changed to finally make Facebook, Instagram and Twitter legally liable for some content hosted on their sites, regardless of who posted it, at least in the name of state security. If someone wants to smear a celebrity, this does not matter. If someone encourages people to do silly things, this person is an enemy of the society and the medium spreading this stuff is a platform of mass propaganda warfare. During the crisis caused by the killing of the leading Iranian terrorist in January, Twitter was overwhelmed with a flood of messages sent by pro-Iranian-regime entities. This is an example of asymmetric warfare at its best. Be prepared for foreign entities and local extremists sowing racial discord in the US, blaming certain ethnic groups for spreading the virus, advocating miraculous cure which only makes things worse, etc. There must be a way to simply switch it off.
The second issue is preparing a targeted fiscal response. For example, if people are quarantined, they should be given relief money so that they should not worry about the losses. If a company has to halt its operations, or an individual stop working, they should be able to postpone repaying debt and do not accrue more during the period of the epidemics. If things got worse, a bank holiday may need to be declared. Some companies such as airlines or tourist operators should be allocated a targeted stimulus. When the epidemics passes, the country should be back on its feet, ready for “business as usual” not having to deal with a wave of bankruptcies, etc.
For a certain, possibly brief period of time, illegal migrants should not be targeted otherwise they will not cooperate. People visiting coronavirus centres (providing basic treatment, possibly run by the military of civil defence) should not be charged for treatment. Again this is not “Medicare for All” type policy, this is just pure pragmatism to slow down the spread of virus and reduce the number of people simultaneously experiencing symptoms requiring hospitalisation. This is a matter of national security. Obviously if someone wants better treatment, the current privately-operated system is still available and there is no competition between the mass coronavirus clinics and the mainstream system.
The US (and Australia) are lucky in the sense that we can observe the spread of this particular virus in multiple countries and the exact scenario is known in advance. Apparently in Iran they still haven’t reached the peak. The spread in Italy is also only accelerating. The response in the US can be planned and prepared in advance, now is the time to prepare at the federal, state and local levels but stay calm and quiet so that the foreign enemies in the propaganda war won’t use the preparations as an opportunity to attack the state by sowing more panic. Also – the specialists need to monitor the evolution of the virus and the emergence of less lethal strains. Possibly the bio-weapon specialists may determine that if there is a particular strain which is not worse than a normal flu, perhaps this strain should be used to perform “backburning” or at least not discouraged to spread. This is how Spanish Flu ended as a lethal strain (far worse than the current virus). It just evolved into a normal flu while enough people developed immunity.
At the same time, elderly people should be isolated and looked after by locally managed teams of volunteers organised by civil defence.
If the current administration passes this test the chances of Joe Biden getting elected are zero. And in my view, Joe Biden would mean the end of America as a great power and the end of dominance of Western civilisation. If the current administration screws it up, the Chinese are the long-run winners as they only halted their long march for a few months to deal with the virus and are already emerging virtually unscathed.
Adam K- I’m not panicking about anything- I’m concerned about it and interested in an opinion about economic consequences and policies that might address them. I don’t have facebook, twitter, or Instagram so they have not at all influenced my level of concern about this. I get my information about the spread of the outbreak from a respected fairly noncontroversial source at Johns Hopkins University and obviously from fairly standard news sources about measures the Chinese government, and now the Italian government, has implemented and the effects on production and trade so far. Hadn’t heard about the toilet paper shortages in Australia until Lefty said so. Seems like a relatively minor issue in the greater scheme of things. Actually maybe that is how the US could help Iran- sending bombers to drop rolls of toilet paper – we are pretty good at dropping bombs- I’m sure we could manage toilet tissue. I remember Donald Trump himself distributing rolls of paper towels to relieve the suffering of Puerto Rico after a terrible hurricane closer to home. Send a note to the White House if you want some B-52’s to distribute toilet paper in Australia. A ship would probably make more sense – but it wouldn’t nearly be as fun to watch 🙂