Today (April 18, 2024), the Australian Bureau of Statistics released the latest - Labour Force,…
Latest employment data for Australia exposes Federal government’s wilful neglect
I reported in this blog post – Policy failure – Australian unemployment rate probably already around 10.9 per cent (April, 2020) – that the The Australian Bureau of Statistics has started publishing weekly employment data on a two-week cycle. The data is drawn from a new series made available as a result of the Single Touch Payroll data provided by the Australian Tax Office and provides researchers like me with much more timely data than the monthly labour force survey. The latest edition came out today (May 5, 2020) – Weekly Payroll Jobs and Wages in Australia, Week ending 18 April 2020 – which covers the new data from April 4, 2020. The results are shocking. The conclusion from my analysis of the latest available data is that some sectors in the Australian labour market have experienced a sudden and catastrophic contraction – like nothing we have ever seen in the data. Both employment losses and major wage losses are underway and the policy response is totally inadequate for the task. A much larger fiscal intervention is required and it has to be directed at workers rather than firms and support direct job creation.
Relevant blog posts as I trace the data trail over time are:
1. “We need the state to bail out the entire nation” (March 26, 2020).
2. The government should pay the workers 100 per cent, not rely on wage subsidies (March 30, 2020).
3. A Job Guarantee would require $A26.5 billion net to reduce the unemployment rate by 6 percentage points (April 30, 2020).
In terms of the coverage of the ATO Single Touch Payroll data, the ABS report that:
Approximately 99% of substantial employers (those with 20 or more employees) and 71% of small employers (19 or less employees) are currently reporting through Single Touch Payroll.
Jobs collapse in Australia continues
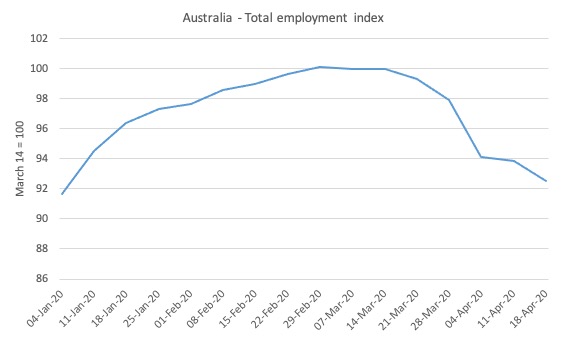
Here is what has happened to total employment in Australia since January 4, 2020 (the ATO data starts at the beginning of the year). The index is based at 100 on March 14, 2020 which appears to be around the peak employment, although it was slowing since February 29, 2020.
Overall, there has been a 7.5 per cent contraction between March 21, 2020 and April 18, 2020.
While the pattern was almost identical for males and females up to April 11, 2020, in the last week of the data, the percentage contraction in female employment has intensified.
Between March 21, 2020 and April 18, 2020, male employment has fallen by 6.2 per cent and female employment by 8.1 per cent
So the crisis is now impacting disproportionately on females.
What does this imply?
We can do some ‘back-of-the-envelope’ calculations with some assumptions to see what this might imply.
- The Labour Force survey is usually completed by the 11th day of each month.
- If you take the national data and assume that total employment has contracted by 7.5 per cent in the month since the last survey (noting that the ATO payroll data is not a full sample and the dates of the two datasets – ATO and Labour Force – do not exactly align), then by April 18, 2020 (around 5 weeks after the last labour force survey was taken), total employment would have fallen by 976.3 thousand (net) jobs.
- If there was no change in the participation rate over that time (assumption – but in all likelihood it will plunge), then unemployment would have more more than doubled from 718.6 thousand in the March data to an estimated 1,694.9 thousand by April 18, 2020 – an increase of nearly a million.
- Again, assuming the labour force is unchanged in that period, the unemployment rate would have risen to 12.3 per cent (up from the official March figure of 5.2 per cent)
Given that “not all jobs in the Australian labour market are captured within these estimates”, the ABS urges caution in extrapolating them in the way I have above. But, I also emphasise that my calculations are not to be interpreted as being exact statements.
They are just ball park figures.
The ABS has specifically qualified the results by saying:
For context, high level analysis suggests that there was approximately 650,000-700,000 fewer paid employee jobs in STP-enabled businesses between 14 March and 18 April 2020.
They also note that “Owner managers of unincorporated enterprises are not included in the estimates”, which means that the employment losses are an understatement of what is actually happening.
Which means that the unemployment rate would be around 10.3 per cent if we take the upper bound of that range and assume the labour force is unchanged.
In fact, what will happen is that the participation rate will fall and the unemployment will become ‘hidden’ outside the official measured labour force.
Whatever the actual result (and we will get a better idea next week when the Labour Force survey data is published), the trends are shocking.
They represent the definition of policy failure.
It represents a staggering shift in a five week period and a sign that the Australian government’s fiscal intervention is less than half as much as it needs to be.
In this blog post – A Job Guarantee would require $A26.5 billion net to reduce the unemployment rate by 6 percentage points (April 30, 2020) – I used additional data provided by the Department of Social Services to the – Australian Senate Select Committee on COVID-19.
That data covered the rise in recipients of unemployment benefits in Australia between March 16, 2020 and April 27, 2020.
Using that data, I estimated that the unemployment rate would be around 12.5 per cent.
So you can see that the two datasets provide a convergence on the likely underlying unemployment rate.
In reference to the 1992 recession, the Treasurer told the press yesterday that:
In the current coronavirus, it is expected the unemployment rate will go up by around 5 per cent in three months, let alone three years.
Well it has already gone up by that in a few weeks!
The Treasurer also said that the Treasury is estimating the economy will decline by 10 per cent in the June quarter 2020.
Based on analysis of previous recessions, this Table helps us understand the relationship between GDP growth and changes in the official unemployment rate.
| Period | GDP contraction (peak to trough) % | Increase in UR to peak (points) |
| September 1981 to June 1983 | -3.71 | 4.69 |
| June 1990 to June 1991 | -1.43 | 4.71 |
From that Table, we derive a rough rule of thumb that:
For every 1 per cent that GDP contracts, the unemployment rate rises by 2.5 percentage points, which given the current labour force would add 304 thousand workers to the unemployment queue.
There are cyclical effects on participation etc that are not included in these types of estimates but they still help ground us in reality.
So if the economy is going to shrink by 10 per cent, then we haven’t gone close to the rise in unemployment yet! A horrifying medium-term future is upon the nation.
1. In the 1982 recession, total employment fell by 3.4 per cent from its peak in April 1982 to its trough in April 1983 – which was considered a devastating contraction.
It returned to its pre-recession peak in April 1984. So peak-trough-back to previous peak took 2 full years.
2. In the 1991 recession, considered the worst since the Great Depression, total employment fell by 4.0 per cent from its peak in July 1990 to its trough in February 1993.
It wasn’t until July 1994, that it returned to its pre-crisis peak – a full 49 months or over 4 years.
3. Derived from data provided by – Source papers in economic history – allows us to see what happened during the Great Depression.
The data is annual and employment in Australia peaked in 1930. By 1932, it had contracted by 9.7 per cent before exceeding the previous peak sometime in 1935.
We are staring at a situation now that looks like being up there with the Great Depression, although the main difference is that much of the employment lost is due to lockdown restrictions rather than a spending growth collapse.
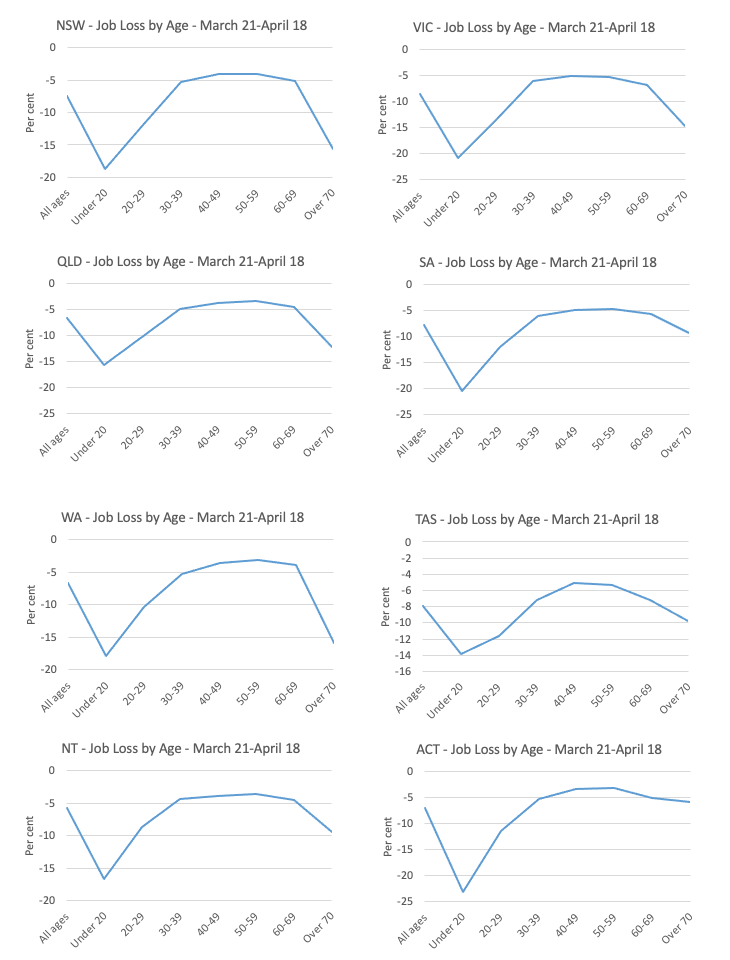
Age breakdown
At the national level, no age breakdowns are provided.
But these are provided at the state/territory level and the following sequence of graphs gives the age profiles of the job loss for each region.
It is clear that our youth are bearing the brunt of the crisis, largely due to the industrial composition of the job losses – services, accommodation etc.
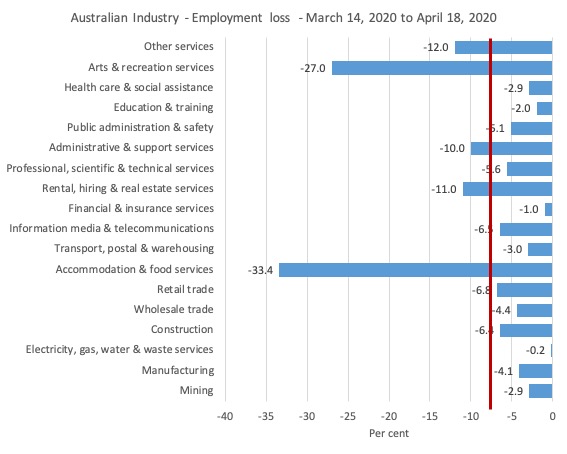
Industry breakdown
The following graph shows the percentage decline in employment between March 21, 2020 and April 18, 2020 for the Australian industry sectors.
The red line is the national average loss (7.5 per cent).
As expected the worst hit sectors are Accommodation & food services (decline of 33.4 per cent) and Arts & recreation services (decline of 27 per cent).
Other sectors that deal face-to-face with people are also affected (Other services, 12 per cent; Rental, hiring and real estate services, 11 per cent).
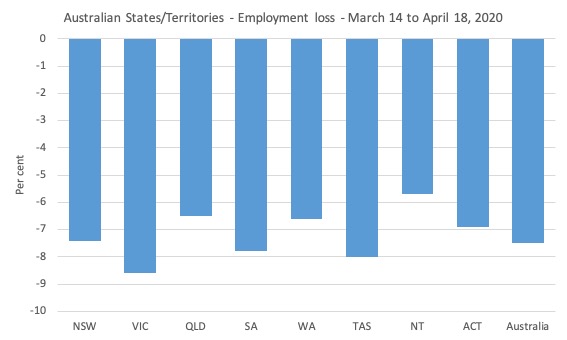
State breakdown
The spatial pattern is shown in the following graph.
Above-national average employment losses between March 21, 2020 and April 18, 2020 have been recorded in:
- Victoria -8.6 per cent
- South Australia -7.8 per cent
- Tasmania -8 per cent
The small island state of Tasmania has had a severe concentrated outbreak of the coronavirus while Victoria is enduring a concentration related to a single workplace.
Wages paid are also plunging
Last time I analysed this dataset, I didn’t have time to also consider the wage impacts.
The news is predictable given the scale of the crisis.
The ABS report that between March 14, 2020 and April 18, 2020:
1. “total wages paid by employers decreased by 8.2%”.
2. “Total wages paid decreased by 1.0%, compared to a decrease of 1.6% in the previous week.”
3. “Total wages: Tasmania decreased by 9.3%, and Victoria and the Northern Territory both decreased by 9.2%”.
4. “payments to people aged 20-29 decreased by 10.3%”.
5. “Accommodation and food services decreased by 30.3% and Arts and recreation services decreased by 17.3%”.
So not only is employment plunging across the board (and particularly in certain sectors), but the overall wages bill is collapsing.
In the December-quarter 2019, total wages and salaries of employees was $A212,320 million or around 42 per cent of GDP.
As a rough rule of thumb (noting my qualifications above to extrapolating the ATO data), an 8.2 per cent fall in wages paid would amount to $A17,410 million or around 3.5 per cent of GDP.
The Australian government could easily guarantee the wages of all workers and avoid this deflationary outcome of its lockdown rules.
That remains my firm recommendation.
The new narrative – high unemployment for as far as we can see
The RBA Board, today, maintained the interest rate at 0.25 per cent and extended their bond-buying behaviour to encompass corporate debt (going down to BBB- rated instruments).
It most recent forecasts, mentioned in – Statement by Philip Lowe, Governor: Monetary Policy Decision (May 5, 2020) – the RBA said:
In the baseline scenario considered by the Board, the unemployment rate peaks at around 10 per cent over coming months and is still above 7 per cent at the end of next year.
So at the end of 2021, the RBA is predicting that at least 275 thousand workers more will be unemployed than were jobless as the crisis unfolded.
And at that point, there were already over 400 thousand workers, under my definition of full employment, that were languishing in unemployment as a result of the Federal governments obsessive pursuit of a fiscal surplus.
It beggars belief that policy makers would allow the jobless rate to slowly decline in this way, accumulating the massive income and personal losses along the way.
If the RBA projections are correct and the labour force grows at its average medium-term rate over the period to the end of 2021, then there will still be 998.5 thousand workers unemployed at that point.
Only 254 thousand jobs would have been added between February 2020 and December 2021, an average monthly increment of only 13 thousand – a pitiful outlook.
And I haven’t even factored in what will happen to underemployment – noting that the broad underutilisation rate was already 14 per cent as the nation entered the crisis.
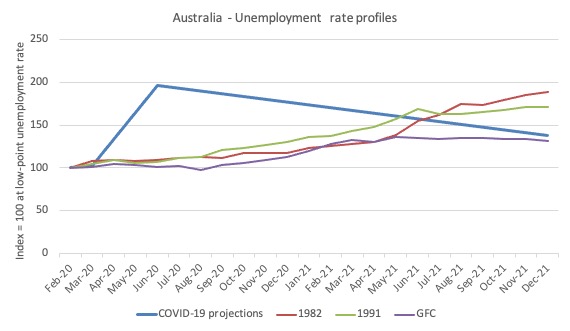
To put this in perspective, I took the RBA projections on face value and produced this graph. It is based on a constant labour force growth rate over the period shown and the peak and end-of-2021 unemployment rates of 10 and 7 per cent, respectively.
The blue line is the unemployment rate profile implied.
The other lines are the monthly behaviour of the unemployment rate in the 1982, 1991 and GFC cyclical events. They are indexed to 100 at the low-point unemployment rate for each cycle.
I have superimposed the earlier episodes onto the current calendar for comparative purposes.
The current crisis delivers much greater losses in terms of foregone income and personal tragedies than those past recessions (although the GFC wasn’t strictly a recession for Australia.)
And in 2022, how quickly will the unemployment rate fall below the projected 7 per cent?
The point is that the media are already settling into this narrative – that things will be like this for the next 18 or more months.
It is a totally unnecessary narrative.
If the Federal government was using its currency-issuing capacity responsibly there would be no reason for unemployment to rise at all.
That’s right – no reason for the unemployment rate to rise at all.
The Federal government could offer a job to all workers unable to work or find work elsewhere.
In other words, the profile shown by the blue line (the RBA projections) is a political choice.
And the Government should be dammed for making that choice.
Conclusion
While the Federal government has certainly shifted its policy tune in the last 6 weeks after scorching the economy for some years as it obsessively pursued a totally inappropriate fiscal surplus, the evidence is clear – its current intervention is wrongly crafted and in absolute quantum way below what is necessary.
They are fostering the narrative that unemployment has to remain at elevated levels for the next two years to absolve themselves of the blame.
The reality is that they choose the unemployment rate and could do something about the massive spike in joblessness tomorrow if it so chose.
That is enough for today!
(c) Copyright 2020 William Mitchell. All Rights Reserved.
You repeated this quotation. “For context, high level analysis suggests that there was approximately 650,000-700,000 fewer paid employee jobs in STP-enabled businesses between 14 March and 18 April 2020.” Did I miss something?
In the commentary on yesterday’s post, Neil responded to my latest histrionic appeal with the calm rejoinder that “Covid19 has turned out to be a fizzer; the economic shutdown will be relatively short-lived, so governments will be able to return to business as usual, financed by debt owed to private interests…..albeit with increased public austerity.” Today’s post by Bill on the Australian situation (and things are much worse in The States and elsewhere, as Bill’s recent posts have pointed out) indicates that business as usual will not be so easy to return to, may in fact have already evaporated. In Bill’s own words: “The conclusion from my analysis of the latest available data is that some sectors in the Australian labour market have experienced a sudden and catastrophic contraction – LIKE NOTHING WE HAVE EVER SEEN IN THE DATA (my caps).” Truly, we find ourselves in turbulent, uncharted waters, churning with peril and, I will continue to assert in my histrionic way, PROMISE…if we can collectively summon the best in us to seize it.
Newton,
My local ABC public radio are seemingly frightened to discuss MMT. Imagine that….when I explained that treasury could fund the bills of laid-off workers by direct payment to bank accounts, without implications for inflation, the rejoinder was “it’s never going to happen.”
Amazing. No interest al all in thinking outside the box.
Newton: That’s why I said covid 19 is a fizzer.
We need a pandemic capable of forcing a shutdown of the *non essential* economy – with 50% unemployment – for 12 months at least…that’s seems to be the only way the general public will wake up to the fact that government can pay the bills of unemployed workers, for as long as is necessary.
No Neil. The government can not replace 50 % of the work that gets done just by paying for it to not get done. No. We do not need something that is terrible in order to educate people. No. Think about it for a minute.
Jerry, I am thinking about it.
1. Note the censorship on the ABC, a piece of which I ‘own’.
2. Of course the government can support the economy for a long as is necessary, with only 50% of the workforce engaged. Food production and distribution – say 30% of the workforce. Utilities another other 20%. Accommodation already in sufficient supply to house the entire population.
What’s your problem?
Neil, it’s like this. About 63% of the population of the USA was part of the ‘workforce’ in some manner. Cut that in half to 32% of people providing for everyone? Maybe it can be done, but there will be very bitter disputes between those who are providing by working and those who are just not.
The government cannot supply the economy with goods and services all by itself.
Jerry,
Sorry, I had Australia in mind; stay at home and survive, and let the government pay citizens’ expenses until we have a vaccine….my 50% of the workforce is only a guestimate. Maybe the government could toss me some sweeteners if my services were essential, to avoid disputes during the shutdown.
What’s happening in America? Is there a deadlier form of the virus in New York?
I notice Trump is keen to unlock the economy, even though covid19 may not have peaked yet, in the US. And money is not getting to people on time, to pay for rent, food and utilities, apparently.
The interchange between Neil and Jerry seems to be focused on whether the current pandemic is a serious enough blow to the neoliberal system to create a genuine opportunity to end it and replace it with something more humane and ecological. Thus the difference between them, and between Neil and me, is a matter of judgment, as Schweitzer calls it, in contrast to a matter of will. Don’t almost all of us on this blog want a better, more beautiful world than that of the neoliberal gerbil wheel, which grinds the marginalized and the natural environment as we frantically spin it? Only time will tell whether this sudden freezing of the neoliberal economy, which like some sharks must swim to breath, will have been been long enough to threaten its existence.
Neil Halliday, I have no idea about different strains of the virus. New York City was hit hard. My state which is, in part, a commuter zone for NYC is getting hit hard also. New Jersey – same thing.
Bad as things are, and bad as our government may be, Americans are not always idiotic. As far as I know, in Connecticut you cannot legally be evicted from your residence during this crisis for not paying the rent or mortgage. And utilities are not going to shut off service for not paying either. But there seems to be no plan for what happens to the missed rent payments and utility bills if and when we get through this. That is all up in the air as to how that gets settled. People get food here- no one in Connecticut has died from lack of food in many years. Which is not the same thing as saying everyone has a healthy daily diet.
It’s actually all up in the air right now and I have no clue what it going to land on.
Jerry, There is actually a Guardian article noting that water is being shut off for non-payment of rates in America.
“It’s as if nobody cares”, said Mr. Haynes; “I always pay my bills on time, but when I asked for an extension of time (while I am unemployed (because of covid-19 shutdown) , they said no”.
Neoliberalism……
Neil, I didn’t say we weren’t idiotic- I just said we weren’t always idiotic. I tracked down your Guardian article- it is about a family in Tennessee. And their particular water company. It was a poor article from the Guardian. It is not characteristic of publicly regulated utilities in the US.
The US is a big country with lots of different ways of doing things. Including how people get water. That article does not describe typical as far as I can tell.
Newton Finn: Wednesday, May 6, 2020 at 22:40
Thanks for your *beautifully expressed summation* of the issues surrounding the capacity of Covid-19 to threaten neoliberal orthodoxy.