Today (April 18, 2024), the Australian Bureau of Statistics released the latest - Labour Force,…
Worst is over for Australian workers but a long tail of woe is likely due to policy failure
Today (June 16, 2020), the Australian Bureau of Statistics released their latest weekly employment data taken from Australian Tax Office data. They have slowed the release cycle on this data (for reasons they have not disclosed), so it is a month since I have analysed it. The latest edition came out today – Weekly Payroll Jobs and Wages in Australia, Week ending 30 May 2020 – which covers the new data from May 2, 2020 to May 30, 2020. The monthly labour force data to be released on Thursday covers a period that ends around May 12, 2020, so today’s data provides a more recent snapshot of the state of affairs. At the beginning of May, the data was suggesting that the worst of the job losses were over. The severity of the lockdown has eased a little since then, although the pattern of easing has been quite different across the states and territories. So we might have expected some variations to arise from that. And today’s data shows just that. In the Accommodation and food services sector, where some easing has occurred, jobs are returning, albeit at a slow rate. But in the Arts and recreation services sector, where little change in lockdown restrictions has occurred to date, there has been very little employment growth. The question is how many businesses will go to the wall before we get a more usual scale of operation and interaction. My prediction is that many will disappear and so the recovery in employment will be protracted given how many jobs have been lost to date. A much larger fiscal intervention is required and it has to be directed at workers rather than firms and support direct job creation. The problem now is that the Government is starting to reassert its neoliberal ideology and withdrawing the inadequate stimulus far too early. The future is not looking good. We might be virus free but there will be massive unemployment remaining into the distant future.
Relevant blog posts as I trace this data trail over time are:
1. “We need the state to bail out the entire nation” (March 26, 2020).
2. The government should pay the workers 100 per cent, not rely on wage subsidies (March 30, 2020).
3. A Job Guarantee would require $A26.5 billion net to reduce the unemployment rate by 6 percentage points (April 30, 2020).
4. Latest employment data for Australia exposes Federal government’s wilful neglect (May 5, 2020).
5. The job losses continue in Australia but at a slower pace (May 19, 2020).
In terms of the coverage of the ATO Single Touch Payroll data, the ABS report that:
Approximately 99% of substantial employers (those with 20 or more employees) and 71% of small employers (19 or less employees) are currently reporting through Single Touch Payroll.
Jobs attrition over – slow recovery continues
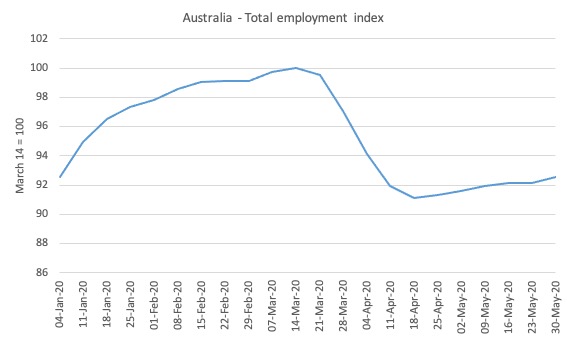
Here is what has happened to total employment in Australia since January 4, 2020 (the ATO data starts at the beginning of the year). The index is based at 100 on March 14, 2020 which appears to be around the peak employment, although it was slowing since February 29, 2020.
Overall, there has been a 7.5 per cent contraction between March 21, 2020 and May 30, 2020. The trough came in the week ending April 18, 2020 and the total employment loss was 8.9 per cent
The contraction is now over and a very slow recovery is underway.
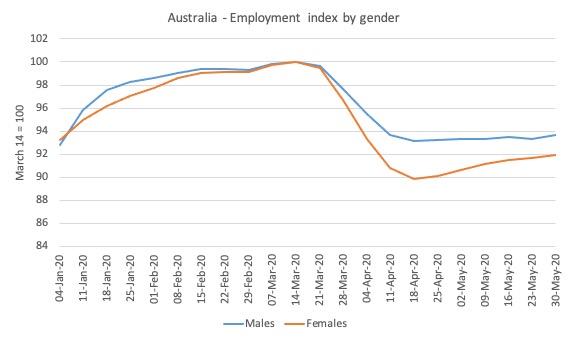
Here is the same series decomposed by gender.
While the pattern was almost identical for males and females up to March 22, 2020, the data for the earlier parts of April showed that the crisis was impacting disproportionately on females.
This bias was driven by the occupational segretation that has women dominating the sectors that were most impacted by the lockdown (accommodation, hospitality, cafes, etc)
As the lockdowns ease and businesses reopen, women are gaining jobs at a faster rate than men.
The accompanying ABS press release – notes that:
The latest data showed that the total payroll job losses since mid-March were greatest in the week ending 18 April (8.9 per cent) and had recovered to a 7.5 per cent loss by the end of May … Payroll jobs in the Accommodation and food services industry increased by 5.0 per cent through May, but remained 29.1 per lower than in mid-March …
The question is now how quickly the jobs will recover and how many businesses have been lost altogether. The latter statistic will determine the residual unemployment that will remain.
The ABS added some interesting extra statistics this edition which provides a deeper insight into the interaction between the job losses and the policy design of the JobKeeper wage subsidy.
The ABS estimated that:
1. “the number of payroll jobs in the week ending 30 May was 7.5% lower than the week ending 14 March 2020 (the week Australia recorded its 100th confirmed COVID-19 case).”
2. “Prior to the COVID-19 period … around 6% of employed people worked multiple jobs at the same time. As of March quarter 2020 … around 93.2% of jobs in the labour market were ‘main jobs’ and around 6.8% of jobs were ‘secondary jobs’ (i.e. other jobs worked concurrently by multiple job holders).”
3. “around 29.0% of jobs that were lost since the week ending March 14 were secondary jobs.”
4. “JobKeeper can only cover a single job for an eligible employee, with main jobs likely to be supported to a greater extent than secondary jobs.”
The problem is that many workers are dependent on a multiple job status, especially when they are working in the low-paid sectors of the economy with little job protection.
By refusing to pay all the workers’ incomes who were forced out of work by the lockdown restrictions, the Government biased its wage subsidy to those in single jobs.
What does this imply?
We can do some ‘back-of-the-envelope’ calculations with some assumptions to see what this might imply.
- The Labour Force survey is usually completed by the 11th day of each month.
- The most recent Labour Force release showed that in the four weeks to May 11 (about) total employment fell by 4.6 per cent or 594,300, unemployment rose by 104,500 and the participation rate fell by 2.4 points. That meant that the labour force shrunk by 489,800 and those workers constitute the rise in hidden unemployment. If added back into the official unemployed, the unemployment rate would have been 9.7 per cent rather than the reported 6.2 per cent – see Australian labour force data – underutilisation rate rises to 23.4 per cent (May 14, 2020)
- What the latest ATO data shows, is that total employment has risen by 0.6 points in the three weeks since the last Labour Force survey was completed – which based on the current labour force data would amount to a further 79.5 odd thousand jobs being lost.
- If we assumed the participation rate over those three weeks was unchanged, then the official unemployment rate would have fallen from 6.2 per cent to 5.6 per cent.
- However, just as the labour force shrank sharply in April as a result of workers giving up active search, any recovery will spur a surge back into the active labour force (a reduction in hidden unemployment), which will push the official unemployment rate estimate up.
- If we assumed no change in participation, but added the hidden unemployed who left the labour force in April back into this revised estimate of the official rate, then the adjusted unemployment rate would be around 9.2 per cent. Without that employment recovery, the adjusted figure would have been around 10.5 per cent.
Given that “not all jobs in the Australian labour market are captured within these estimates”, the ABS urges caution in extrapolating them in the way I have above.
I also emphasise that my calculations are not to be interpreted as being exact statements.
They are just ball park figures.
Wages paid are no longer falling
The ABS report that between March 14, 2020 and May 2, 2020:
1. “Total wages paid decreased by 8.3%.”
2. But in terms of the week ending May 30, 2020: “Total wages paid increased by 0.7%, compared to an decrease of 0.7% in the previous week”
Which suggests the worst is over.
Age breakdown of Job Loss
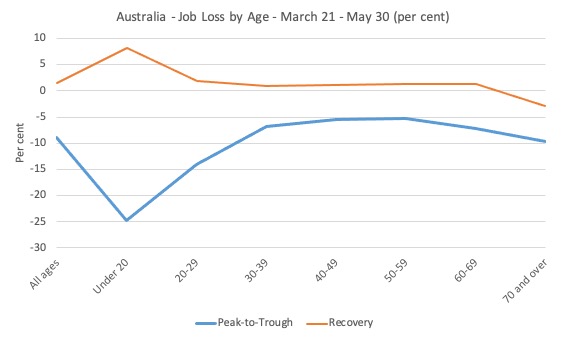
The age breakdowns for Australia as a whole are shown in the next graph.
I have now decomposed the data into the job loss period (peak-to-trough) and the recovery period.
It is clear that our youth bore the brunt of the crisis, largely due to the industrial composition of the job losses – services, accommodation etc.
They are also recovering more quickly.
The older workers, however, continue to face deteriorating conditions, perhaps due to self-isolation.
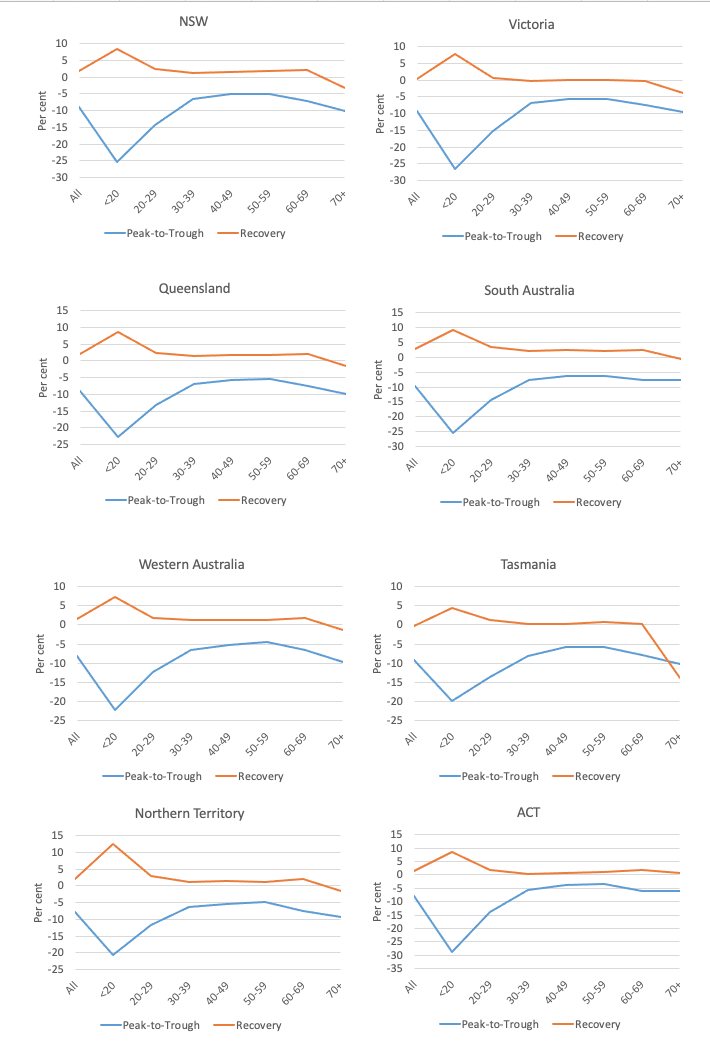
The following sequence of graphs gives the age profiles of the job loss for each State/Territory – be careful to appreciate the difference in the vertical scales.
But for most states and territories, the teenage job loss in the descent was in excess of 20 per cent and many were not being supported by the JobKeeper wage subsidy because of their casual status.
The recovery is very muted for teenagers but that will improve as the lockdown is eased.
Job Loss and Recovery by Age, March 21-May 30, per cent
Industry job loss breakdown
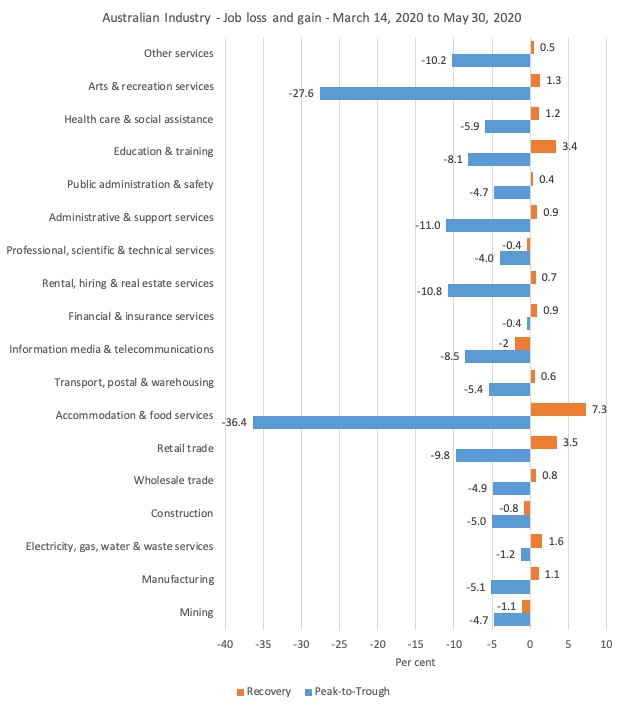
The following graph shows the percentage decline in employment between March 21, 2020 and April 18, 2020 for the Australian industry sectors (peak-to-trough) and the gains since the recovery to May 30, 2020.
The turning point is taken from the time the Accommodation and foods services stopped shedding jobs (week ending April 18, 2020).
As expected the worst hit sectors were Accommodation & food services (decline of 36.4 per cent) and Arts & recreation services (decline of 27.6 per cent).
While the first stages of lockdown easing have allowed some cafes etc to open, which is why Accommodation and food services has rebounded by 7.3 per cent since April 18, 2020, the benefits have not flowed on to the Arts and recreation services sector.
Bands can still not play!
As above, what the residual damage will be once the final stages of easing are in place in the coming months depends on how many business and employers go broke in the meantime.
The government has not done nearly enough to minimise that number.
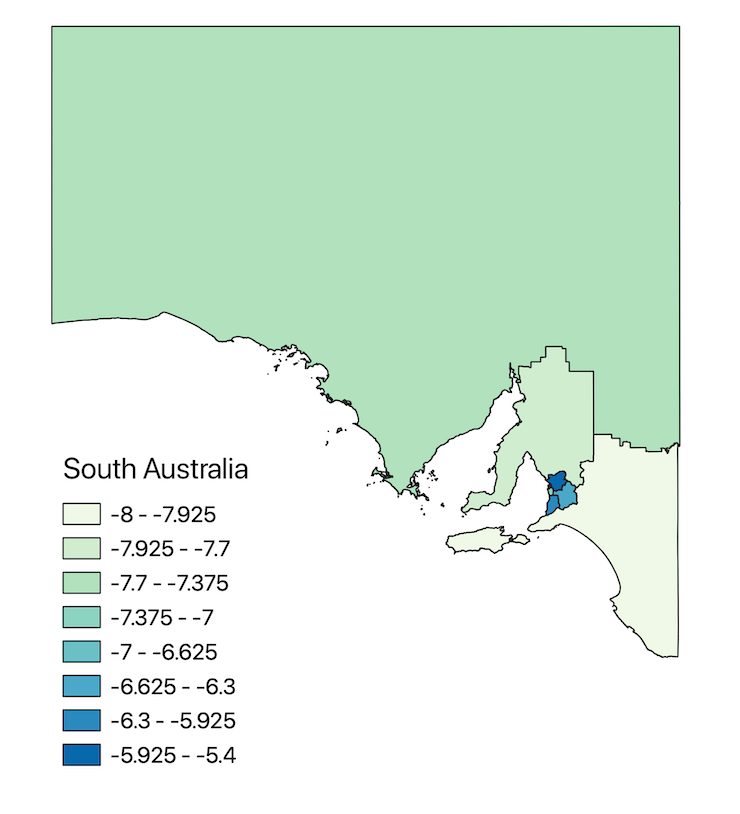
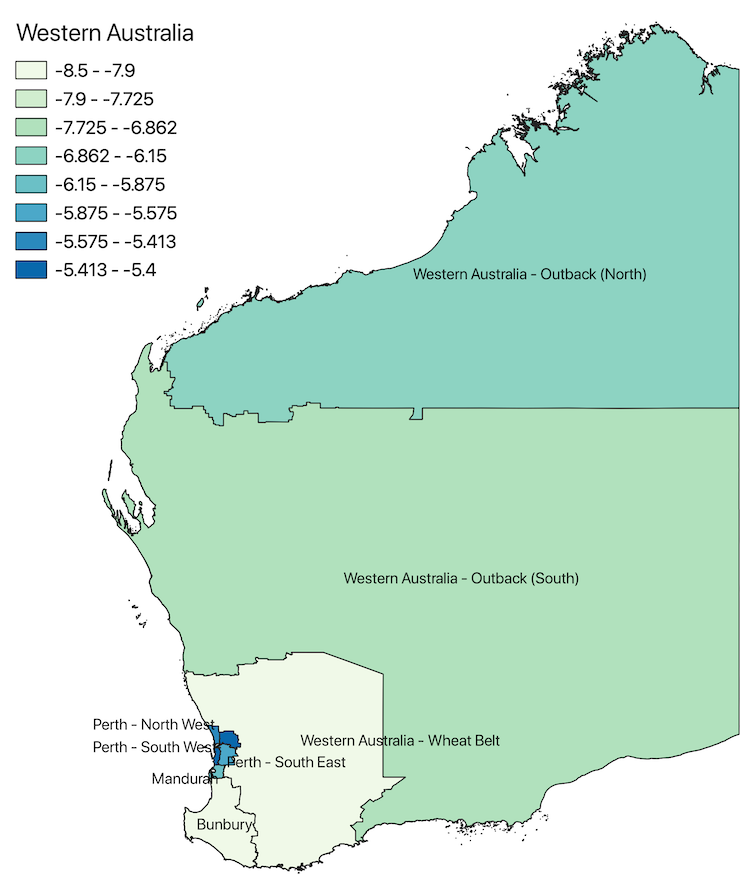
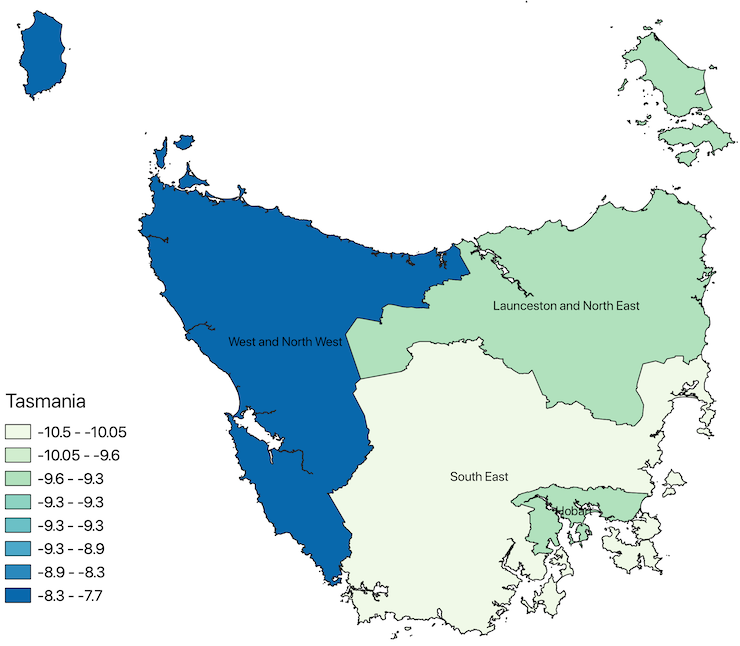
State job loss breakdown
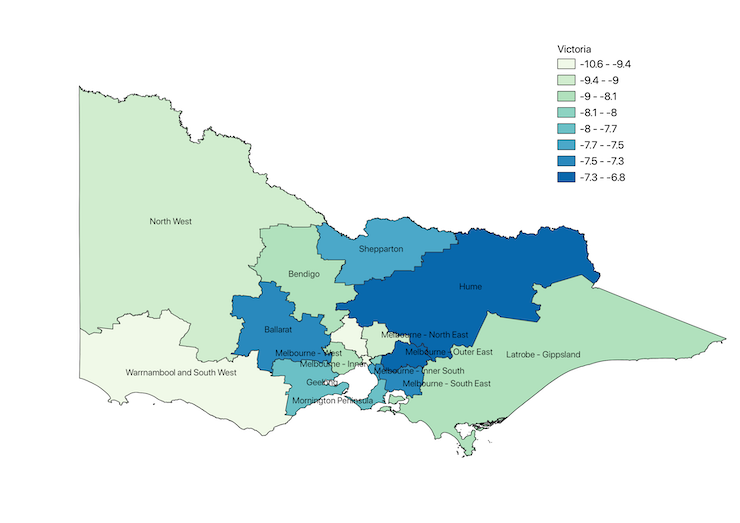
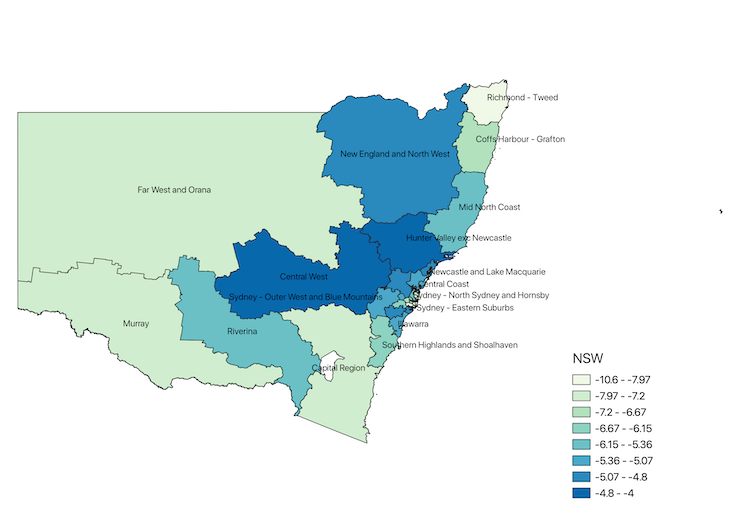
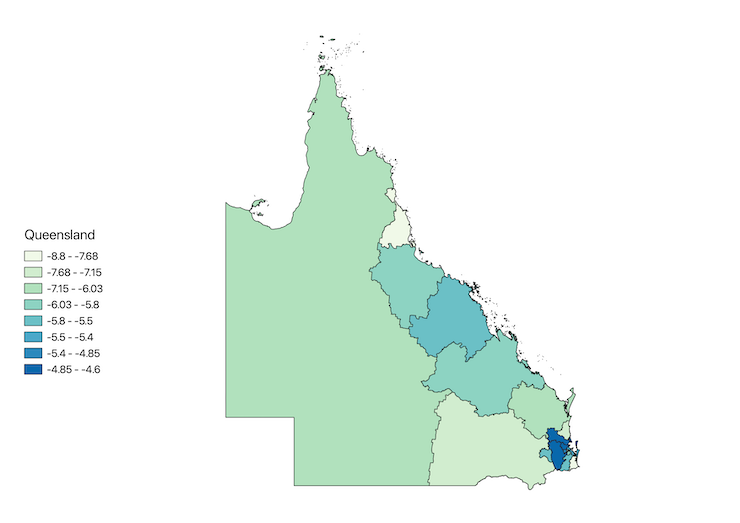
In today’s release, the ABS provided detailed regional level breakdown of the job losses at the SA4 geographic unit. This is their standard geographic region for disseminating labour force data at the regional level and it is a combination of several ‘suburbs’.
Here are some maps of the job losses (by SA4 regional areas).
Victoria
NSW
Queensland
South Australia
Western Australia
Tasmania
Northern Territory
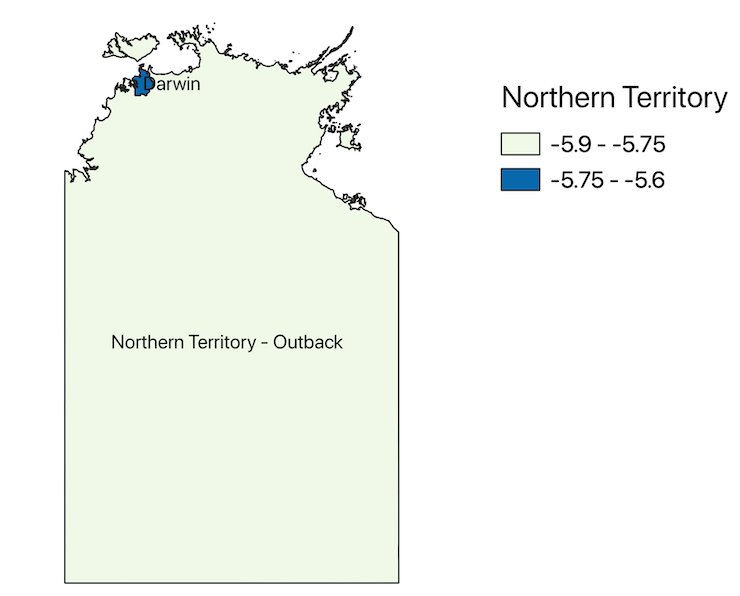
For the ACT, the percentage decline was 6.8 per cent.
The new narrative – take advantage of the disadvantaged gathers pace
This narrative continues.
Refer back to yesterday’s blog post – Neoliberalism is likely to survive yet another crisis (June 15, 2020) – where I reported that a majority of Australian economists polled recently advocated further real wage cuts to the lowest-paid workers.
We have seen this strategy succeed in recent years with the conservatives overseeing cuts to weekend penalty rates, claiming that it would spawn an employment boom in the exposed sectors.
The opposite happened before the COVID-19 crises, which made the situation in these sectors even worse.
My view is the opposite.
I would increase the minimum wage substantially to reduce the disadvantage of this cohort of workers, many of whom are outside the wage subsidy scheme that the Government has introduced.
If the businesses that employ them are struggling then it is the responsibility of government to reduce the circumstances facing them rather than force all the risk back onto the least-paid workers in Australia.
The Australian government could not only easily guarantee the wages of all workers affected but ensure that the businesses they work for are not subjected to tax liabilities and other charges that might reduce their willingness to maintain employment.
Given the scale of the crisis, now is not the time to be pushing for real wage cuts for the lowest-paid workers.
I have heard very little from the Left about this. The Right is all for the cuts.
Indeed, economists who the Labor Party take advice from joined the conga line of wage cutters in the recent survey.
Conclusion
The scale of the job loss is now falling and perhaps we are now seen the worst of it.
But the remaining unemployment is devastating and the reality is that the Federal government chooses the unemployment rate and could do something about the massive spike in joblessness tomorrow if it so chose.
That is enough for today!
(c) Copyright 2020 William Mitchell. All Rights Reserved.
Bill. MMT made a break-through: Stephanie Kelton was a guest on the NPR Program “Think.” She did herself and MMT well. I like to think I played some small part in that: I’ve been complaining to them about the exclusion of MMT thinking in all their programing for a few years.
Like all supporters of MMT Stephanie is pursuing an ideological dream, in her case with the benefit of feminine perspicacity.
What, I wonder, are the ideological dreams of those visiting a Youtube site today, scrolling down over Fleetwood Mac’s Sara onward to Simply Red’s Holding Back The Years, passing on the way MMTed Q&A episode 2.
Is the lens through which they view their ideological model smeared like that of MMT by the reality that distorts the both the view and the path to its destination.