Today (April 18, 2024), the Australian Bureau of Statistics released the latest - Labour Force,…
Australia labour market – one step forward up a gigantic mountain
The Australian labour market recovered somewhat as the governments eased the lockdown restrictions in the service sector. The latest data from the Australian Bureau of Statistics – Labour Force, Australia, June 2020 – released today (June 18, 2020) shows that employment rose by 1.7 per cent. However, participation also rose as job opportunities increased, and the labour force change outstripped the employment increase, which meant that unemployment rose by 69,300 thousand. The rise in employment was totally accounted for by part-time jobs growth, which is a worrying sign. The decline in full-time employment signals that some businesses are closing or others are restructuring their workforces towards more precarious work. The official unemployment rate of 7.4 per cent continues to underestimate the actual impact given that the labour force is still 384 thousand lower than it was in March 2020. Adding those ‘hidden unemployed’ workers back to the underutilisation rate suggests that 22 per cent of the available labour supply is not working in one way or another (unemployment, hidden unemployment, and underemployment). Any government that oversees that sort of disaster has failed in their basic responsibilities to society. It must increase its fiscal stimulus and target it towards large-scale job creation.
The summary ABS Labour Force (seasonally adjusted) estimates for June 2020 are:
- Employment increased 210,800 (1.7 per cent) – Full-time employment decreased 38,100 and part-time employment increased 249,000.
- Unemployment increased 69,300 to 992,300 persons.
- The official unemployment rate increased 0.4 points to 7.4 per cent.
- The participation rate increased by 1.3 points to 64 per cent.
- Aggregate monthly hours worked increased 64.3 million hours (4.02 per cent).
- Underemployment fell 152.5 thousand or 1.4 points to 11.7 per cent. Overall there are 1,556.6 thousand underemployed workers. The total labour underutilisation rate (unemployment plus underemployment) decreased by 1.1 points to 19.1 per cent. There were a total of 2,547.9 thousand workers either unemployed or underemployed.
Employment increased 210,800 in June 2020
1. Employment rebounded by 210,800 (1.7 per cent), which means since March it has now fallen by 660.7 thousand (-5.1 per cent).
2. Full-time employment decreased 38,100 and part-time employment increased 249,000.
So the quality of work continued to deteriorate – the worrying sign – as the lockdown easing opened up a lot of low-wage, precarious service sector positions again.
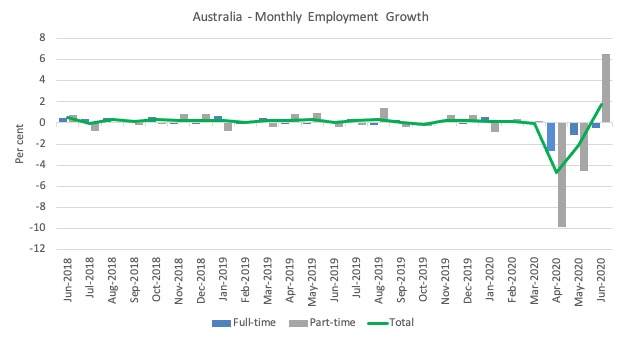
The following graph shows the month by month growth in full-time (blue columns), part-time (grey columns) and total employment (green line) for the 24 months to June 2020 using seasonally adjusted data.
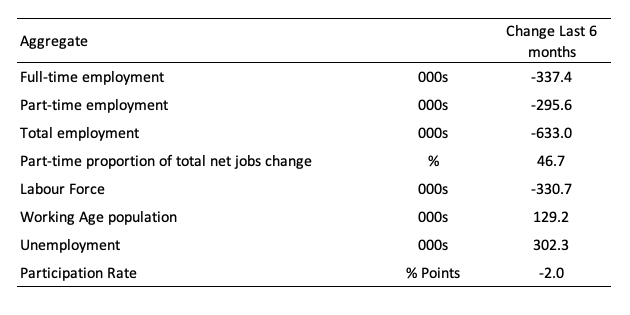
The following table provides an accounting summary of the labour market performance over the last six months.
As the monthly data is highly variable, this Table provides a longer view which allows for a better assessment of the trends.
Assessment:
1. Both the demand- and supply-side have contracted for the same reason – a collapse of employment opportunities. The labour force reduction is less severe than the employment fall, which is why official unemployment has risen.
2. While official unemployment has risen by 302.3 thousand, hidden unemployment has risen substantially given the labour force has shrunk by 330.7 thousand on the back of a 2 points drop in participation (see below for quantification).
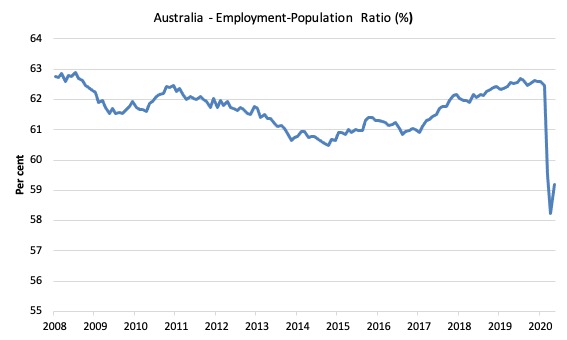
Given the variation in the labour force estimates, it is sometimes useful to examine the Employment-to-Population ratio (%) because the underlying population estimates (denominator) are less cyclical and subject to variation than the labour force estimates. This is an alternative measure of the robustness of activity to the unemployment rate, which is sensitive to those labour force swings.
The following graph shows the Employment-to-Population ratio, since June 2008 (the low-point unemployment rate of the last cycle).
It fell with the onset of the GFC, recovered under the boost provided by the fiscal stimulus packages but then went backwards again as the Federal government imposed fiscal austerity in a hare-brained attempt at achieving a fiscal surplus in 2012.
The ratio rise by 1 point in June 2020 to 59.2 per cent. The ratio is now 3.7 points below pre-GFC peak in June 2008 of 62.9 per cent.
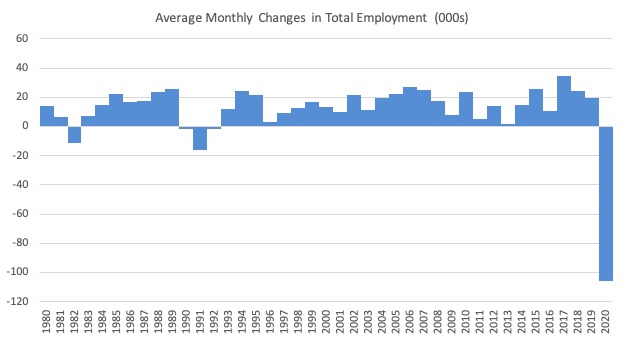
To put the current monthly performance into perspective, the following graph shows the average monthly employment change for the calendar years from 1980 to 2020 (to date).
1. The labour market weakened considerably over 2018 and that situation worsened in 2019.
3. 2020 is off the scale (average employment change so far of -105.5 thousand).
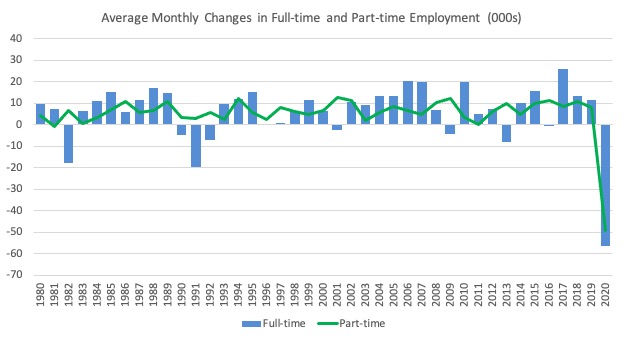
The following graph shows the average monthly changes in Full-time and Part-time employment (lower panel) in thousands since 1980.
The interesting result is that during recessions or slow-downs, it is full-time employment that takes the bulk of the adjustment. Even when full-time employment growth is negative, part-time employment usually continues to grow.
However, this crisis is different because much of the employment losses are the result of lockdowns and enforced business closures in sectors where part-time employment dominates.
But the continuing worsening of the full-time employment situation signals that the demand-side impacts are spreading more widely.
Unemployment increased 69,300 to 992,300 persons or 7.4 per cent
The official unemployment rate increased by 0.4 points to 7.4 per cent but the actual unemployment arising from the crisis is much higher given the sharp fall in the participation rate since March.
In June, unemployment continued to rise despite the employment growth, because workers, previously classified as being outside the labour force re-entered as they considered their was a slightly better change of gaining employment.
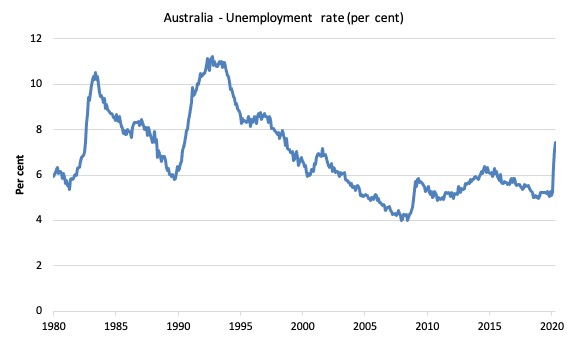
The following graph shows the national unemployment rate from January 1980 to June 2020. The longer time-series helps frame some perspective to what is happening at present.
Assessment:
1. Any time the unemployment rate rises like this you know one other thing – the extent of fiscal policy support is inadequate.
2. There is clearly still considerable slack in the labour market that could be absorbed with further fiscal stimulus.
3. The government is choosing to allow this rise in joblessness.
Broad labour underutilisation decreased by 1.1 points to 19.1 per cent in June 2020
The results for June 2020 are (seasonally adjusted):
1. Underemployment fell 152.5 thousand as the lockdown eased a little.
2. The underemployment rate fell by 1.4 points to 11.7 per cent.
2. Overall there are 1,556.6 thousand underemployed workers.
3. The total labour underutilisation rate (unemployment plus underemployment) decreased by 1.1 points to 19.1 per cent.
4. There were a total of 2,547.9 thousand workers either unemployed or underemployed.
5. The rise in the broad underutilisation rate has been driven by the rise in unemployment, which suggests a longer-lasting crisis – jobs are being shed rather than workers being put on shorter time.
The following graph plots the seasonally-adjusted underemployment rate in Australia from January 1980 to the June 2020 (blue line) and the broad underutilisation rate over the same period (green line).
The difference between the two lines is the unemployment rate.
The three cyclical peaks correspond to the 1982, 1991 recessions and the more recent downturn.
The other difference between now and the two earlier cycles is that the recovery triggered by the fiscal stimulus in 2008-09 did not persist and as soon as the ‘fiscal surplus’ fetish kicked in in 2012, things went backwards very quickly.
The two earlier peaks were sharp but steadily declined. The last peak fell away on the back of the stimulus but turned again when the stimulus was withdrawn.
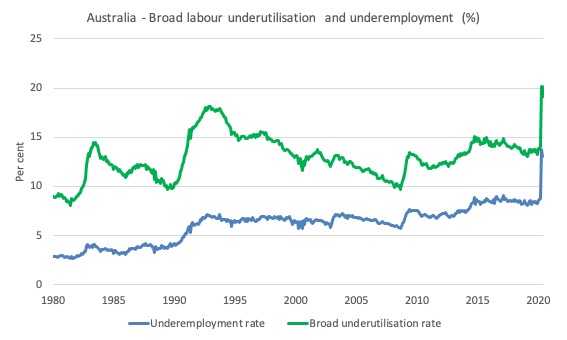
If hidden unemployment (given the depressed participation rate) is added to the broad ABS figure the best-case (conservative) scenario would see a underutilisation rate around 22.2 per cent at present. Please read my blog post – Australian labour underutilisation rate is at least 13.4 per cent – for more discussion on this point.
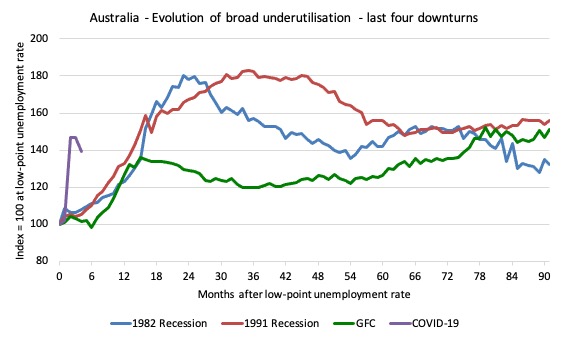
Unemployment and broad labour underutilisation indexes – last four downturns
The following graph captures the evolution of the unemployment rates for the 1982, 1991, GFC and COVID-19 downturns.
For each episode, the graph begins at 100 – which is the index value of the unemployment rate at the low-point of each cycle (June 1981; December 1989; February 2008, and January 2020, respectively).
We then plot each episode out for 90 months.
For 1991, the peak unemployment which was achieved some 38 months after the downturn began and the resulting recovery was painfully slow. While the 1982 recession was severe the economy and the labour market was recovering by the 26th month. The pace of recovery for the 1982 once it began was faster than the recovery in the current period.
During the GFC crisis, the unemployment rate peaked after 16 months (thanks to a substantial fiscal stimulus) but then started rising again once the stimulus was prematurely withdrawn and a new peak occurred at the 80th month.
The COVID-19 downturn, while in its early months, is obviously worse than any of the previous recessions shown.
The graph provides a graphical depiction of the speed at which each recession unfolded (which tells you something about each episode) and the length of time that the labour market deteriorated (expressed in terms of the unemployment rate).
After three months, the unemployment had risen from 100 to:
1. 108.8 index points in 1982.
2. 109.2 index points in 1991.
3. 107.1 index points in the GFC.
4. 146.4 index points currently (and note the point below about participation rate declining)
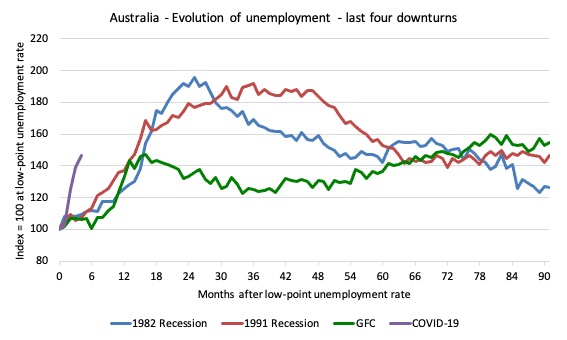
Note that these are index numbers and only tell us about the speed of decay rather than levels of unemployment.
The next graph performs the same operation for the broad labour underutilisation rate (sum of official unemployment and underemployment).
Aggregate participation rate increased by 1.3 points to 64 per cent
The rise in the labour force participation rate means that that the labour force grew by 280 thousand. Given employment only rose by 210,800, the return of workers into the labour force also pushed up the unemployment pool by 69,300.
The labour force is still below the March 2020 level by 384.6 thousand and those workers will return as employment rises, which will place a further strain on official unemployment.
By how much would unemployment have changed had the participation rate had not risen?
We can make two calculations:
1. Just the monthly implication.
2. The implication of the participation rate being below its most recent peak of 66.2 per cent in August 2019.
The labour force is a subset of the working-age population (those above 15 years old). The proportion of the working-age population that constitutes the labour force is called the labour force participation rate. Thus changes in the labour force can impact on the official unemployment rate, and, as a result, movements in the latter need to be interpreted carefully. A rising unemployment rate may not indicate a recessing economy.
The labour force can expand as a result of general population growth and/or increases in the labour force participation rates.
The following Table shows the breakdown in the changes to the main aggregates (Labour Force, Employment and Unemployment) and the impact of the rise in the participation rate.
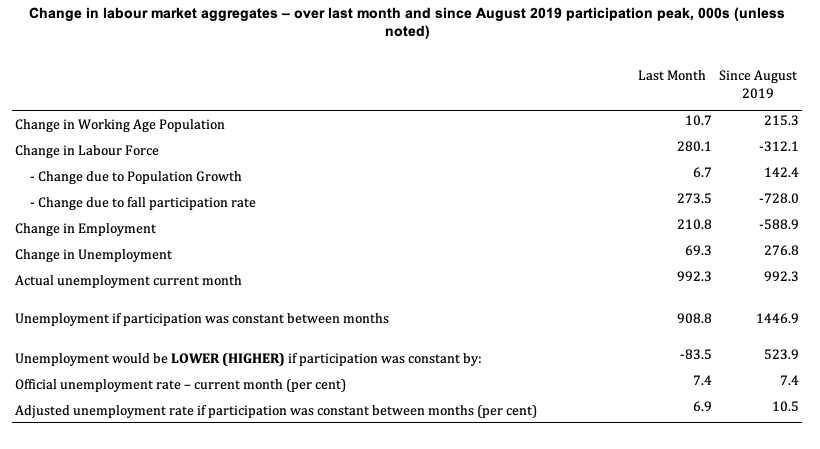
The change in the labour force in June 2020 was the outcome of two separate factors:
- The underlying population growth added 6.7 thousand persons to the labour force. The population growth impact on the labour force aggregate is relatively steady from month to month but has slowed in recent months; and
- The rise in the participation rate meant that there were 273.5 thousand workers re-entering the labour force (relative to what would have occurred had the participation rate remained unchanged).
- The net result was that the labour force rose by 280 thousand.
Assessment:
1. If the participation rate had not have risen in June, total unemployment, at the current employment level, would have been 908.8 thousand rather than the official count of 992.3 thousand as recorded by the ABS – a difference of 83.5 thousand workers (the ‘participation effect’).
2. Without the rise in the participation rate in June 2020, the official unemployment rate would have been 6.9 per cent (rounded) rather than its current value of 7.4 per cent).
3. Hidden unemployment thus fell by 83.5 thousand.
4. The situation is worse if we consider the collapse since August 2019. The labour force has shrunk by 312.1 thousand and the unemployment rate would be 10.5 per cent rather than 7.4 per cent had those workers not dropped out of the labour force as a result of inadequate job opportunities.
5. If we add the change in hidden unemployment back into the broad labour underutilisation rate currently estimated to be 19.1 per cent, we would get a total wastage rate of 22 per cent.
And that spells Policy. Failure.
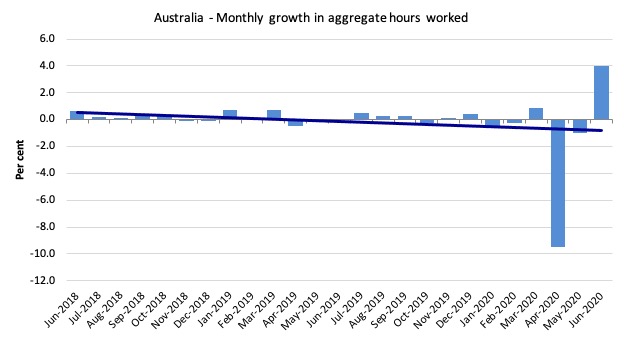
Hours worked increased 64.3 million hours (4.02 per cent) in June 2020
As the lockdown eases, hours are returning.
The following graph shows the monthly growth (in per cent) over the last 24 months.
The dark linear line is a simple regression trend of the monthly change – which depicts a decreasing trend. Even before the coronavirus crisis struck, the trend was downwards.
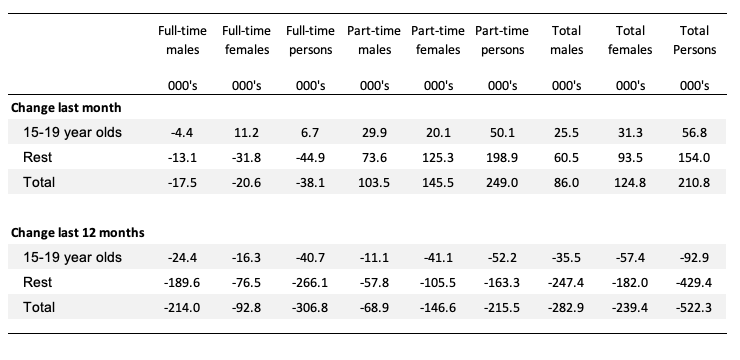
Teenage labour market improves as lockdown eases in June 2020
1. Total teenage net employment rose by 56.8 thousand in June 2020 (10.7 per cent) as the low-wage service sector reopens.
2. Full-time teenage employment rose (surprisingly) by 6.7 thousand (5.5 per cent) and part-time employment rose by 50.1 thousand (12.3 per cent).
3. The teenage unemployment rate fell by 0.2 points to 19.4 per cent.
The following Table shows the distribution of net employment creation in the last month and the last 12 months by full-time/part-time status and age/gender category (15-19 year olds and the rest).
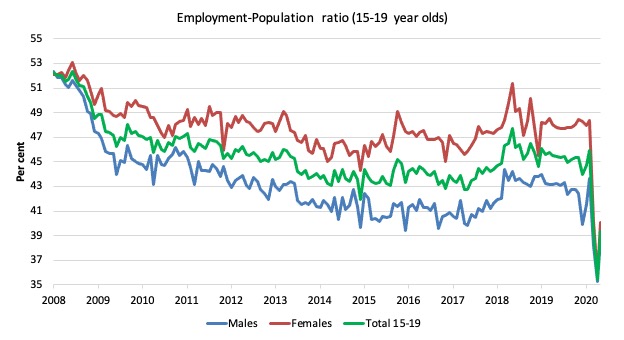
To put the teenage employment situation in a scale context (relative to their size in the population) the following graph shows the Employment-Population ratios for males, females and total 15-19 year olds since June 2008.
You can interpret this graph as depicting the loss of employment relative to the underlying population of each cohort. We would expect (at least) that this ratio should be constant if not rising somewhat (depending on school participation rates).
The absolute loss of jobs reported above has impacted more on females than males.
1. The male ratio has fallen by 13.7 percentage points since February 2008 and 5 points since March 2020.
2. The female ratio has fallen by 12.1 percentage points and 8.4 points since March 2020.
3. The overall teenage employment-population ratio has fallen by 12.9 percentage points and 6.6 points since March 2020.
4. In proportional terms, despite the improvement in June, this remains a devastating result for teenagers.
The other statistic relating to the teenage labour market that is worth highlighting is the decline in the participation rate since the March 2020 – when it was 55.1 per cent.
In June 2020, the ratio was at 48.8 per cent. A significant exit from the labour force.
It was already well below the level that was recorded at the onset of the GFC.
The difference between the 2008 level and now, amounts to an additional 179.5 thousand teenagers who have dropped out of the labour force as a result of the weak conditions since the crisis.
If we added them back into the labour force the teenage unemployment rate would be 35.3 per cent rather than the official estimate for June 2020 of 19.4 per cent.
Some may have decided to return to full-time education and abandoned their plans to work. But the data suggests the official unemployment rate is significantly understating the actual situation that teenagers face in the Australian labour market.
Overall, the performance of the teenage labour market is disastrous and will undermine future productivity and prosperity as our society ages.
I continue to recommend that the Australian government immediately announce a major public sector job creation program aimed at employing all the unemployed 15-19 year olds, who are not in full-time education or a credible apprenticeship program.
This is desperately required now.
The Government has been silent on this crisis. A nation cannot stand idly by and allow 41.4 per cent of teenagers who desire to work to be idle.
That is a catastrophe for the present and a time-bomb for the future.
Conclusion
My standard monthly warning: we always have to be careful interpreting month to month movements given the way the Labour Force Survey is constructed and implemented.
The June 2020 data reveals that the Australian economy recovered somewhat as the government eased the strict lockdown on businesses.
However, the scale of the collapse was so large that it will take years to reverse given the on-going closure of businesses that have ‘not made it through to the other side’.
My overall assessment is:
1. The current situation can best still be described as catastrophic.
2. The Australian labour market needs massive fiscal policy intervention targetted at direct job creation.
3. The prior need for a fiscal stimulus of around 2 per cent has changed to a fiscal stimulus requirement of several times that.
4. There is clear room for some serious fiscal policy expansion at present and the Federal government’s attempts to date have been seriously under-whelming.
5. Any government that oversees that sort of disaster has failed in their basic responsibilities to society.
That is enough for today!
(c) Copyright 2020 William Mitchell. All Rights Reserved.
I do have to say that so far, I see nothing to indicate that the federal government are gearing up to do anything other than a copy, paste and re-run of the same, tired, old, failed neo-liberal approach that was served up to young school leavers like myself, who walked out of high school in 1990 and ran headlong into the recession.
There are enough people out there satisfied with the Morrison Government’s performance to re-elect them for another term next election.
if it wasn’t for covid I’d be seriously thinking about leaving Australia and never coming back.
As depressing a thought as it is – perhaps it will take another war for everyone to realise that government can essentially make unemployment and underemployment disappear almost as easily as snapping their fingers.
@Alan – I don’t think that the Coalition feel under any pressure at all to deliver any kind of Job Guarantee.
The next election is still quite a ways off and there is plenty of time for the economy to “snap back” to significantly high growth and significantly low unemployment, which is surely what will happen………..in their thinking. So I’m not sure they see a need to do much of anything.
Plus, they are simply opposed at the most fundamental ideological level to doing what is necessary to achieve and maintain true full employment………….and even to having true full employment at all since it would significantly enhance the bargaining power of workers to ask for more.
If it had been Menzies in charge at the end of WW2 instead of Curtin – would Menzies have ever implemented a full employment policy? I highly doubt it, he wanted the policy framework he had inherited gone but concluded it was too politically dangerous to remove it.
Bill has previously hinted that something is underway but it seems to me that Hell will have to freeze over before a conservative government will ever abandon their support for capital by removing the permanent pool of joblessness and poverty from the bottom of society that helps suppress workers wage growth.
“Jobtrainer” the government are calling it – I suppose the part about supporting the employment of existing trainees and apprentices is better than nothing.
But the rest of it looks to be a warmed-over version of the same steaming pile of horse shit I was served up 30 years ago – no actual creation of jobs but plenty of training courses to get people job-ready for jobs that aren’t there.
“The rise in employment was totally accounted for by part-time jobs growth, which is a worrying sign. The decline in full-time employment signals that some businesses are closing or others are restructuring their workforces towards more precarious work.” Maybe MMT should include in its formal analysis and critique of neoliberalism the popular phrase “bullshit jobs.” It has a ring to it that “precarious work” does not have, and would appeal to the average yap, who’s likely stuck in a BS job if he or she has a job at all. There are still many with us from the working class who remember the days when jobs were generally secure and decent, allowing you and your family to enjoy a modest but meaningful “normal” life. In these times of neoliberal thinking, however, we have a new word for such a normal life, for anyone whose neck is not under the boot of oppression. Implicitly buying into the neoliberal view of the default human position–a frenzied, desperate struggle to merely survive–what we once called “normal” we now call “privileged.”
Professor, if it pleases you, I’d like to know your thinking about money supply growth in the US: 24 percent growth M2 over the last year; 40% annual growth rate over the last 6 months. Incredible! I’ve never see numbers like this.
Unfortunately Scott Morrison has not been able to overcome his incorrect belief that the only jobs that are genuine, valuable, and real are those that are created by private firms.
I suspect that if an LNP Prime Minister introduced a Job Guarantee it would be a kind of “Nixon goes to China” move that would be impossible to oppose, and that would meet with widespread acclaim. It is misguided of him to pass up this political opportunity. He should also do it because it would save lives, eradicate waste, increase productive capacity, care for people, and care for the planet.
@Nicholas – agree…..but I think his core constituents/donors would squeal like stuck pigs that such a move would trigger runaway “inflation” (read: it will be harder to deny workers pay rises in a full-employment economy).
@ Leftwinghillbillyprospector
However, those donors don’t know or don’t care that for an economy to be stable, it *must* include a way for money to flow down from the rich to the poor or the workers that exact;y matches the flow up to the rich from the workers or the poor when they by stuff. That is, if there is no matching flow of money, then over time more and more (and eventually all) the money will be in the hands of the rich. Long before this happens the rich will find that they can’t sell to the workers because they have no money to spend, that doesn’t go to food, rent, &/or clothes, leaving nothing left.
. . . Here I use the word ‘stable’, they might use the phrase ‘in equilibrium’. In a physical science equilibrium means the flows are equal. For example, the ice and water in a glass are in equilibrium only if the rate the ice melts is exactly matched by the rate water freezes into ice. Or, the temp of the earth is in equilibrium only if the heat from the sun coming in is exactly matched by the heat radiating out into space at night, and in day too (over the full year). THAT IS, if there is any flow at all then there must be another that offsets it exactly for there to be equilibrium.
. . . Neo-liberal people talk about equilibrium, but they don’t grok it. Or, don’t care because it is *all* just excuses for them to do what they want.
[Note — the Gov. could *give* money to the poor to match 100% of the net flow up to the rich, but the rich don’t want that either (it isn’t in equilibrium either anyway). Or, the Gov. could *give* 100% of the net “up flow” to the poor and could tax the rich just 90% of it, leaving the rich with just 10% of the net up flow (this isn’t in equilibrium either anyway). To have equilibrium the flows must be equal.]
@Steve American – it seems to be the eternal conundrum of capitalism: too much is never enough, governments lobbied/co-opted to endlessly move regulation in favour of capital so that the maximum amount of wealth flows to the minimum number of hands and then it’s “why can’t people afford to buy my goods?”. I’m sure many of not most of them realise it – they just can’t help themselves.
In unrelated news that brought a smile to my face this afternoon, my least-favourite fellow Queenslander, billionaire mining magnate and major conservative party donor/political party founder Clive Palmer – who has been running a challenge in the High Court to overturn the right of the Queensland government to protect the health and lives of it’s citizens by closing or restricting border movements as it sees fit during the Covid pandemic – has been charged with major fraud by the Australian Securities and Investments Commission. The charges relate to some dodgy accounting between his political party (Palmer United Party) and other enterprises owned by him. There are four separate charges, each carrying a penalty of between 5 and 12 years in prison.
The weekend is looking up 🙂 :):):):):)
Something is trickling down Clive’s billionaire leg at the moment – and it isn’t wealth.
My minor in college was Anthropology.
One to the things it said was that gov. developed gradually.
Bands => Tribes => Chiefdoms => States.
And, *from the very beginning* one of the main functions of the “gov.” was to redistribute production from those who produced too much thing X but not enough thing Y, to those who produced too much thing Y but not enough thing X. etc. So, farmers got meat from hunters and hunters got grain from farmers, etc.
Neo-liberals think ‘redistribution’ is communism. Maybe so, but it has been a function of gov. since the very beginning. Clearly it is still *necessary* now.
Without a flow created by the gov. from the rich down to the workers and poor, the society is unstable and will someday erupt in riots and a French type revolution. And this ‘someday’ is *much* more likely to come than the ‘someday’ when the national debt will be paid off with money from taxes.
Power Greenhouses – No CO2 – 1 Gigawatt 20 sq miles – Something that needs doing.
Large scale greenhouses can be used to replace power stations for electrical power generation. The plants grown inside the greenhouse are pulverised and desiccated before use as the fuel source for the electrical generation. The heat and the CO2 released in the combustion process are captured (and recaptured) within the gas impermable greenhouse, providing a huge acceleration in plant growth.
A jungle in a bottle. To achieve reliable 24h/365d power delivery to the national grid the greenhouse must therefore use the ground as very large thermal store and have an appropriate lighting system.
Pros
Reliable power delivery 24h/365d unlike PV and wind. Good as they are.
No CO2 released (handy for carbon neutrality by 2030) Gas impermable.
No H20 released (handy for a Deserts, but Brownfield and Opencast site with broken ecosystems can be used.
No fossil fuels usage
A greenhouse reliable technology that has been available for use for 120 years.
Power for 300,000 homes.
Cons
50 square kilometres/ 20 square miles produces to a gigawatt.
Cost irrelevant, carbon neutral by 2030. Shovel ready in two months, if taken seriously.
Regards
Lee
Victoria has had a spike in cases again and will be going into stage 4 lock down.
So these figures are only going to get worse. And Morrison has said.
“People will just have to get used to having fewer working hours in the covid-19 recession.”
So no real hope that this gov will want to govern effectively for the good of all it’s citizens.
The future looks very bleak indeed. I’m one of the underpaid employed and I’m one of the lucky ones, who’ve chosen not to have a partner or a family for this very reason. I don’t envy anyone with kids atm.
Regards
Dan.