Today (April 18, 2024), the Australian Bureau of Statistics released the latest - Labour Force,…
Latest Australian payroll data suggests employment damage from shutdown is worse than thought
The evidence that is mounting is allowing researchers to better assess the damage that is emerging from the way in which we are dealing with the coronavirus. One of the important questions that will determine the future trajectory of our economy relates to how many workplaces have disappeared altogether as a result of the businesses disappearing forever as a result of the flow-on impacts of the compulsory lockdown. Last week (July 14, 2020), the Australian Bureau of Statistics released their latest employment data taken from Australian Tax Office data – Weekly Payroll Jobs and Wages in Australia, Week ending 27 June 2020. They have slowed the release cycle on this data (for reasons they have not disclosed), so it is a month since I have analysed it. The latest data covers the period up to June 27, 2020. The monthly labour force data released last Thursday for June 2020, covers a period that ends around June 12, 2020, so the payroll data provides a more recent snapshot of the state of affairs – an extra three weeks. As the enforced restrictions were eased, payroll employment recovered somewhat and by the end of June is now 5.7 per cent below the March 14, 2020 levels. It appears though that, while part-time work has recovered, full-time work continues to decline. Examining the age profiles of the recovery demonstrates that prime age workers have not enjoyed a commensurate recovery. The two observations are linked and are suggestive of the impacts of the initial damage have now permeated the supply chain and employment losses are spreading outside areas initially most impacted by the lockdown. So my prediction in March that many businesses will disappear because the fiscal support by the government was inadequate and poorly targetted in terms of protecting jobs is looking like being validated by subsequent data. But it now seems that the recovery in employment will be protracted given how many jobs have been lost to date and the renewed lockdowns in Victoria. A much larger fiscal intervention is required and it has to be directed at workers rather than firms and support direct job creation.
Relevant blog posts as I trace this data trail over time are:
1. “We need the state to bail out the entire nation” (March 26, 2020).
2. The government should pay the workers 100 per cent, not rely on wage subsidies (March 30, 2020).
3. A Job Guarantee would require $A26.5 billion net to reduce the unemployment rate by 6 percentage points (April 30, 2020).
4. Latest employment data for Australia exposes Federal government’s wilful neglect (May 5, 2020).
5. The job losses continue in Australia but at a slower pace (May 19, 2020).
6. Worst is over for Australian workers but a long tail of woe is likely due to policy failure (June 16, 2020).
In terms of the coverage of the ATO Single Touch Payroll data, the ABS report that:
Approximately 99% of substantial employers (those with 20 or more employees) and 71% of small employers (19 or less employees) are currently reporting through Single Touch Payroll.
Broad assessment
1. Last week, the monthly Labour Force data showed that while employment grew in June, full-time employment went backwards – see my review – Australia labour market – one step forward up a gigantic mountain (July 16, 2020).
2. The Labour Force data was based on a survey that ended around the second-week of June, so by the time the data is published it is a month out of date.
3. The latest payroll data from the ATO takes us up to June 27, 2020, which means it is more representative of where we are at now (although still two weeks out of date).
4. In the period after the last Labour Force survey, the second-wave of the virus has hit Victoria and now most of Melbourne and an adjacent non-city shire have been locked down again, which guarantees to stall any economic recovery that followed the easing.
5. The assumption by the Federal government that the economy would be rebound quickly is ill-founded. There is mounting evidence that many businesses will not ‘make it across’ the lockdowns, especially given that Victoria is back in tight lockdown and NSW is looking like it will have to follow.
The Government is due to update its economic statements on the fiscal support it is offering, given that the major support is due to expire by September.
It is obvious that it will have to continue to offer massive fiscal support for an indefinite period – probably a decade or so. So the question then arises – what is best form of that support and at what level should it be provided.
That is the background to analysing the latest payroll data.
Jobs attrition over – slow recovery continues
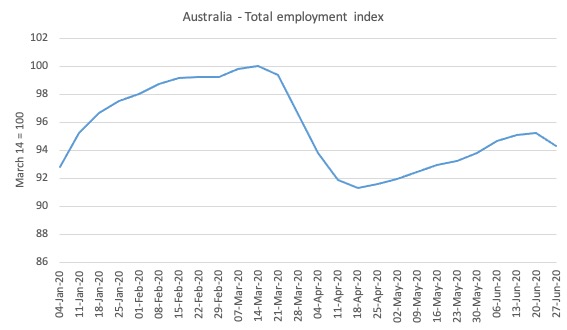
Here is what has happened to total employment in Australia since January 4, 2020 (the ATO data starts at the beginning of the year). The index is based at 100 on March 14, 2020 which appears to be around the peak employment, although it was slowing since February 29, 2020.
Overall, there has been a 5.7 per cent contraction between March 21, 2020 and June 27, 2020. The trough came in the week ending April 18, 2020 and the total employment loss was 8.9 per cent.
As the lockdowns were eased, employment started to return until June 20, 2020, after which there was a 0.9 point contraction in the last week, as the new Victorian lockdown came into effect. That lockdown will persist for at least 4 more weeks.
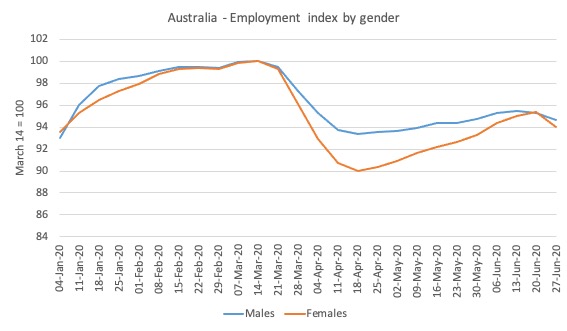
Here is the same series decomposed by gender.
While the pattern was almost identical for males and females up to March 22, 2020, the data for the earlier parts of April showed that the crisis was impacting disproportionately on females.
This bias was driven by the occupational segregation that has women dominating the sectors that were most impacted by the lockdown (accommodation, hospitality, cafes, etc)
As the lockdowns ease and businesses reopen, women are gaining jobs at a faster rate than men.
And the gender-bias in the next decline is already evident in the last week of June.
If the NSW government is faced with the same virus spiral, then the graph will continue to decline.
The accompanying ABS press release – notes that:
By the end of June, around 35 per cent of payroll jobs initially lost had been regained … Payroll jobs worked by females recovered through June (recording a 0.8 per cent increase compared to a 0.1 per cent decrease for males). However, total female job losses since mid-March were still greater, at 6.0 per cent, compared to 5.4 per cent for males.
The question is now how quickly the jobs will recover and how many businesses have been lost altogether. The latter statistic will determine the residual unemployment that will remain.
A guide to the answer to that question can be formed from last week’s Labour Force data.
Why?
Answer: because we know that the composition of total employment is already changing away from full-time work.
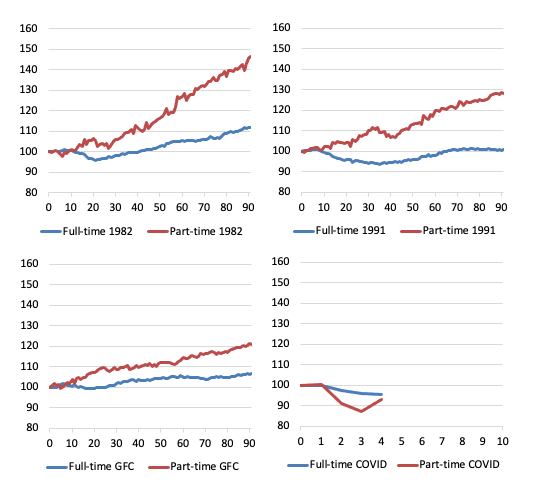
The following butterfly graphs are constructed from ABS Labour Force data.
They show for full-time and part-time employment indexes set at 100 for the peak in total employment in the downturns for 1982, 1991, GFC and now the COVID-19 cycles.
For the first three events, they show the trajectory for 90 months after the peak, capturing the dynamics of the cycle.
The pattern in a usual downturn are demonstrated in the first three episodes – even as full-time employment declines as the recession bites, part-time employment continues to grow for a while, until it becomes obvious that the recession is deepening.
At the peak before the 1982 recession, the ratio of part-time to total employment was 16.2 per cent. By the time, full-time employment had reached the peak level again (after 41 months following the peak), the ratio was 17.6 per cent (and rising).
The 1991 recession was particularly bad and there was a major shift away from full-time work. At the peak before the 1991 recession, the ratio of part-time to total employment was 21 per cent. By the time, full-time employment had reached the peak level again (after 65 months following the peak), the ratio was 22.3 per cent (and continuing to rise).
The GFC event was reduced in intensity by the substantial fiscal stimulus that the Federal government introduced. But the part-time ratio still rose and full-time employment took 23 months to return to its pre-GFC peak. The part-time to total ratio in February 2008 (peak before the downturn) was 28.3 JobKeeper cent. After 23 months, the ratio had risen to 30.1 per cent.
While the ratio is rising on a trend basis as the labour market is increasingly casualised and job protections are wound back under the aegis of government policy designed to tilt the playing field towards the employers, there is an acceleration in the ratio during recessions when employers scrap full-time work and replace it in the recovery with part-time, fractionalised and insecure work.
The COVID episode is different given the nature of the job loss – lockdowns – which have directly impacted on the sectors where part-time work dominate.
But it is clear from the observations we have (lower-right panel) from the peak in February 2020 until June 2020, that as the lockdowns were eased, part-time employment rebounded but full-time employment continues to decline.
Experience tells me that that suggests that there have been major business failures which will leave a legacy of elevated unemployment.
What does this imply?
We can do some ‘back-of-the-envelope’ calculations with some assumptions to see what this might imply.
- The Labour Force survey is usually completed by the 11th day of each month.
- The most recent Labour Force release showed that in the four weeks to June 11 (about) total employment rose by 4.6 per cent or 210.8 thousand, unemployment rose by 69.3 thousand and the participation rate rose by 1.3 points. That meant that the labour force rose by 280.1 thousand. Of course, since March 2020, the labour force has fallen by 384.6 thousand.
- If added those workers who have left the labour force due to a lack of employment opportunities back into the official unemployed, the unemployment rate would have been 10.04 per cent rather than the reported 7.45 per cent – see Australia labour market – one step forward up a gigantic mountain (July 16, 2020).
- What the latest ATO data shows, is that total employment has fallen by 0.8 points in the three weeks since the last Labour Force survey was completed – which based on the current labour force data would amount to a further 106.6 odd thousand jobs being lost.
- If we assumed the participation rate over those three weeks was unchanged, then the official unemployment rate would have risen from 7.4 per cent to 8.2 per cent (which excludes from the calculation the decline in the labour force).
- However, just as the labour force shrank sharply in April as a result of workers giving up active search, any recovery will spur a surge back into the active labour force (a reduction in hidden unemployment), which will push the official unemployment rate estimate up.
- If we assumed no change in participation, but added the hidden unemployed who left the labour force in April back into this revised estimate of the official rate, then the adjusted unemployment rate would be around 10.8 per cent.
So this information (which is 3 weeks later than the last Labour Force data) suggests that the labour market is in much worse shape than last week’s data demonstrates.
Given that “not all jobs in the Australian labour market are captured within these estimates”, the ABS urges caution in extrapolating them in the way I have above.
I also emphasise that my calculations are not to be interpreted as being exact statements.
They are just ball park figures.
Wages paid are no longer falling
The ABS report that between March 14, 2020 and June 27, 2020:
1. “Total wages paid decreased by 3.2%.”
2. But in terms of the week ending June 27, 2020, total wages have once again slumped, after recovering somewhat during May.
Which suggests the worst is far from over.
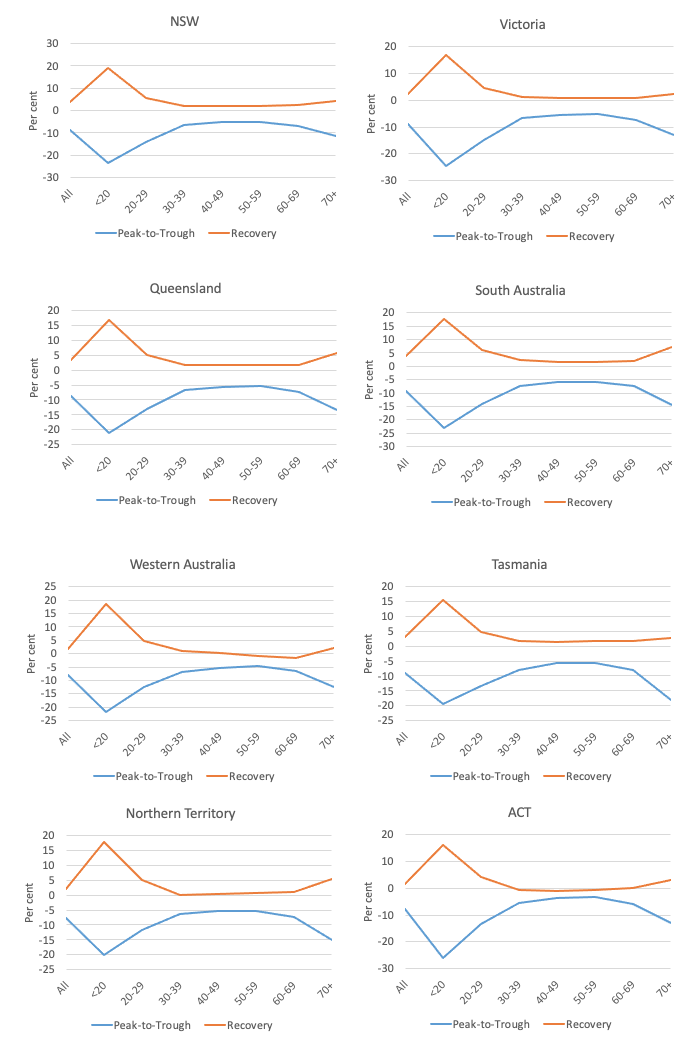
Age breakdown of Job Loss
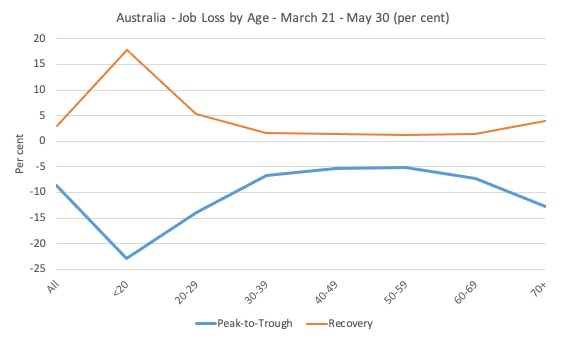
The age breakdowns for Australia as a whole are shown in the next graph.
I have now decomposed the data into the job loss period (peak-to-trough) and the recovery period.
It is clear that our youth bore the brunt of the crisis, largely due to the industrial composition of the job losses – services, accommodation etc.
They are also recovering more quickly.
The older workers, however, continue to face deteriorating conditions, perhaps due to self-isolation.
The other insight from this graph is in noting that the prime-age workers lost about 4 per cent of their employment during the peak-to-trough period but in the period since the lockdowns have been eased, their recovery is very muted.
This links with the full-time, part-time analysis above and is suggestive of a conclusion that businesses have disappeared and the recession will be worse than the government has allowed for in their policy support.
The following sequence of graphs gives the age profiles of the job loss for each State/Territory – be careful to appreciate the difference in the vertical scales.
But for most states and territories, the teenage job loss in the descent was in excess of 20 per cent and many were not being supported by the JobKeeper wage subsidy because of their casual status.
The recovery is very muted for teenagers but much worse for the prime-age workers (as above).
Job Loss and Recovery by Age, March 21-June 27, per cent
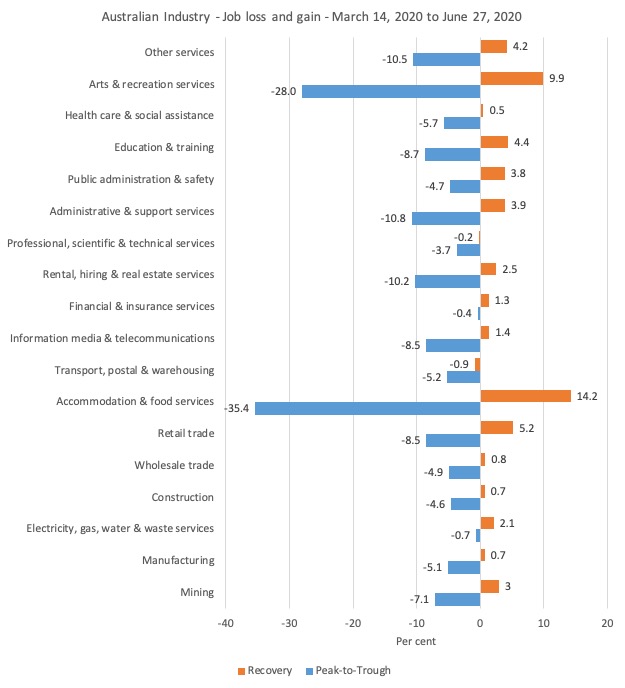
Industry job loss breakdown
The following graph shows the percentage decline in employment between March 21, 2020 and April 18, 2020 for the Australian industry sectors (peak-to-trough) and the gains since the recovery to June 27, 2020.
The turning point is taken from the time the Accommodation and foods services stopped shedding jobs (week ending April 18, 2020).
As expected the worst hit sectors were Accommodation & food services (decline of 35.4 per cent) and Arts & recreation services (decline of 28 per cent).
The first stages of lockdown easing have allowed some cafes etc to open, which is why employment in the Accommodation and food services has rebounded by 14.2 per cent since April 18, 2020. The Arts and recreation services sector has recovered by 9.9 per cent.
As above, what the residual damage will be once the final stages of easing are in place in the coming months depends on how many business and employers go broke in the meantime.
It is clear that in the last week, several sectors have shed employment.
For example, payroll jobs in Health care & social assistance shrunk by 5.7 per cent in the last week. Transport, postal & warehousing shrunk 1.8 per cent. Administrative & support services shrunk by 2 per cent.
Taken together, these sectors are probably reflecting factors that have arisen from the wider impacts of the lockdowns as the damage permeates the supply chain across the industrial structure.
The deeper this cross-industry penetration the worse the longer lasting effects will be.
State job loss breakdown – Not updated
The ABS has previously provided detailed regional level breakdown of the job losses at the SA4 geographic unit. This is their standard geographic region for disseminating labour force data at the regional level and it is a combination of several ‘suburbs’.
In the last update published in this blog post – Worst is over for Australian workers but a long tail of woe is likely due to policy failure (June 16, 2020) – I mapped that data by State/Territory to provided a different visual perspective of the job losses.
These maps take us up to May 30, 2020.
I will update these maps when the latest data is released on July 30, 2020.
Conclusion
For a time, the initial job losses that followed the lockdown restrictions were abating, particularly in the obvious sectors like Accommodation and food services sector, and to a lesser extent, the Arts and recreation services sector.
But in the last week of June, there were renewed job losses, which I think arise from two broad reasons.
The first reason, is that Victoria has resumed its lockdown in the face of a virulent second wave of the virus.
The second reason is more disturbing from a longer-term perspective (without making medical judgements about the virus) and relates to business failure and a hollowing out of full-time, prime-age jobs.
It is clear that the prime-age workers have not rebounded from the initial job losses.
And the Labour Force data showed last week that full-time employment continued to go backward as part-time jobs rebounded (somewhat).
I confirm my judgement back in late March, when the Federal government introduced its stimulus packages that the fiscal support is inadequate and poorly targetted.
There is an urgent need for large-scale job creation to shore up demand and minimise the number of businesses that will disappear.
That is enough for today!
(c) Copyright 2020 William Mitchell. All Rights Reserved.
“There is an urgent need for large-scale job creation to shore up demand and minimise the number of businesses that will disappear.”
Another option which we should add to the list is to retire people earlier. Covid hits older people harder than younger people. The whole lockdown process across the world has throw the entire neoliberal “dependency ratio” calculation out of the window. We can clearly afford to retire people earlier, and by doing so we allow them to keep out of the way so that younger people can get back to operating a full capacity.
It’s time to reverse the long trend towards later and later state retirement ages. We have a health reason as well as an economic reason.
That’s an interpretation observation Neil, of the part Pensioners could play in the aftermath of the pandemic. As regards their impact thus far it seems that age-related fears have already contributed to middle-aged and older people deciding in larger numbers to leave the workforce.
Those same fears have contributed to large falls in spending (apart from necessities) and the freeing of a huge number of NHS resources that would otherwise have been consumed if the older generation weren’t so petrified of visiting medical centres and hospitals.
The construction industry has prospered, not only from government largesse but also because many locked-down households have decided to spend on repairs some of their reduced but otherwise unspendable income.
And we must not overlook the fact that many of those who have perished from the virus were among the elderly fraternity, thus freeing further sums in legacies.
The problem that the government faces is very much a question of what to do with a mainly younger society, many actively involved in service industries that are no longer viable.
If we assume that many will never be able to return to former types of employment, the solution doesn’t just lie in producing work-related occupations, but in what type of work and therefore, what type of future.
No group of society, especially the young will accept for long the concept of a commune type existence to satisfy some political motive to embrace full-employment. They would prefer to endure a period of uncertainty, and a certain amount of deprivation, if that ensured their independent claim to shape their own future.
Bill’s ongoing work is quite sufficient to paint the big picture as it comes into focus. It’s no surprise that the Covid pandemic has been exploited by the neoliberal status quo to further escalate the switching of decent jobs to BS jobs, creating what the neoliberals hope will become “a new normal” gradually accepted by the masses into whom TINA thinking has been drummed. Personally, I like to think that MMT involves a switch of its own, substituting three letters of hope for TINA’s four of despair. The JG proposal, for example, offers the most elegant and efficient way to weather the Covid pandemic with its anticipated spikes and possible mutations. Instead of BS jobs replacing decent jobs, decent jobs would be created that can seamlessly pay people to stay home when necessary as well as work when public health conditions permit. So I ask you, have MMT economists been bold and creative enough to expand their JG proposal to address the novel employment situation suddenly created by the Covid pandemic? Should the JG remain merely a matter of productively using the buffer stock of the unemployed/underemployed, remain merely a supplementary, fluctuating response to periodic downturns in private employment, or should the JG be re-envisioned in far grander terms as the ONLY mode of employment that now makes sense in the on again/off again work world facing us for the foreseeable future? And if the not-so-hidden agenda is to continue to switch BS jobs for decent jobs, who dares to believe that the neoliberal status quo would EVER bite on a public employment option offering decent jobs OF ANY KIND to the masses, even if it does so only partially and intermittently, even it operates only at the semi-skilled, minimum wage level?
“It’s time to reverse the long trend towards later and later state retirement ages. We have a health reason as well as an economic reason.”
But what about the covid-19 rescue package debt that will “take generations to repay and make a return to surplus impossible for a decade….” , as reasoned by an economic genius on the ABC 7.30 TV program tonight.
I think Newton, you highlight one of the fundamental problems associated with any move from a free-market job situation to something that allows a JG to operate successfully.
Up to now the blame for (under) employment has been laid firmly at the door of a capitalist clique that supposedly want to retain elite power over the masses; the many bank bail-outs adds rancid evidence to this belief.
But there has to be more to this than capitalist depravity.
The situation now is as clear cut as it has been in a lifetime. We know the jobs lost and the sectors involved. We believe we have the tools to eradicate the problem.
Well go ahead someone, tell us where the new jobs are. Tell us how to exploit that opportunity and the pathway we must follow to achieve the stability we hope for.
And by the way, you will need people with organisational and commercial flair to fulfil that dream. Have you brought them on board yet and explained that where commercial exploitation and humanitarian principles clash which, and to what extent , one must hold sway over the other.
And what about the workers: how much freedom do they have over the work they do – after all, we will be chasing targeted GDP growth rates (or is the international league table now an irrelevancy).
So come on, let us have some means of measuring how well the targets are being met, give us a pathway we can follow and some landmarks to pinpoint our progress.
That would be a much better approach than the blame culture that surrounds a Capitalist system we already know has major flaws – just like all the other systems that depend on human design.
Newton et al.
If you haven’t read Tony Barnett’s excellent essay, ‘Out of The Belly of Hell’ – and his commentary of neoliberalism, I very much recommend it.
If Bill permits, a link to a pdf.
https://drive.google.com/file/d/1Q_3hKjy3ncH26nOOvUkCevmWSVbi0pmz/view
Gogs, I very much like your reasoned call for some common sense metrics to guide and measure our economic progress from this UNPRECEDENTED point forward. Until now, the relentless response to those who have advocated for programs or policies to benefit the average citizen (not to mention the desperately poor) has been, of course: “How will you pay for them?” In other words, DETAILS have been demanded, albeit within an erroneous framework of a household economy. Your suggestion that we now return the favor and ourselves ask for details about the proposed recovery–how will THEY measure, monitor, evaluate it, etc.?–is but an application of the old saying about the goose and the gander. By the way, there’s a missing “if” that should come immediately after the word “even” in the last clause of my prior comment. I fear I’m getting too old to comment on blogs that don’t allow for editing. But then again, maybe I’m not old enough to let go of the metric of perfection, in light of the wisdom of your concluding observation that everything human has flaws.
Thank you, Mark, for alerting me and others to an extremely thoughtful and guardedly encouraging take on where we are, how we got here, and where we may be going. With the sole exception of the author’s implicit endorsement of the the official 9/11 narrative, I eagerly moved through Barnett’s comprehensive analysis, reliving the history I lived through and winding up at much the same place as “Out of the Belly of Hell.” I urge other readers of Bill’s blog to take the time to give this illuminating article a serious read.
You’re welcome. I have to agree re 9/11. It appears Newton’s Third Law hasn’t resonated with some commentators yet, and almost two decades on, I’m not that hopeful it ever will.
Thanks to Mark for the link to Barnett’s essay. I’ve not yet read all of it but I will.
It has been clear for some time globalization is at the source of pretty much all of the ills in the West. It is central to huge disparity in wealth and income in our societies. I believe this income and wealth disparity is the reason for near zero interest rates, the asset booms of the last 50 years and near zero goods inflation.
We all blame the neoliberal elites for imposing this upon us. We feel powerless. We drift along as if we have no agency.
However, the fundament to power is taking responsibility, taking responsibility for what has been and what is. When you can say “I did this” then you can say “I can change this”.
It is all too easy to blame the “elites”, the one percenters.
How was globalization facilitated? It was facilitated by governments. Who put the these governments in power? We did.
Ok, so the influence of the elites and their lobbyists worked these elected governments to the point of yielding effective control to these elites.
But this should be no excuse for our complacency and indifference. We are distracted by providing for our lives, yes. But this also should be no excuse.
I believe the man in the street has to take responsibility for the way things are. He can then say “I can change this – I want this.”
Change will come not from the elites shifting who they are or the way they are but from the man in the street being consciously committed to change and believing he has the power to change the world.
The man in the street has first to change what is within.