The Australian Bureau of Statistics (ABS) released the latest labour force data today (June 19,…
Payroll employment falling again as second-wave and inadequate policy response bites
Last week, the Australian Bureau of Statistics released the latest data – Retail Trade, Australia, Preliminary , July 2020 – which showed that retail turnover in July 2020 had risen by 3.3 per cent, the second month of improvement since it fell off a cliff in the two months from March. The exception was for Victoria, which is now in Stage 4 lockdown, which caused retail sales to fall by 2 per cent. Today, the ABS released the latest data for – Weekly Payroll Jobs and Wages in Australia, Week ending 8 August 2020 – which gives us the most up-to-date picture of how the labour market is coping with the on-going restrictions and the reimposed of harsh Stage 4 restrictions in Victoria. Unsurprisingly, payroll employment fell in the fortnight ending August 8, 2020 in Victoria by 1.6 per cent. But what was also surprising was that employment fell in every other state or territory bar Tasmania and ACT. The Victorian case is about lockdown. The other declines are about failed macroeconomic policy, which goes to the performance of the federal government. Regular readers will know that I have routinely analysed this dataset ever since it first became available in March this year. It uniqueness is that it provides the most recent data upon which an assessment of where the labour market is heading. The data shows that after a partial recovery from the downturn, payroll employment is declining again. The fact that the first recovery period failed to regain the jobs lost was an indicator that the policy intervention was insufficient. The second-wave job losses tell us clearly that that more needs to be done by the Federal government. I am not holding my breath.
Relevant blog posts as I trace this data trail over time are:
1. “We need the state to bail out the entire nation” (March 26, 2020).
2. The government should pay the workers 100 per cent, not rely on wage subsidies (March 30, 2020).
3. A Job Guarantee would require $A26.5 billion net to reduce the unemployment rate by 6 percentage points (April 30, 2020).
4. Latest employment data for Australia exposes Federal government’s wilful neglect (May 5, 2020).
5. The job losses continue in Australia but at a slower pace (May 19, 2020).
6. Worst is over for Australian workers but a long tail of woe is likely due to policy failure (June 16, 2020).
7. Latest Australian payroll data suggests employment damage from shutdown is worse than thought (July 20, 2020).
8. Australia’s job recovery stalling and soon to head south again (August 12, 2020).
In terms of the coverage of the ATO Single Touch Payroll data, the ABS report that:
Approximately 99% of substantial employers (those with 20 or more employees) and 71% of small employers (19 or less employees) are currently reporting through Single Touch Payroll.
Broad assessment
1. The most recent monthly Labour Force data showed that while total employment increased 114,700 (0.9 per cent), with full-time employment increasing by 43,500 and part-time employment increasing by 71,200 – see my review – Australian labour market improvement moderates before the Stage 4 Victorian storm is about to hit (August 13, 2020).
2. The Labour Force data was based on a survey that ended around the second-week of July, so by the time the data is published it is a month out of date.
3. Today’s payroll data from the Australian Tax Office (ATO) records takes us up to August 8, 2020, which means it is more representative of where we are at now (although still two weeks out of date).
4. In the period after the last Labour Force survey, the Victorian government has responded to the escalating coronavirus infection numbers by introducing Stage 4 restrictions, which are now 3 weeks into a projected 6 week period. Today’s data gives us some insight of the early impacts of this policy shift.
5. The assumption by the Federal government that the economy would be rebound quickly is ill-founded. There is mounting evidence that many businesses will not ‘make it across’ the lockdowns, especially given that Victoria is back in tight lockdown and NSW and Queensland are struggling to avoid going down the second-wave lockdown route.
That is the background to analysing the latest payroll data.
Jobs recovery appears to have stalled
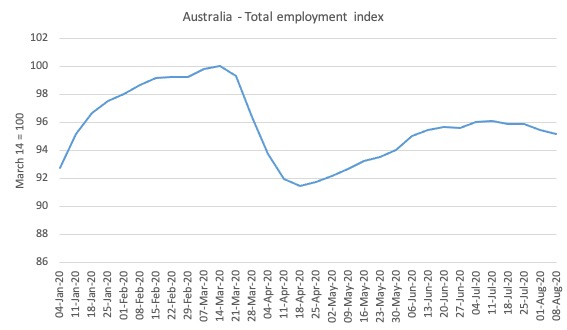
Here is what has happened to total employment in Australia since January 4, 2020 (the ATO data starts at the beginning of the year). The index is based at 100 on March 14, 2020 which appears to be around the peak employment, although it was slowing since February 29, 2020.
Overall, there has been a 4.8 per cent contraction between March 21, 2020 and August 8, 2020. The first trough came in the week ending April 18, 2020 and the total employment loss was 8.5 per cent.
As the lockdowns were eased, employment started to return until July 11, 2020, after which there was a 0.9 point contraction since.
The renewed job attrition was expected, given the severity of the Stage 4 lockdown in Victoria.
The policy response from the Federal government to this renewed labour market deterioration has been NIL! Go figure.
What does this imply?
We can do some ‘back-of-the-envelope’ calculations with some assumptions to see what this might imply.
- The Labour Force survey is usually completed by the 11th day of each month.
- The most recent Labour Force release showed that in the four weeks to July 11 (about) total employment rose by 0.9 per cent or 114.7 thousand, unemployment rose by 15.7 thousand and the participation rate rose by 0.6 points. That meant that the labour force rose by 130.5 thousand. Of course, since March 2020, the labour force has fallen by 235.2 thousand.
- If added those workers who have left the labour force due to a lack of employment opportunities back into the official unemployed, the unemployment rate would have been 9.1 per cent rather than the reported 7.49 per cent.
- What the latest ATO data shows, is that total employment has fallen by 0.9 points in the three weeks since the last Labour Force survey was completed – which based on the current labour force data would amount to a further 121 odd thousand jobs being lost.
- If we assumed no change in participation, but added the hidden unemployed who left the labour force in April back into this revised estimate of the official rate, then the adjusted unemployment rate would be around 10 per cent.
So this information (which is 2 weeks later than the last Labour Force data) suggests that recovery has stalled and there is considerable downside risk for the labour market.
Gender trends
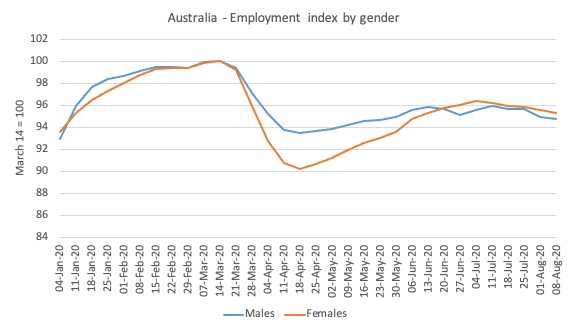
Here is the same series decomposed by gender.
While the pattern was almost identical for males and females up to March 22, 2020, the data for the earlier parts of April showed that the crisis was impacting disproportionately on females.
This bias was driven by the occupational segregation that has women dominating the sectors that were most impacted by the lockdown (accommodation, hospitality, cafes, etc)
As the lockdowns eased and businesses reopened, women started to gain jobs at a faster rate than men.
As the recovery has stalled both sexes are being impacted more or less evenly.
The accompanying ABS – Press Release – notes that:
Payroll jobs fell by 1.0 per cent over the month to 8 August … Over the month to 8 August, payroll jobs fell by 2.8 per cent in Victoria. Some of the initial impacts from the Stage 4 restrictions, are shown in the latest weekly data as they came into effect …
Around 39 per cent of jobs lost in Victoria by mid-April had been regained by 27 June, but by early August this had reduced to 12 per cent.
Nationally, payroll jobs at 8 August were around 4.9 per cent below mid-March, when Australia recorded its 100th confirmed COVID-19 case. The latest data showed that after an initial period of recovery between mid-April and mid-June, payroll jobs losses had remained between 4 and 5 per cent below mid-March.
By 8 August, around 43 per cent of payroll jobs lost across Australia by mid-April had been recovered. Close to half (52 per cent) of jobs worked by women had been regained, compared to 19 per cent for males.
As the lockdowns eased, the question was now how quickly the jobs would recover and how many businesses had been lost altogether. The persistence of the unemployment created by the pandemic was dependent on the number of businesses that failed.
The question now, as the situation declines again, is what the hell is the federal government doing about this disaster?
The answer to that question is nothing significant.
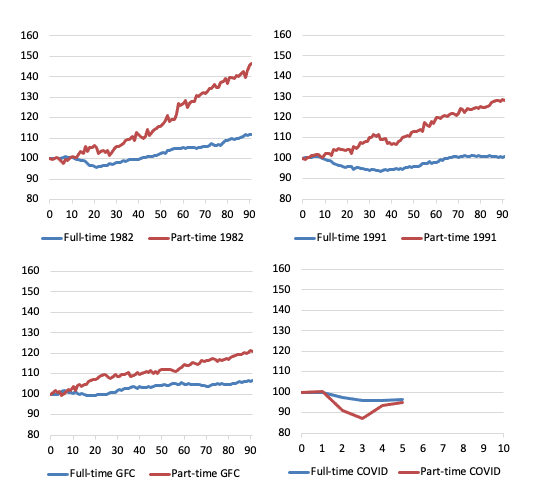
Which then brings us to the following butterfly graphs, which are constructed from ABS Labour Force data. They demonstrate why more fiscal stimulus aimed at job creation is required.
They show for full-time and part-time employment indexes set at 100 for the peak in total employment in the downturns for 1982, 1991, GFC and now the COVID-19 cycles.
For the first three events, they show the trajectory for 90 months after the peak, capturing the dynamics of the cycle.
The pattern in a usual downturn are demonstrated in the first three episodes – even as full-time employment declines as the recession bites, part-time employment continues to grow for a while, until it becomes obvious that the recession is deepening.
At the peak before the 1982 recession, the ratio of part-time to total employment was 16.2 per cent. By the time, full-time employment had reached the peak level again (after 41 months following the peak), the ratio was 17.6 per cent (and rising).
The 1991 recession was particularly bad and there was a major shift away from full-time work. At the peak before the 1991 recession, the ratio of part-time to total employment was 21 per cent. By the time, full-time employment had reached the peak level again (after 65 months following the peak), the ratio was 22.3 per cent (and continuing to rise).
The GFC event was reduced in intensity by the substantial fiscal stimulus that the Federal government introduced. But the part-time ratio still rose and full-time employment took 23 months to return to its pre-GFC peak. The part-time to total ratio in February 2008 (peak before the downturn) was 28.3 JobKeeper cent. After 23 months, the ratio had risen to 30.1 per cent.
While the ratio is rising on a trend basis as the labour market is increasingly casualised and job protections are wound back under the aegis of government policy designed to tilt the playing field towards the employers, there is an acceleration in the ratio during recessions when employers scrap full-time work and replace it in the recovery with part-time, fractionalised and insecure work.
The COVID episode is different given the nature of the job loss – lockdowns – which have directly impacted on the sectors where part-time work dominate.
But it is clear from the observations we have (lower-right panel) from the peak in February 2020 until July 2020, that as the lockdowns were eased, part-time employment rebounded but full-time employment continues to decline.
Experience tells me that that suggests that there have been major business failures which will leave a legacy of elevated unemployment.
Wages paid declining again
The ABS report that between March 14, 2020 and August 8, 2020:
Total wages paid decreased by 6.2%.
Since the week-ending July 4, 2020, total wages paid have fallen by 4.5 percent as the new downturn began.
Which suggests the worst is far from over.
Age breakdown of Job Loss
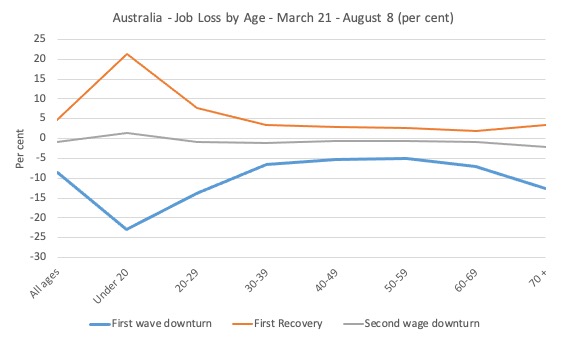
The age breakdowns for Australia as a whole are shown in the next graph.
I have now decomposed the data into the job loss period (First wave downturn), the first recovery period and the Second wage downturn.
It is clear that our youth bore the brunt of the First wave downturn, largely due to the industrial composition of the job losses – services, accommodation etc.
Their jobs also recovered more quickly.
The other insight from this graph is in noting that the prime-age workers lost about 4 per cent of their employment during the First wave downturn period but in the period since the lockdowns have been eased, their first-stage recovery was very muted.
This links with the full-time, part-time analysis above and is suggestive of a conclusion that businesses have disappeared and the recession will be worse than the government has allowed for in their policy support.
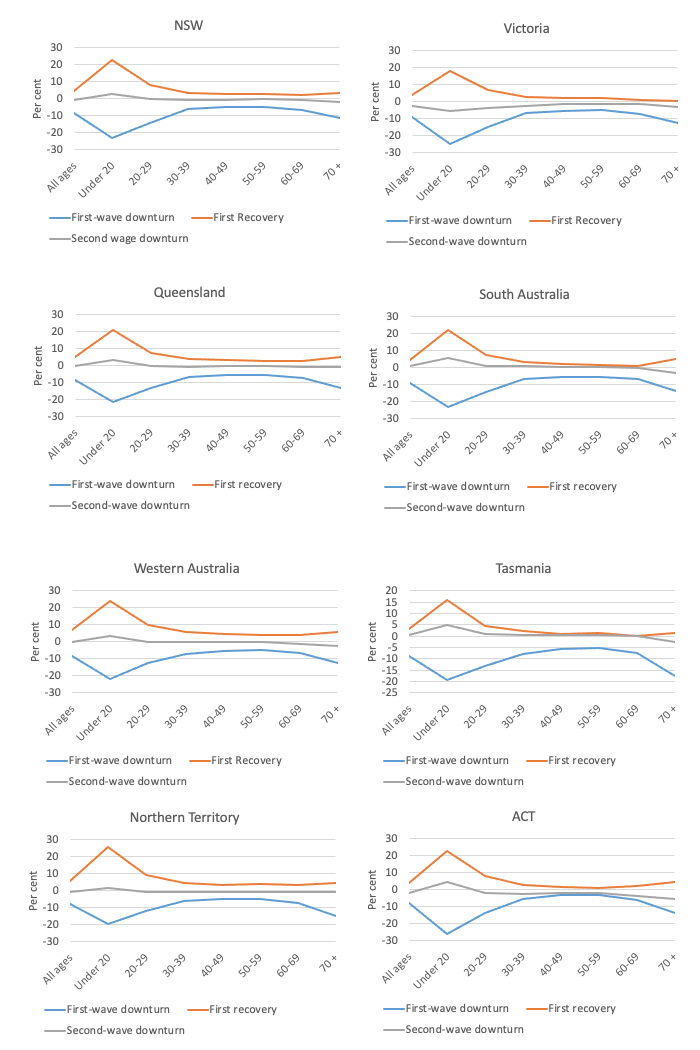
The following sequence of graphs gives the age profiles of the job loss for each State/Territory – be careful to appreciate the difference in the vertical scales.
But for most states and territories, the teenage job loss in the descent was in excess of 20 per cent and many were not being supported by the JobKeeper wage subsidy because of their casual status.
The recovery was very muted for teenagers but much worse for the prime-age workers (as above).
The new period of downturn is still early and clearly not as severe as the First-wave downturn – yet.
Industry job loss breakdown
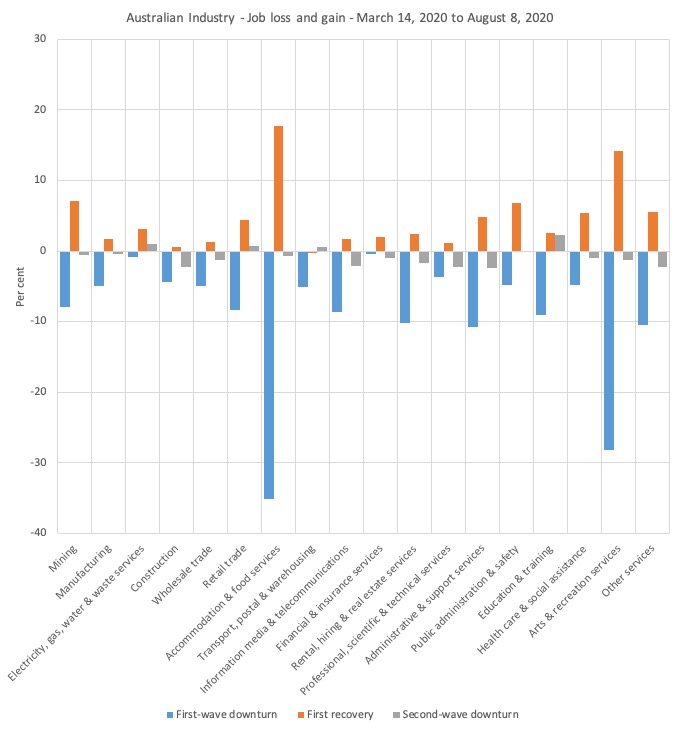
The following graph shows the percentage decline in employment between March 21, 2020 and April 18, 2020 for the Australian industry sectors (First-wave downturn), the First recovery period, which ended on July 25, 2020, and the Second-wave downturn up to August 8, 2020.
The turning points are based on the overall industry aggregate behaviour.
The worst hit sectors were Accommodation & food services (decline of 35.1 per cent) and Arts & recreation services (decline of 28.2 per cent).
The first stages of lockdown easing have allowed some cafes etc to open, which is why employment in the Accommodation and food services has rebounded by 17.2 per cent since April 18, 2020. The Arts and recreation services sector has recovered by 13.1 per cent.
But the pace of the First recovery was insufficient to regain all the jobs lost in the First-wave downturn before the Second-wave downturn began.
In addition to the Stage 4 lockdown in Victoria as it deals with the second wave of the virus, the other dynamics are reflecting factors that have arisen from the wider impacts of the lockdowns as the damage permeates the supply chain across the industrial structure.
The deeper this cross-industry penetration the worse the longer lasting effects will be.
State job loss breakdown
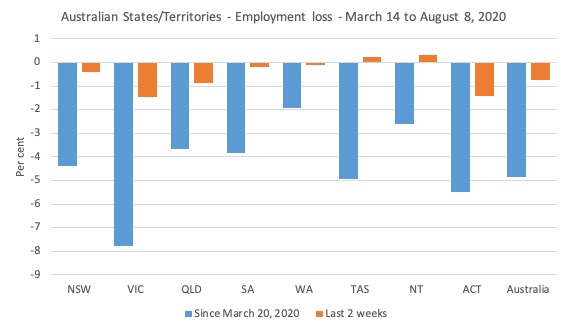
The following graph shows the employment losses from March 14, 2020 to August 8, 2020 for the States and Territories (blue bars), while the orange bars shows what has happened over the last 2 weeks.
Clearly the renewed lockdowns are impacting on Victoria. But it is worrying to see the recovery stall in several other jurisdictions.
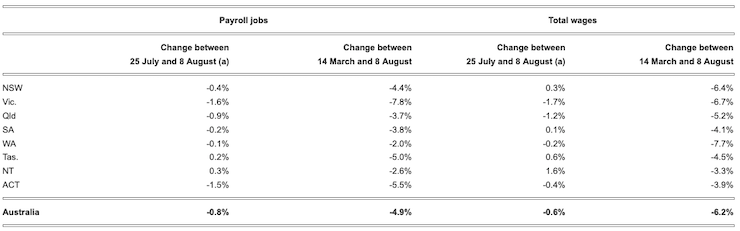
This table comes from the ABS Table 1 – and shows the summary of the outcomes for states and territories for various periods.
Conclusion
Troubled times but clearly indicative of a failing policy stance by the Federal government who think their miserable fiscal intervention in March and April would be sufficient.
The fact that the first recovery period failed to regain the jobs lost was an indicator that the policy intervention was insufficient.
The second-wave job losses tell us clearly that that more needs to be done. I am not holding my breath.
That is enough for today!
(c) Copyright 2020 William Mitchell. All Rights Reserved.
Just some observations and comments if I may?
1. The “recovery” is clearly dependant on the control of the virus. Stronger international border quarantine while not infallible is critical to this. In palming this off to the states the Commonwealth has failed to protect it’s citizens (don’t mention Aged Care). A strong, consistently designed and managed system across all states was needed. The Army was logistically well placed to provide the lead. In the absence of this, the locking down of state borders is the only way to stop the weakest (unluckiest) state from undermining stronger (luckier) ones. The effect of these state border lockdowns on the economy is according to the Federal Government wreaking havoc on the economy, however it chooses to remain idle on quarantine?
2. In Qld we have been lucky with numbers. This being so, Covid-19 still impacts some sectors, evidenced by lower occupancy at pubs, clubs, cafes, restaurants and theatres. In movie theatres the fact that there have been no new releases has stifled any recovery. I have heard that a typical day has gone from 1000-2000 to fewer than 100 patrons. A new release this past week took those figures to around 300 per day, still far short of the norm. The recent cluster brought from Melbourne saw even those numbers drop immediately, where there had been 100 patrons per day, they dropped to 40. So even in the absence of any strict rules, certain businesses remain affected mainly by fear.
It is not coincidental that these sectors are indicated by the massive job losses in the tables above. These industries also have higher casual and female staffing levels. The restrictions to the Jobkeeper system in my opinion are directly responsible for excessive job losses in these sectors. There is also evidence that what work exists is being preferentially given to those workers that were eligible for Jobkeeper over other casual employees that did not. Perhaps this explains the higher job losses in the youth? That there is no tailored package for these industries shows a Government that doesn’t care and is asleep at the wheel.
3. In terms of the building industry, in which I have worked for 32 years, the signs of impending job losses (as reported by the Design Professionals) were there late last year and this year pre-Covid. That is not to say some further projects were put off as a result of Covid, but rather that a good proportion of the losses in that sector may have occurred anyway due to the poor state of the economy. In fact it would be safe to say that those concerns were much greater this year than leading up to 2009.
4. Tourism and Education are two of the biggest industries for bringing foreign money into Australia. One would assume that they would be critical to any post-Covid revival. The fact that there has been no direct package for the Tourism sector is abysmal. The industry body has made comment that 172,000 businesses had less that one month’s cashflow left. How a government could do nothing is unfathomable!
The bizarre treatment of the University sector and the students that remain in the country is nothing short of letting the bull off in a china shop! The denial of Jobkeeper will reduce the intellectual capacity of the system. The fact that many international students were told to leave, and those that didn’t have received no support has led to 60% saying they would warn others from studying here. This seems to be a night of book burning that will severely weaken our third largest exporter!
Instead of a Government that puts the shoulder to the wheel to actively support and protect its’ citizens we have a Government of announcements (https://twitter.com/danilic/status/1296749615232872448?s=09). Such a pity!
Hi Bill,
Re the Total Employment Index graph, apologies if I missed the explanation, but why was this index at roughly the same level in January as it was at the trough of the first lockdown?
Cheers,
Anthony
Bill, I know you need to write this to get your take on all this recorded for posterity, which is very important.
OTOH, I just can’t read this any more.
It is so totally depressing to read, now that I know that TINA was always a lie.
There are other things the Gov. of Aust., the UK, or the US can do, but choose NOT to do.
It makes my heart sick to red it, so I just can’t.
.
So apparently the UK has hired Tony Abbott to spearhead international trade deals.
I can hear the laughing down under from here.