It's Wednesday and we have discussion on a few topics today. The first relates to…
Australian economy collapses and the federal government goes missing
Well now we have a better estimate of how far short the Australian government’s fiscal stimulus was when they introduced the packages in March and April. Massively short is the answer. The latest data release from the Australian Bureau of Statistics of the – Australian National Accounts: National Income, Expenditure and Product, June 2020 (released September 2, 2020) – is now recording the first three months impact on production and income generation of the lockdowns. The Australian economy collapsed basically, contracting by 7 per cent. Household Consumption expenditure fell sharply as households dramatically increased the saving ratio. The wage share fell below 50 per cent for the first time in recorded history as government support favoured profits. The obvious conclusion is that the Federal government has not supported an ailing economy enough to avoid the damage that negative growth brings. An urgent and major shift in fiscal policy towards further expansion is definitely required. But the government announced this week that they are withdrawing financial support and the result of that policy shift will be carnage!
The main features of the National Accounts release for the June-quarter 2020 were (seasonally adjusted):
- Real GDP decreased by 7 per cent for the quarter. The annual growth rate was minus 6.3 per cent, well below historical trend of between 3.25 and 3.5 per cent.
- Real GDP per capita declined by 7.2 per cent for the quarter, 7.4 per cent for the 12 months.
- The main negative contributor was household consumption expenditure (minus 6.7 points).
- Australia’s Terms of Trade (seasonally adjusted) rose by 0.2 per cent in the quarter but was down by 1.8 per cent over the 12 month period.
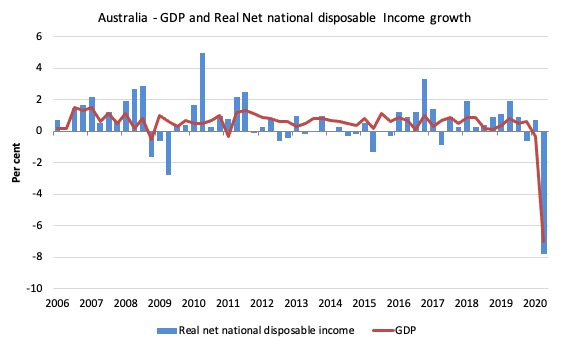
- Real net national disposable income, which is a broader measure of change in national economic well-being fell by 7.8 per cent for the quarter and 6.9 per cent for the 12 months, which means that Australians are worse off (on average) than they were at that point 12 months ago.
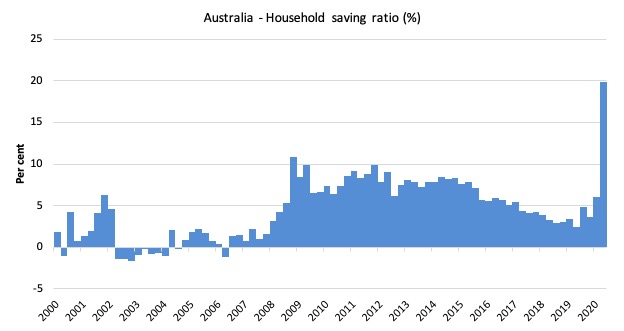
- The Household saving ratio (from disposable income) rose sharply from 5.5 per cent to 19.8 per cent as the uncertainty over employment and health rose.
Overall growth picture – first recession in nearly 30 years
The ABS – Press Release – said that:
Australian Gross Domestic Product (GDP) fell 7.0 per cent in the June quarter, the largest quarterly fall on record … This follows a fall of 0.3 per cent in the March quarter 2020.
… The global pandemic and associated containment policies led to a 7.0 per cent fall in GDP for the June quarter. This is, by a wide margin, the largest fall in quarterly GDP since records began in 1959. …
Private demand detracted 7.9 percentage points from GDP, driven by a 12.1 per cent fall in household final consumption expenditure. Spending on services fell 17.6 per cent, with falls in transport services, operation of vehicles and hotels, cafes and restaurants … The June quarter saw a significant contraction in household spending on services as households altered their behaviour and restrictions were put in place to contain the spread of the coronavirus …
Net Trade contributed 1.0 percentage points to GDP. Imports of goods fell 2.4 per cent, with falls in consumption and capital goods reflecting weak domestic demand. Imports of services fell 50.5 per cent and exports of services fell 18.4 per cent, due to restrictions on travel and tourism.
Public demand contributed 0.6 percentage points to GDP, driven by health related spending by the state and local government. Defence spending also increased as personnel were deployed to assist with management of the COVID-19 pandemic.
So with total GDP falling 7 per cent and government spending contributing just 0.6 percentage points, you get an idea of how far short the fiscal intervention has been.
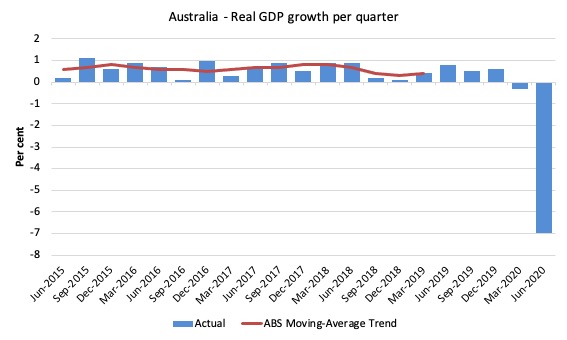
The first graph shows the quarterly growth over the last five years (with the red line being the ABS moving average trend). The ABS has now stopped publishing the trend for the time being given the large swings in performance that will be experienced over the next several quarters.
The massive 2020 outlier renders graphs like this rather binary and suppress the variations in the growth performance in prior quarters.
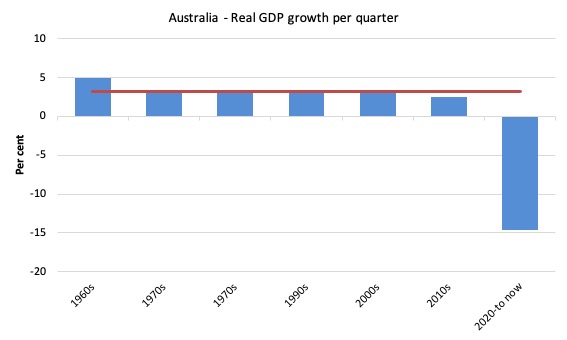
To put this into historical context, the next graph shows the decade average annual real GDP growth rate since the 1960s (the horizontal red line is the average for the entire period (3.2 per cent) from the June-quarter 1960 to the June-quarter 2020).
The 2020-to-now average is obviously just the March- and June-quarter 2020 average.
I put the data labels in the graph because it is harder to differentiate the decades given the flattening effect of the current outlier.
It is obvious then how far below historical trends the growth performance of the last 2 decades have been as the fiscal surplus obsession has intensified on both sides of politics.
Even with a massive household credit binge and a once-in-a-hundred-years mining boom that was pushed by stratospheric movements in our terms of trade, our real GDP growth has declined substantially below the long-term performance.
Analysis of Expenditure Components
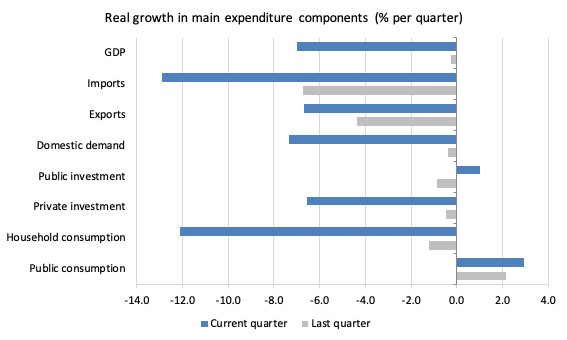
The following graph shows the quarterly percentage growth for the major expenditure components in real terms for the March-quarter 2020 (grey bars) and the June-quarter 2020 (blue bars).
Points to note:
1. The pre-Pandemic growth performance was already weak, a point that the Government should recognise when calibrating the appropriate size of the stimulus to deal with the health crisis.
2. Household Consumption expenditure fell by 12.1 per cent in the June-quarter and by 12.7 per cent over the 12 months.
3. General goverment consumption expenditure rose by 2.9 per cent in the June-quarter and by 7.5 per cent over the 12 months.
4. Export expenditure fell by 6.7 per cent in the June-quarter and by 10.6 per cent over the 12 months. However, the decline in import expenditure for the quarter was 12.9 per cent and 19.1 per cent over the year.
5. Private investment expenditure growth declined by 6.6 per cent for the quarter. It has declined every quarter since the June-quarter 2018. It declined by 7.6 per cent over the 12 months.
6. Public investment rose by 1 per cent for the quarter as the big public infrastructure projects (State government – large transport projects mainly) start to taper. Over the 12 months public investment spending rose by 1.8 per cent, which given the scale of the private demand loss is a massive shortfall.
Contributions to growth
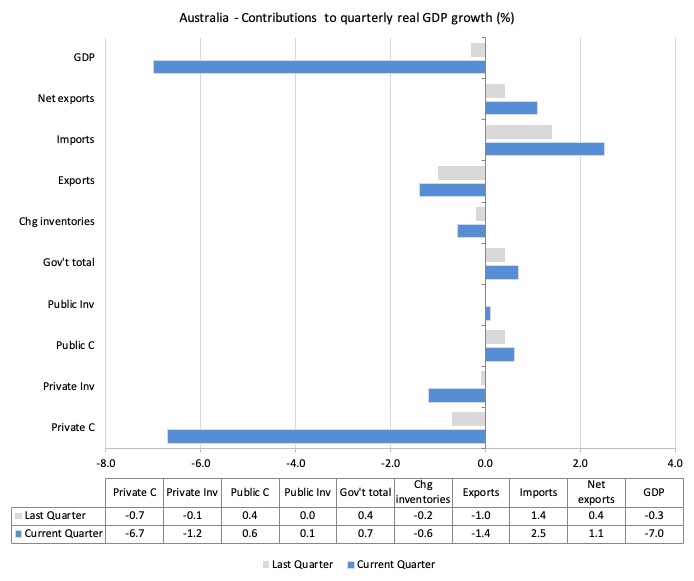
What components of expenditure added to and subtracted from the 7 per cent decline in real GDP growth in the June-quarter 2020?
The following bar graph shows the contributions to real GDP growth (in percentage points) for the main expenditure categories. It compares the June-quarter 2020 contributions (blue bars) with the March-quarter 2020 (gray bars).
In order of contribution:
1. Household consumption expenditure contributed minus 6.7 points to the overall growth decline result as households withdrew and saved more.
2. Private investment expenditure undermined growth by 1.2 points.
3. Growth in inventories contributed minus 0.6 points. This is related to firms stockpiling (unsold stocks).
4. Public consumption contributed 0.6 points and public investment 0.1 points. Overall, the government sector contributed 0.7 points.
5. Net exports added 1.1 percentage points – you may wonder how given that exports contributed only 0.4 points. The answer is that falling imports added 2.5 points (remember imports are a drain on expenditure).
Material living standards fell significantly in June-quarter 2020
The ABS tell us that:
A broader measure of change in national economic well-being is Real net national disposable income. This measure adjusts the volume measure of GDP for the Terms of trade effect, Real net incomes from overseas and Consumption of fixed capital.
While real GDP growth (that is, total output produced in volume terms) contracted by 7 per cent in the June-quarter 2020, real net national disposable income growth fell by 7.8 per cent.
How do we explain that?
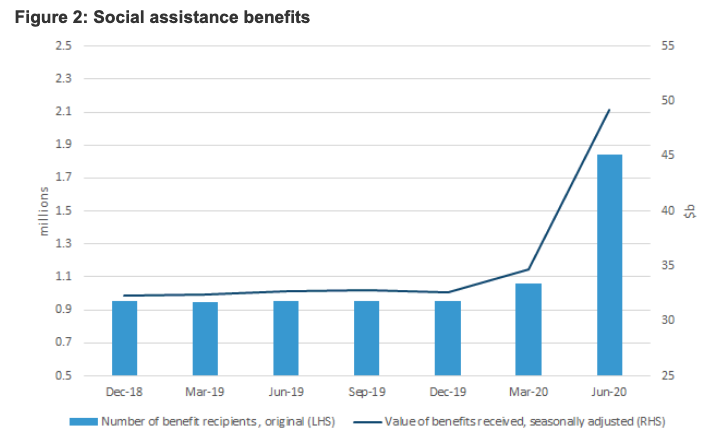
There was a rise in Household disposable income (2.2 per cent) that was driven by a substantial increase (41.6 per cent) in social assistance benefits “due to an increase in the number of benefit recipients and additional COVID-19 related support payments including, the coronavirus supplement (additional $550 payment) and the initial Economic support payment (one off $750 payment).”
The ABS also noted that:
Household compensation of employees fell 2.2%, the largest decline recorded in the national accounts, reflecting steep declines in employment and hours worked.
Taken together we get the 7.8 pre cent decline.
So, despite what neoliberals have been claiming for years, government assistance does increase material prosperity although the loss of wages has outweighed the social assistance measures introduced by the government.
The following graph shows the evolution of the quarterly growth rates for the two series since the June-quarter 2006.
The rise in social assistance payments
To provide more insight into the government support for real disposable income this graph (produced by the ABS) is rather emphatic.
Household saving ratio rises – as households refrain from consumption
The two elements – rising gross household disposable income and a sharp contraction in household consumption expenditure – led to a sharp rise in the household saving ratio to 19.8 per cent.
Ultimately, the credit-fuelled and draw down on saving cannot be sustained. The impacts of the coronavirus (lost income) have exacerbated the tension households have been facing with flat income growth for several years and massive debt levels.
The following graph shows the household saving ratio (% of disposable income) from the June-quarter 2000 to the current period. It shows the period leading up to the GFC, where the credit binge was in full swing and the saving ratio was negative to the rise during the GFC and then the most recent rise.
Commentators are today making a big deal of the ‘historic’ increase in the saving ratio.
But if we take a longer term view of it, the behaviour is less ‘historic’ than we might think. Back in the full employment days, when governments supported the economy and jobs with continuous fiscal deficits (mostly), households saved significant proportions of their income.
In the neoliberal period, as credit has been rammed down their throats, the saving rate dropped (to negative levels in the lead-up to the GFC).
Hopefully, households are paying off the record levels of debt they are now carrying and improving their financial viability.
To put the more recent period into an historical context, the next graph shows the household saving ratio (% of disposable income) from the June-quarter 1960 to the current period.
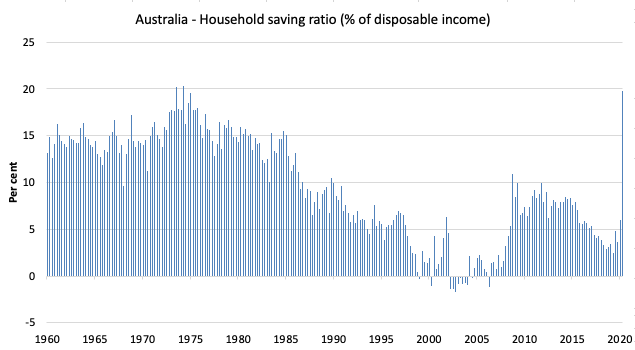
The following table shows the impact of the neoliberal era on household saving. These patterns are replicated around the world and expose our economies to the threat of financial crises much more than in pre-neoliberal decades.
The result for the current decade (2020-) is the average for the March and June observations.
| Decade | Average Household Saving Ratio (% of disposable income) |
| 1960s | 14.3 |
| 1970s | 16.1 |
| 1980s | 12.0 |
| 1990s | 5.4 |
| 2000s | 2.2 |
| 2010s | 6.42 |
| 2020- | 12.9 |
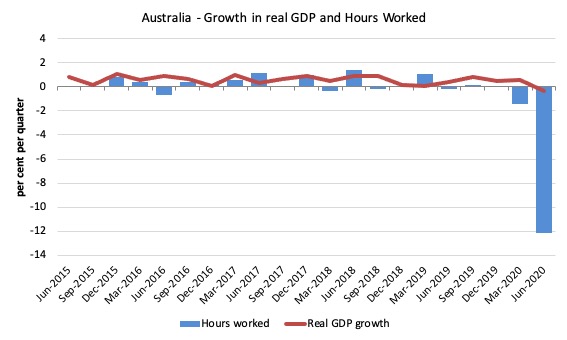
Real GDP growth and hours worked
The following graph presents quarterly growth rates in real GDP and hours worked using the National Accounts data for the last five years to the June-quarter 2020.
The June-quarter data shows the rather dramatic plunge in total hours worked with real GDP following – which means that productivity growth rose quite strongly (4.2 per cent).
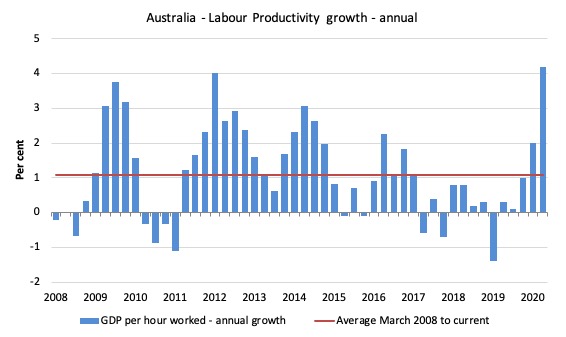
To see the above graph from a different perspective, the next graph shows the annual growth in GDP per hour worked (labour productivity) from the June-quarter 2008 quarter to the June-quarter 2020. The horizontal red line is the average annual growth since June-quarter 2008 (1.1 per cent), which itself is an understated measure of the long-term trend growth of around 1.5 per cent per annum.
The relatively strong growth in labour productivity in 2012 and the mostly above average growth in 2013 and 2014 helps explain why employment growth was lagging given the real GDP growth. Growth in labour productivity means that for each output level less labour is required.
In the June-quarter 2020, annual labour productivity growth rose by 4.2 per cent.
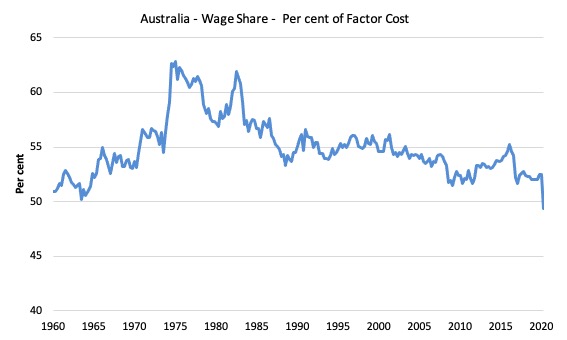
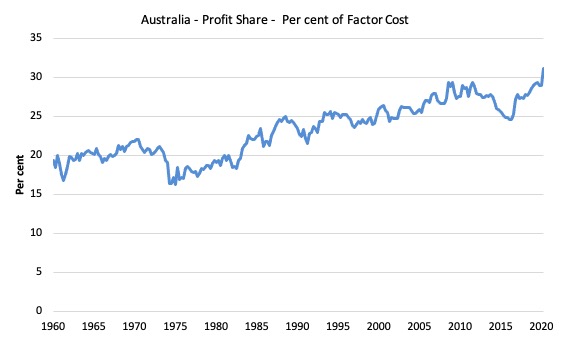
The distribution of national income moves towards profits
The ABS notes that:
Profit share of total factor income reached record high
Government support to business through payment of subsidies resulted in a strong rise in profits. The COE share of total factor income fell below 50%, the first time since September quarter 1959.
COE – is workers’ compensation (wages).
These movements are also being driven by the stronger productivity growth (as hours of work fall faster than output) and the cuts in real wages.
The first graph shows the wage share in national income while the second shows the profit share.
The declining share of wages historically is a product of neoliberalism and will ultimately have to be reversed if Australia is to enjoy sustainable rises in standards of living without record levels of household debt being relied on for consumption growth.
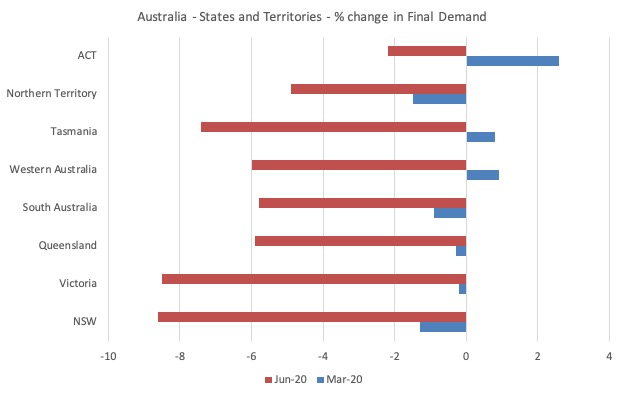
The change in final demand at the State/Territory level
The following graph shows the percentage decline in final demand for the States and Territories. Given the data is three months old, the impact of the second wage lockdowns in Victoria are not evident yet in the data.
Conclusion
Remember that the National Accounts data is three months old – a rear-vision view – of what has passed and to use it to predict future trends is not straightforward.
The decline in real GDP growth in the June-quarter is massive but the September-quarter is likely to be of a similar scale, given the harsh lockdowns since June in Victoria.
The government support has clearly not be sufficient to offset the massive decline in private spending and that is why the economy has taken the largest fall since the 1930s.
A major shift in fiscal policy towards further expansion is definitely required – now and big.
And what is the government doing? They have announced this week they are cutting financial support.
Expectation: carnage.
That is enough for today!
(c) Copyright 2020 William Mitchell. All Rights Reserved.
“And what is the government doing? They have announced this week they are cutting financial support. Expectation: carnage.” Same or worse situation here in the U.S. and in other countries to the extent they operate under the neoliberal paradigm. But I and many others have further expectations beyond carnage: (1) mass suffering, creating (2) mass solidarity, creating (3) mass social uprising, creating (4) governmental collapse, creating (5) space for new forms of government serving people and planet. It’s either the fulfillment of these additional expectations (or something like them) or death, fast by nuclear war or slow by ecocide. Can there be any rational question about how we must respond to this economic/social/existential crisis?
Off Topic,
I see MMT Scotland has changed its name to Modern Money Scotland and announced that Richard Murphy is On the advisory board.
Who’d have thought it ?
I’m delighted that they have taken MMT out of the name. As they certainly won’t be doing MMT when Murphy traps Scotland in the EU. They would never have lived up to the pressure of staying MMT consistent anyway. Murphy ‘s version of MMT lies about what he sees when he looks through the lens. Murphy ‘s Camblewick Green view of how The world should be that ultimately always ends up resembling The Magic roundabout.
The name change allows the positive money members to talk about nothing else but banking. The positive money crowd can now ski off piste and move from underneath the MMT umbrella. Just call it modern money.
Also predicted.
The Common weal can now use their own policies as policies of Modern Money Scotland. That MMT’rs would have never allowed. All their heart of Europe we are going to export our way to growth nonsense and Brussels is going to save us from the Tories claptrap. Don’t be surprised if the drop the JG and start supporting a basic income and then call it a green new deal. Craig Dalzell’s version of a green utopia where everybody sits at home and machines do everything in 2021.
Also predicted.
What really surprised me was that they didn’t just call it what it is – Zippy and Bungle’s Liars Corner of the Common Weal broom cupboard. They won’t be lobbying the SNP. The SNP will use them to further their own agenda until Scotland is trapped in either the EU or EFTA. Wouldn’t surprise me if they get somebody from the SNP On their advisory board it had already been politicised by Cameron Archibald anyway.
That prediction has not happened yet. Only thing that stops it from happening is they don’t win or hold a 2nd referendum.
I hope they do and they get slaughtered when the votes are counted. They now have to convince the majority of Scots to give up London that allows Scotland to run 8% deficits and replace London with Brussels who run surpluses.
Good luck with that. Good luck with that fantasy.
As I understand it, Transfer payments made by the government, including unemployment benefits and other social security payments, are not counted in the Gross Domestic Product. A JG which would see people employed, rather than handed inadequate social security payments by the Australian Government would see the GDP enhanced.
Bill this will be a historical document for these times, we all owe you a great deal for your efforts and wisdom.
The wrong people have clearly been elected to office, yet again.
“Don’t be surprised if the drop the JG and start supporting a basic income”
That’s already part of the game. You can’t have a proper Job Guarantee if you are part of the EU since you will attract every unemployed person across the continent to your area. The EU rules on work have less enforceable restrictions than the EU rules on benefits.
If you support the EU you cannot support a Job Guarantee in a single member state – unless you are prepared to accept mass immigration of all the EEA’s unemployed people.
Neil,
Yup bang on.
I warned everybody about it. I saw with my own eyes what was going on. Why I left. All that’s left now is a bunch of remainers. Who will never shine the lens on the truth.
Yes, you can have leavers and remainers on one condition. You tell the truth when you use the MMT lens.
I’ve already pulled Murphy up about this. Asked him why he lies all the time about it. This was his response.
“I don’t believe the EU will stay neoliberal.” Then a paragraph of fluffy double speak. Honestly it was complete nobsense.
So that will be the narrative moving forward it will go something like this…
We don’t know what the EU is going to do. They could scrap the stability and growth pact and several EU rules and MMT will be welcomed in Brussels. All that Brussels needs to do is learn it and me Richard Murphy is going to teach them it and I will change the European Union from within. So we can’t make any plans in Scotland yet as the EU will change. I am a staunch remainer and Scotland will stay on Richard Murphy’s terms.
Expect plenty of that.
I’ve tried for years to force them to tell the truth. I’ve failed but I’m not going to give up. One day these people will be forced to tell the truth. Stop hiding behind fairy tales.
That’s another reason for the name change to Modern Money Scotland.
It can be whatever they want it to be. They can now cherry pick the lens when it suits them. Common Weal have been desperate to do that.
In the exact same way they cherry picked the MMT Scotland advisory board when it suited them. When it advanced the nationalist remainer cause.
Since for some reason we’re all talking about Scotland there is another path which would be my choice. I owe this to Scotland as my late father’s favourite pastime was watching TV in the evenings with a glass of scotch whiskey and he deserved those few good times.
Scotland adopts it’s own free floating fiat currency and establishes a state owned central bank, The Bank of Scotland, to manage it – thus all the benefits of an understanding of MMT can be applied including a JG. Scottish national taxes are paid to the Scottish national government.
The UK pound would be retained as a transactional level currency (token) including all paper/plastic money and coin transactions primarily due to the large free flow of people, goods and services between Scotland and the rest of the UK. Each individual and business bank account would have UK pound/Euro/Sporin linked sub accounts and it should be possible to transfer funds between these accounts at the latest live exchange rate with zero transaction fees at any time. Most electronic fund transfers including wages would be in Sporin but cash wages would be in UK pounds. Prices for most goods would be advertised in a combination of currencies preferably with live updates but at the consumer retail level advertised in UK pounds. This sounds clumsy but when you shop in many international airports something like this happens now.
Scotland leaves the UK, but cooperates closely especially in areas such as defence – a unified defence including paying a fair share for it could apply. This would give the Scots some leeway over UK foreign policy but at some cost.
Scotland and the rest of the UK become founding members of the European Union of Nations that is basically a minimalist preferential trade zone that other European nations would also be free to join with the aim of one day supplanting the overly centralized EU. National democratic governments each with their own national fiat currencies, are the centres of power in the EUN and if a nation wants free trade or restricted trade or a free market or a more worker owned or state owned economy – so be it. “Italy, Greece and Spain we love you more than the EU?” The EUN and EU could trade and interact in a negotiated, cooperative and mutually beneficial way – eventually?
If the geopolitical/democratic/human rights/judicial environment improves, Russia and other CIS states as well as Turkey and other nations on the continent and periphery of Europe could join the EUN whilst retaining their current independent defence and foreign policy framework. NATO would operate as before and hopefully over time the current face off between NATO and Russia would dissipate.
Now in the current snake pit of local and international politics, greed, narrow self interest, disinformation and ignorance, how much of this can be attained?
And today the PM said that locking in a longer support payment stimulus is “Not responsible” In this case in my opinion he shouldn’t be in charge & his government should not be allowed to exist.