Today (April 18, 2024), the Australian Bureau of Statistics released the latest - Labour Force,…
Federal government cutting spending as payroll data shows employment still in decline
On Tuesday (September 8, 2020), the ABS released the latest data for – Weekly Payroll Jobs and Wages in Australia, Week ending 22 August 2020 – which gives us the most up-to-date picture of how the labour market is coping with the on-going restrictions. This data provides more accurate estimates of the impact of the harsh Stage 4 restrictions that have been imposed in Victoria to address the Second Wave of the coronavirus. Unsurprisingly, payroll employment fell in the six-week period ending August 22, 2020 in Victoria by 2.5 per cent. But what was also surprising was that employment fell in every other state or territory bar South Australia and NT. The Victorian case is about lockdown. The other declines are about failed macroeconomic policy, which goes to the performance of the federal government. The fact that the first recovery period failed to regain the jobs lost was an indicator that the policy intervention was insufficient. The second-wave job losses tell us clearly that more needs to be done by the Federal government. I am not holding my breath.
Relevant blog posts as I trace this data trail over time are:
1. “We need the state to bail out the entire nation” (March 26, 2020).
2. The government should pay the workers 100 per cent, not rely on wage subsidies (March 30, 2020).
3. A Job Guarantee would require $A26.5 billion net to reduce the unemployment rate by 6 percentage points (April 30, 2020).
4. Latest employment data for Australia exposes Federal government’s wilful neglect (May 5, 2020).
5. The job losses continue in Australia but at a slower pace (May 19, 2020).
6. Worst is over for Australian workers but a long tail of woe is likely due to policy failure (June 16, 2020).
7. Latest Australian payroll data suggests employment damage from shutdown is worse than thought (July 20, 2020).
8. Australia’s job recovery stalling and soon to head south again (August 12, 2020).
9. Payroll employment falling again as second-wave and inadequate policy response bites (August 25, 2020).
In terms of the coverage of the ATO Single Touch Payroll data, the ABS report that:
Approximately 99% of substantial employers (those with 20 or more employees) and 71% of small employers (19 or less employees) are currently reporting through Single Touch Payroll.
Broad assessment
1. The most recent monthly Labour Force data showed that while total employment increased 114,700 (0.9 per cent), with full-time employment increasing by 43,500 and part-time employment increasing by 71,200 – see my review – Australian labour market improvement moderates before the Stage 4 Victorian storm is about to hit (August 13, 2020).
2. The Labour Force data was based on a survey that ended around the second-week of July, so by the time the data is published it is a month out of date. The next Labour Force update will be published next Thursday.
3. Today’s payroll data from the Australian Tax Office (ATO) records takes us up to August 22, 2020, which means it is more representative of where we are at now (although still two weeks out of date).
4. The Stage 4 restrictions in Victoria have now been in force for 6 weeks and will be extended for an additional two weeks as the infection numbers fall.
5. The assumption by the Federal government that the economy would rebound quickly is ill-founded. There is mounting evidence that many businesses will not ‘make it across’ the lockdowns, especially given that Victoria is back in tight lockdown and NSW and Queensland are struggling to avoid going down the second-wave lockdown route.
That is the background to analysing the latest payroll data.
Jobs recovery slow but Victoria has gone backwards
The ABS – Press Release – notes that:
Payroll jobs across Australia fell by 0.4 per cent over the month to 22 August … Over the month to 22 August, payroll jobs fell by 2.0 per cent in Victoria while for the rest of Australia, payroll jobs rose 0.1 per cent. While payroll jobs continued to fall in Victoria into the third week of August, it was at a slower rate than earlier in the month.
Nationally, payroll jobs at 22 August were 4.2 per cent below mid-March, when Australia recorded its 100th confirmed COVID-19 case. Payroll jobs in Victoria were 7.9 per cent below the level reported in mid-March, compared with 2.9 per cent for the rest of Australia.
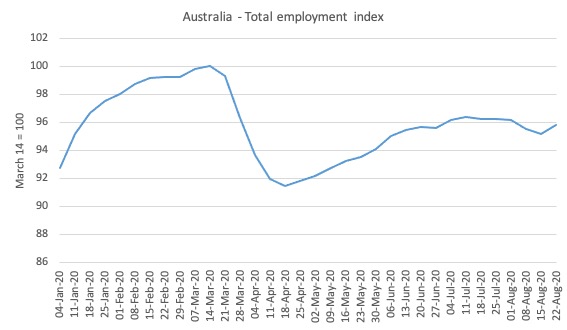
Here is what has happened to total employment in Australia since January 4, 2020 (the ATO data starts at the beginning of the year). The index is based at 100 on March 14, 2020 which appears to be around the peak employment, although it was slowing since February 29, 2020.
Overall, there has been a 4.2 per cent contraction between March 21, 2020 and August 22, 2020. The first trough came in the week ending April 18, 2020 and the total employment loss was 8.5 per cent.
As the lockdowns were eased, employment started to return until July 11, 2020, after which there was a 0.6 point contraction since.
The renewed job attrition was expected, given the severity of the Stage 4 lockdown in Victoria.
The policy response from the Federal government to this renewed labour market deterioration has been to start politicising the Victorian situation (given the State government is Labor and the feds are conservative).
By trying to shift blame they are just exposing their own unwillingness to use their superior fiscal capacity (relative to the currency-using state government) to reduce the damage that is being caused by the lockdown.
We can do some ‘back-of-the-envelope’ calculations with some assumptions to see what this might imply.
- The Labour Force survey is usually completed by the 11th day of each month.
- The most recent Labour Force release showed that in the four weeks to July 11 (about) total employment rose by 0.9 per cent or 114.7 thousand, unemployment rose by 15.7 thousand and the participation rate rose by 0.6 points. That meant that the labour force rose by 130.5 thousand. Of course, since March 2020, the labour force has fallen by 235.2 thousand.
- If added those workers who have left the labour force due to a lack of employment opportunities back into the official unemployed, the unemployment rate would have been 9.1 per cent rather than the reported 7.49 per cent.
- What the latest ATO data shows, is that total employment has fallen by 0.6 points in the seven weeks since the last Labour Force survey was completed – which based on the current labour force data would amount to a further 80 odd thousand jobs being lost.
- If we assumed no change in participation, but added the hidden unemployed who left the labour force in April back into this revised estimate of the official rate, then the adjusted unemployment rate would be around 9.7 per cent.
Gender trends
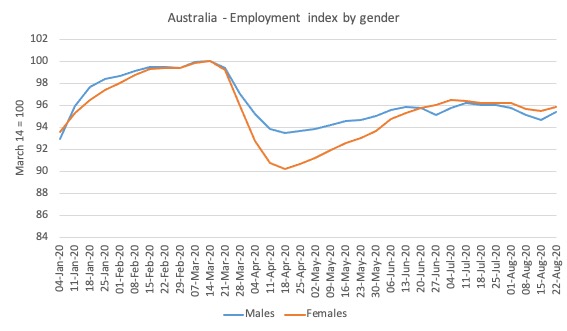
Here is the same series decomposed by gender.
While the pattern was almost identical for males and females up to March 22, 2020, the data for the earlier parts of April showed that the crisis was impacting disproportionately on females.
This bias was driven by the occupational segregation that has women dominating the sectors that were most impacted by the lockdown (accommodation, hospitality, cafes, etc)
As the lockdowns eased and businesses reopened, women started to gain jobs at a faster rate than men.
As the recovery has stalled both sexes are being impacted more or less evenly.
Comparison with prior cycles
As the lockdowns eased, the question was now how quickly the jobs would recover and how many businesses had been lost altogether. The persistence of the unemployment created by the pandemic was dependent on the number of businesses that failed.
The question now, as the situation declines again, is what the hell is the federal government doing about this disaster?
The answer to that question is nothing significant other than try to play politics.
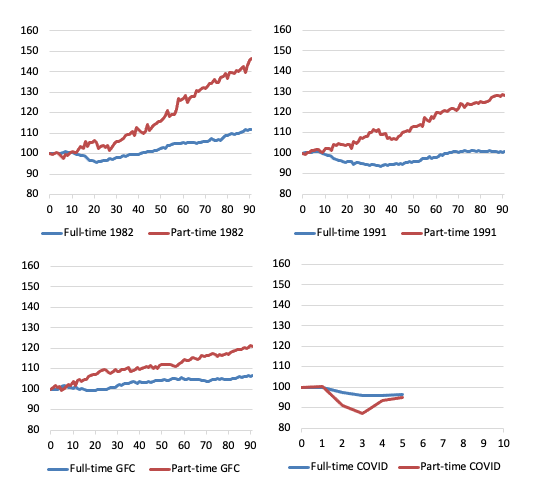
Which then brings us to the following butterfly graphs, which are constructed from ABS Labour Force data. They demonstrate why more fiscal stimulus aimed at job creation is required.
They show for full-time and part-time employment indexes set at 100 for the peak in total employment in the downturns for 1982, 1991, GFC and now the COVID-19 cycles.
For the first three events, they show the trajectory for 90 months after the peak, capturing the dynamics of the cycle.
The pattern in a usual downturn are demonstrated in the first three episodes – even as full-time employment declines as the recession bites, part-time employment continues to grow for a while, until it becomes obvious that the recession is deepening.
At the peak before the 1982 recession, the ratio of part-time to total employment was 16.2 per cent. By the time, full-time employment had reached the peak level again (after 41 months following the peak), the ratio was 17.6 per cent (and rising).
The 1991 recession was particularly bad and there was a major shift away from full-time work. At the peak before the 1991 recession, the ratio of part-time to total employment was 21 per cent. By the time, full-time employment had reached the peak level again (after 65 months following the peak), the ratio was 22.3 per cent (and continuing to rise).
The GFC event was reduced in intensity by the substantial fiscal stimulus that the Federal government introduced. But the part-time ratio still rose and full-time employment took 23 months to return to its pre-GFC peak. The part-time to total ratio in February 2008 (peak before the downturn) was 28.3 JobKeeper cent. After 23 months, the ratio had risen to 30.1 per cent.
While the ratio is rising on a trend basis as the labour market is increasingly casualised and job protections are wound back under the aegis of government policy designed to tilt the playing field towards the employers, there is an acceleration in the ratio during recessions when employers scrap full-time work and replace it in the recovery with part-time, fractionalised and insecure work.
The COVID episode is different given the nature of the job loss – lockdowns – which have directly impacted on the sectors where part-time work dominate.
But it is clear from the observations we have (lower-right panel) from the peak in February 2020 until July 2020, that as the lockdowns were eased, part-time employment rebounded but full-time employment has failed to respond significantly.
Experience tells me that there have been major business failures, which will leave a legacy of elevated unemployment.
Wages paid declining again
The ABS report that between March 14, 2020 and August 22, 2020:
Total wages decreased by 5.2%
The data actually doesn’t show that. The actual decline is 4.2 per cent and I think that might just be a typographical error.
Since the week-ending August 1, 2020, total wages paid have fallen by 0.4 points as the impact of the Stage 4 restrictions in Victoria manifest.
Age breakdown of Job Loss
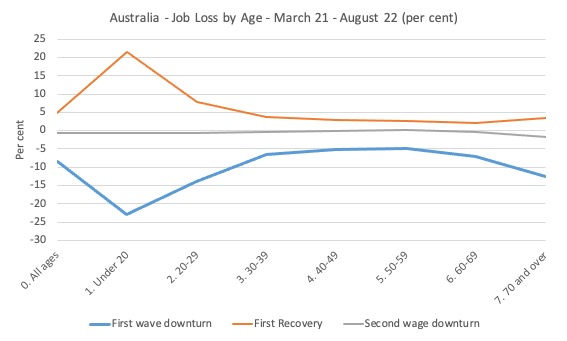
The age breakdowns for Australia as a whole are shown in the next graph.
I have now decomposed the data into the job loss period (First wave downturn, March 22 to April 18), the first recovery period (April 18 to July 11), and the Second wage downturn (July 11 to current).
The timing of these periods is based on National data trends, and, of course, the cycles were slightly different at the state/territory level.
It is clear that our youth bore the brunt of the First wave downturn, largely due to the industrial composition of the job losses – services, accommodation etc.
Their jobs also recovered more quickly.
The other insight from this graph is in noting that the prime-age workers lost about 4 per cent of their employment during the First wave downturn period but in the period since the lockdowns have been eased, their first-stage recovery was very muted.
This links with the full-time, part-time analysis above and is suggestive of a conclusion that businesses have disappeared and the recession will be worse than the government has allowed for in their policy support.
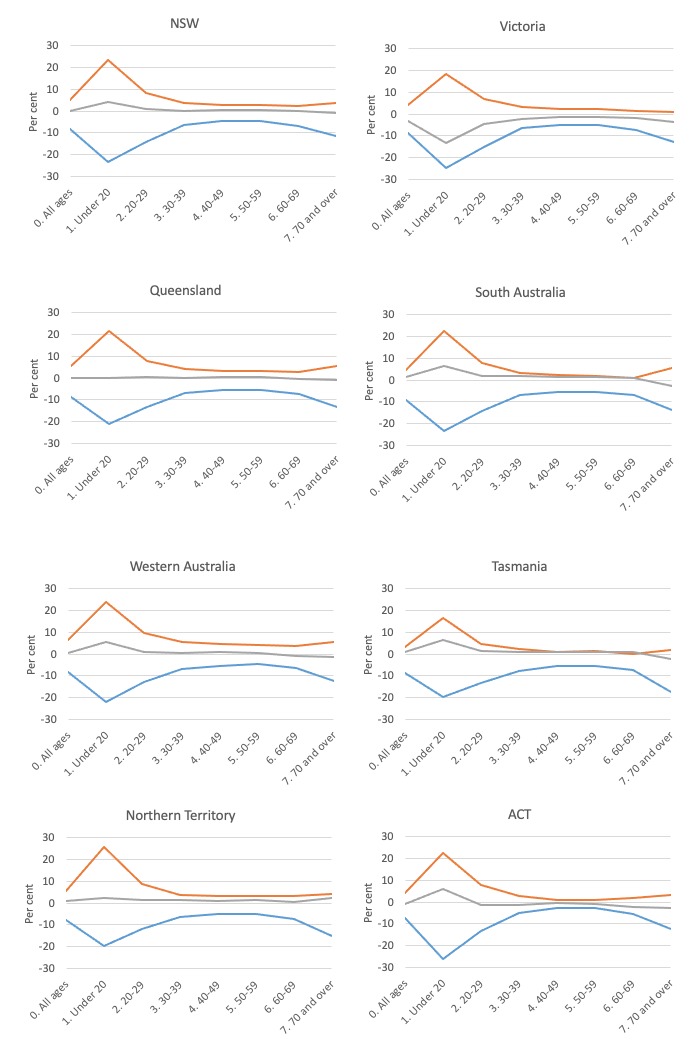
The following sequence of graphs gives the age profiles of the job loss for each State/Territory.
The colours for the lines are as in the aggregate graph: blue (first wave downturn), orange (first recovery) and grey (second wave downturn).
For most states and territories, the teenage job loss in the descent was in excess of 20 per cent and many were not being supported by the JobKeeper wage subsidy because of their casual status.
The recovery was very muted for teenagers but much worse for the prime-age workers (as above).
The new period of downturn is still early and clearly not as severe as the First-wave downturn – yet. However, you can clearly see the impact of the Stage 4 restrictions in Victoria which sets it apart from the other states/territories. Once again, the youth are taking the impact of the lockdowns.
Industry job loss breakdown
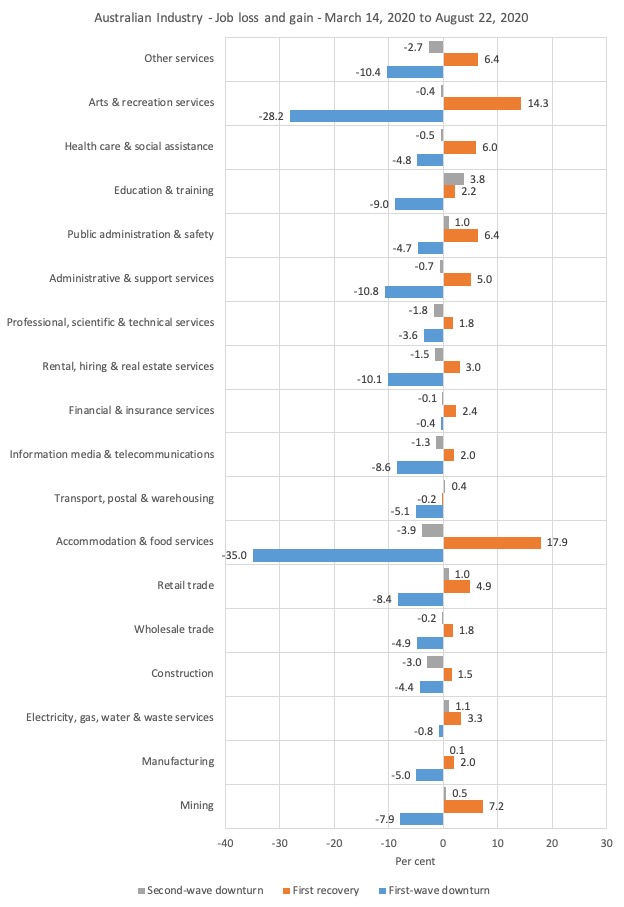
The following graph shows the percentage decline in employment between March 21, 2020 and April 18, 2020 for the Australian industry sectors (First-wave downturn), the First recovery period, which ended on July 25, 2020, and the Second-wave downturn up to August 22, 2020.
The turning points are based on the overall industry aggregate behaviour.
The worst hit sectors were Accommodation & food services (decline of 35 per cent) and Arts & recreation services (decline of 28.2 per cent).
The first stages of lockdown easing allowed some cafes etc to open, which is why employment in the Accommodation and food services has rebounded by 17.9 per cent since April 18, 2020. The Arts and recreation services sector has recovered by 14.3 per cent.
But the pace of the First recovery was insufficient to regain all the jobs lost in the First-wave downturn before the Second-wave downturn began.
In addition to the Stage 4 lockdown in Victoria as it deals with the second wave of the virus, the other dynamics are reflecting factors that have arisen from the wider impacts of the lockdowns as the damage permeates the supply chain across the industrial structure.
The deeper this cross-industry penetration the worse the longer lasting effects will be.
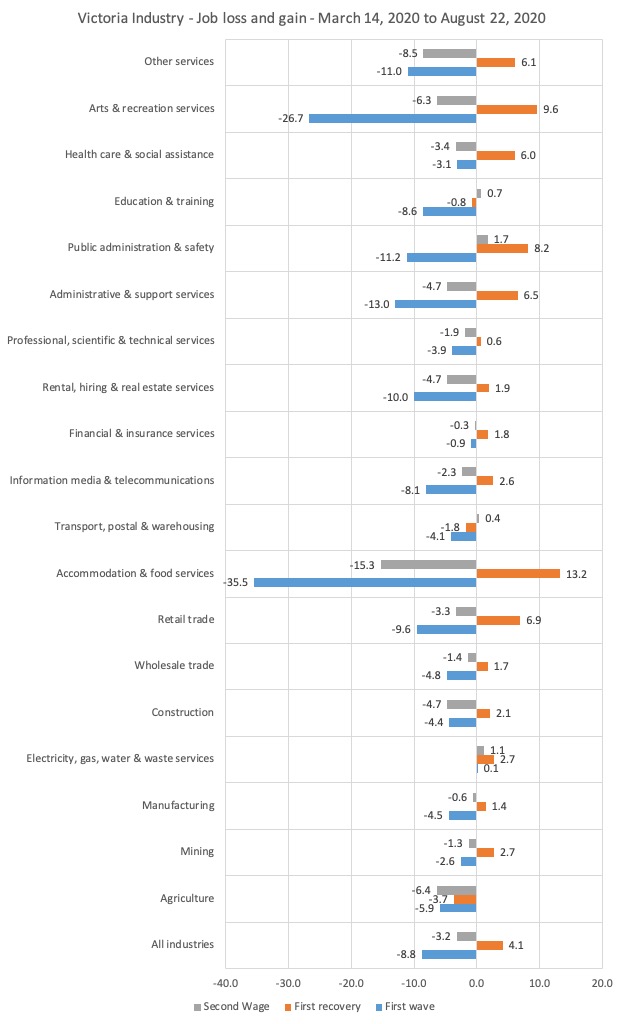
To examine the situation in Victoria more closely, given it is the only state to be experiencing a Second Wave with commensurate lockdowns being reimposed, the next graph shows the sectoral impacts since March 14, 2020.
The renewed lockdown associated with the Second Wave have wiped out the gains made in the short recovery period in Accommodation and Food Services, Other Services, Administrative and Support Services, Rental, hiring and real estate services, Construction.
It has nearly wiped out the gains in Arts and Recreation services (the second worst hit sector overall).
In aggregate, the second lockdown has nearly wiped the gains.
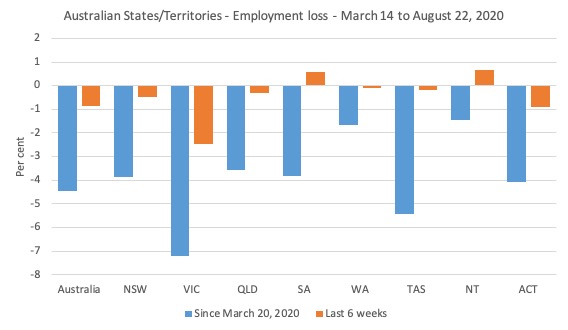
State job loss breakdown
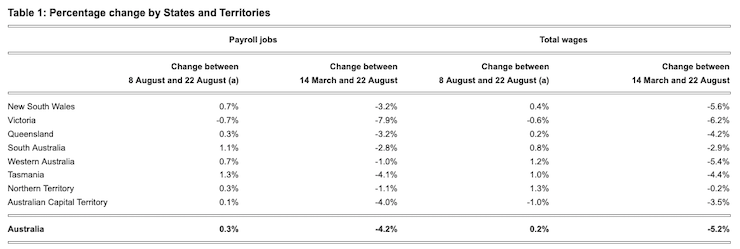
The following graph shows the employment losses from March 14, 2020 to August 22, 2020 for the States and Territories (blue bars), while the orange bars shows what has happened over the last 2 weeks.
Clearly the renewed lockdowns are impacting on Victoria. But it is worrying to see the recovery stall in several other jurisdictions.
This table comes from the ABS Table 1 – and shows the summary of the outcomes for states and territories for various periods.
Conclusion
Troubled times but clearly indicative of a failing policy stance by the Federal government who think their miserable fiscal intervention in March and April would be sufficient.
The fact that the first recovery period failed to regain the jobs lost was an indicator that the policy intervention was insufficient.
Not to be content with the penny pinching in the first wave, the Federal government is now cutting spending soon, months if not years before they should.
The second-wave job losses tell us clearly that more needs to be done. Policy failure again.
That is enough for today!
(c) Copyright 2020 William Mitchell. All Rights Reserved.
There was always going to be a fiscal error. Just another long sorry tale of errors stretching back for decades. Each and everyone of them will create a fiscal error apart from maybe China. China seems to be the only ones who have a full grasp of MMT. When the chips are down always seem to choose the right policy mix.
As the rest of them all play reverse fantasy tug of war – pushing on a bit of string with interest rates. No matter how much they snip off it is still too short.
Will also be interesting to see what happens in Japan.
When the US leans on them, now that Prime minister Abe is gone. Will it still remain an understanding MMT example?
For me China has always been the best example of understanding MMT and they fully understand how banking works. I know getting all of the data needed from China is very difficult, but we don’t talk about China enough. There’s nothing I’ve seen in 30 years that warns China does not understand MMT.
The jury is still out. Will Japan now fall in behind the rest of them ?
Who knows ?
@Derek Henry
“There was always going to be a fiscal error. Just another long sorry tale of errors stretching back for decades. Each and everyone of them will create a fiscal error…”
It’s obvious that you’ve given this a lot of thought, over a considerable time – so your (dire) conclusion may well be the right one overall.
I’m wondering however- and this harks back to Bill’s immediately-preceding blog post – whether a no-deal Brexit (assuming the deadlock can’t be broken without unacceptable concessions to the EU being made) might not *force* the current UK govt to continue on its (unacknowledged but de facto) conversion to keynesian – or quasi-MMT – deficit-spending for the indefinite future, *despite* all the usual inchoate nonsense being spewed out by the Treasury?
A sort of deathbed conversion perhaps?
Robert,
Not sure.
Two things and the first one is inflation, how are the current UK govt going to stop it when it starts to show. Second they are under considerable pressure to make Brexit work. Be very interesting to see what policy mix is generated between those two forces.
At the moment I’m more worried about the US election. A Biden win leaves Boris all On his own and a Biden win will strengthen the EU’s hand around the negotiating table. Brexit could grind to a halt and then Starmer wins and we are all back to the neoliberal globalist status Quo. That’s Wall Street, City Of London, Frankfurt central. Po!icy mix will be the same as it was since the 80’s.
“how are the current UK govt going to stop it when it starts to show”
The fear of inflation is overdone IMO. There has been no inflation of note anywhere in the advanced nations for years, and even the pandemic has not stopped primary production to any great extent.
Demand appears to have fallen away far more than supply.
Aye,
When it does show even just a little bit they tend to hike rates. They talk about not being stuck behind the curve. Chapter 3 of the how to fight inflation which can be found in the Harry Potter GROUPTHINK library at Oxford.
I think it will start to show when this bazooka of savings start getting spent on the wasteland of bankrupted business and not used to pay down debt. Not in a big way but will start to tick up and the BOE will discuss if they have to raise rates. Which will just fuel it even more as they have monetary policy backwards.
That”a when we’ll know if they have been listening to us or not and if their paradigm has moved at all.
It will probably also depend if China is a price taker or price setter on a barrel of oil. How that dynamic plays out.
The whole point of the Intercontinental Exchange was to make OPEC irrelevant and is to control the oil price.Wall Street were able to take control of the global benchmark price (Brent – North Sea oil), and it gave them the ability to control the price.They immediately introduced a formula called BWAVE (the Brent weighted average), and the Saudis started to price their oil against it.
Obama’s strategy was transition through gas and sent the troops to Qatar. The European Central Bank (ECB) started the QE programme. Which enabled producers to buy treasury bills and create the petroeuro. Until Trump came along.
Gary Cohn (one of the two founders of the Intercontinental Exchange ) served as an economic advisor under Trump, who he despised? Also the Secretary of State, Rex Tillerson, from Exxon. They put in place a new energy strategy. Obama’s strategy was ‘transition through gas’. He saw oil in runoff (running out), and that they needed to get to a renewable energy economy via gas. So Obama’s transition through gas strategy got binned; and on June 29th, 2017, they announced a new strategy called ‘Energy Dominance’. It was part of ‘Make America Great Again’, but nobody knew what it was. Then, on July 1st, the way that the Saudis set oil prices (BWAVE ) stopped, after 17 years. They went onto a different benchmark. Then in the next 6 months, massive amounts of money went into the futures contract, the price got bid up again, and after 9 months, at the end of March, both Tillerson and Cohn resigned almost at the same time.
Then, their ‘Energy Dominance’ strategy started to roll out. If you look at the Federal Reserve balance sheet, and a large chunk of the QE that had been used to buy treasury bills – they started selling these bills off. From the end of the first quarter, 2018, over 18 months, they were sold off, which released dollars, which enabled the repatriation of petroeuros. It was to reverse from the petroeuro back to the petrodollar.
The US are literally basing the dollar on their oil reserves. They’re funding shale, not so much with loans, which is what they did for many years, but with what’s called pre-pay – pre-payment. This is what Enron did. Their strategy is for the Federal Reserve Bank to pump up the oil price, using the North Sea benchmark to do so.
China recognising this. The Chinese, and the buy side ( buyers club )are taking advantage of this demand shock. China has built oil storage on a colossal scale – they have immense capacity to build infrastructure. They now have more than 1.2 billion barrels of oil in storage. They have been building oil refineries at a massive rate, so now they can refine far more oil products than they can actually use, and so they can export the surplus. They can dump it. For an extra dollar on the price of a barrel, China has to pay an extra $10 million dollars per day. So are the Chinese going to put up with an extra $30 per barrel?
But it cheap – when the price increases dump it by exporting the storage at higher prices.
The same reason as in 1973, when the oil price went from $3 to $12, and stayed there. Kissinger went to the Shah of Iran, who was the boss man in the oil market then, and told him to keep the oil price at $12. The Shah didn’t understand why, but Sheikh Yamani (Saudi Arabia) did. The reason was that at $3 per barrel, it was impossible to finance North Sea oil, Alaskan oil, US Gulf oil. At $12 they could, and they did.
Same thing is playing out now with shale only this time the US don’t need to go to the Shah of Iran. Gary Cohen and Rex Tillerson made sure they can now manipulate the price.
China built all this storage as they knew they can’t do what the US do.They don’t have the military muscle to go in and enforce the debts. So that’s the realpolitik. If you didn’t pay your debts to Britain in the empire days, they would take your country away from you. US, the same. But China doesn’t have that ability. So for them to be able to set the price of oil they want. They had to create a buyers club with massive storage facilities.
How all of this plays out and whether or not the buyers club can set the price of oil. Will probably define how quickly or how inflation looks after the virus.
Who wins the US energy dominance make America great again strategy of the buyers club ? Will Biden continue with it or dovetail to a gas strategy again ?
Who knows ?
Chris Cook exposed all of this when he was the director of compliance and market supervision of the International Petroleum Exchange, which was bought around 2000. Essentially, the Intercontinental Exchange is Wall Street, who set out to buy and financialise the oil market. Blew the whistle on it, and because of who he was, they had to take it seriously. But he got stitched up and hung out to dry, and lost everything he had – home, family, everything.