Today (April 18, 2024), the Australian Bureau of Statistics released the latest - Labour Force,…
Latest employment data in Australia continues sorry tale and what I would do about it
On Tuesday (September 22, 2020), the ABS released the latest data for – Weekly Payroll Jobs and Wages in Australia, Week ending 5 September 2020 – which gives us the most up-to-date picture of how the labour market is coping with the on-going restrictions. This data provides more accurate estimates of the impact of the harsh Stage 4 restrictions that have been imposed in Victoria to address the Second Wave of the coronavirus. Overall, payroll employment has fallen by 0.9 points since July 25, 2020, when the lockdowns began in earnest. Unsurprisingly, payroll employment fell in the six-week period ending September 5, 2020 in Victoria by 2.8 points. Employment has also fallen in NSW by 0.5 points in the last 6 weeks. The Victorian case is about lockdown. NSW is in decline because of failed macroeconomic policy, which goes to the performance of the federal government. The fact that the first recovery period failed to regain the jobs lost was an indicator that the policy intervention was insufficient. The second-wave job losses tell us clearly that more needs to be done by the Federal government. I provide some clues as to where an extra $100 billion might be spent below.
Advertising: GIMMS Event – Sunday 27, 2020
On Sunday, September 27, 2020, the fabulous team at GIMMS are hosting an event – Phil Armstrong in Conversation with Bill Mitchell – which is a Zoom event open to all.
It will start at 12:30 London time and go for an hour or so.
Sydney: 21:30
New York: 7:30
etc
Click the above link for registration details.
Phil plans to pose some tricky problems of us.
I will look forward to seeing you all on-line, which is not as much fun as face-to-face, but thanks to GIMMS for making this at least possible.
Past analysis of ATO Payroll Data
Relevant blog posts as I trace this data trail over time are:
1. “We need the state to bail out the entire nation” (March 26, 2020).
2. The government should pay the workers 100 per cent, not rely on wage subsidies (March 30, 2020).
3. A Job Guarantee would require $A26.5 billion net to reduce the unemployment rate by 6 percentage points (April 30, 2020).
4. Latest employment data for Australia exposes Federal government’s wilful neglect (May 5, 2020).
5. The job losses continue in Australia but at a slower pace (May 19, 2020).
6. Worst is over for Australian workers but a long tail of woe is likely due to policy failure (June 16, 2020).
7. Latest Australian payroll data suggests employment damage from shutdown is worse than thought (July 20, 2020).
8. Australia’s job recovery stalling and soon to head south again (August 12, 2020).
9. Payroll employment falling again as second-wave and inadequate policy response bites (August 25, 2020).
10. Federal government cutting spending as payroll data shows employment still in decline (September 10, 2020).
In terms of the coverage of the ATO Single Touch Payroll data, the ABS report that:
Approximately 99% of substantial employers (those with 20 or more employees) and 71% of small employers (19 or less employees) are currently reporting through Single Touch Payroll.
Background with respect to timing
1. The most recent monthly Labour Force data (published September 17, 2020) showed that while total employment increased 111,000 (0.9 per cent), with full-time employment increasing by 36,200 and part-time employment increasing by 74,800 – see my review – Australian labour market – improving modestly but much more fiscal stimulus is required (September 17, 2020).
2. The Labour Force data was based on a survey that ended around the second-week of August, so by the time the data is published it is a month out of date.
3. The latest payroll data from the Australian Tax Office (ATO) records takes us up to September 5, 2020, which means it is more representative of where we are at now (although still two weeks out of date).
4. The Stage 4 restrictions in Victoria have now been in force for nearly 8 weeks and infection numbers are falling.
5. The assumption by the Federal government that the economy would rebound quickly is ill-founded. There is mounting evidence that many businesses will not ‘make it across’ the lockdowns, especially given that Victoria is back in tight lockdown and NSW and Queensland are struggling to avoid going down the second-wave lockdown route.
We can do some ‘back-of-the-envelope’ calculations with some assumptions to see what this might imply.
- The Labour Force survey is usually completed by the 11th day of each month.
- The most recent Labour Force release showed that in the four weeks to August 11 (about) total employment rose by 0.9 per cent or 111 thousand, the participation rate rose by 0.1 point, which meant the labour force rose by just 24.5 thousand. As a result, unemployment fell by 86.5 by 15.7 thousand. Since March 2020, the labour force has fallen by 207.6 thousand.
- If added those workers who have left the labour force due to a lack of employment opportunities back into the official unemployed, the unemployment rate would have been 8.2 per cent rather than the reported 6.8 per cent.
- What the latest ATO data shows, is that total employment has fallen by 0.6 points in the three weeks since the last Labour Force survey was completed – which based on the current labour force data would amount to a further 81 odd thousand jobs being lost.
- If we assumed no change in participation, but added the hidden unemployed who left the labour force in April back into this revised estimate of the official rate, then the adjusted unemployment rate would be around 8.8 per cent.
That is the background to analysing the latest payroll data.
Overall jobs recovery stalls as Victoria goes backwards
The ABS – Press Release – notes that:
ayroll jobs were 0.7 per cent lower for the month ending 5 September … Over the month to 5 September, payroll jobs fell by 2.1 per cent in Victoria and by 0.2 per cent for the rest of Australia … Payroll jobs remain around 4.5 per cent lower than mid-March – 8.3 per cent lower in Victoria and 3.1 per cent lower in the rest of Australia …
… around 48 per cent of jobs lost across Australia by mid-April had been regained by 5 September, down from 59 per cent in mid-July …
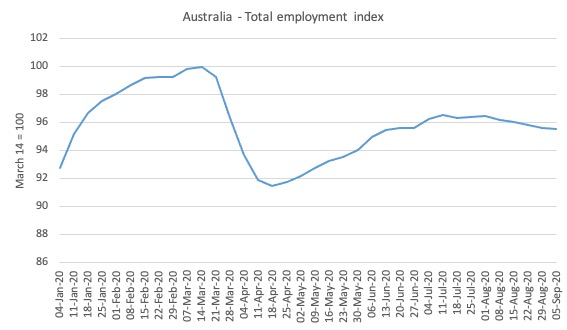
Here is what has happened to total employment in Australia since January 4, 2020 (the ATO data starts at the beginning of the year). The index is based at 100 on March 14, 2020 which appears to be around the peak employment, although it was slowing since February 29, 2020.
1. Overall, there has been a 4.5 per cent contraction between March 21, 2020 and September 5, 2020. The first trough came in the week ending April 18, 2020 and the total employment loss was 8.5 per cent.
2. As the lockdowns were eased, employment started to return until July 11, 2020, after which there was a 0.6 point contraction since.
3. The renewed job attrition was expected, given the severity of the Stage 4 lockdown in Victoria.
The policy response from the Federal government to this renewed labour market deterioration has been to start politicising the Victorian situation (given the State government is Labor and the feds are conservative).
By trying to shift blame they are just exposing their own unwillingness to use their superior fiscal capacity (relative to the currency-using state government) to reduce the damage that is being caused by the lockdown.
Gender trends
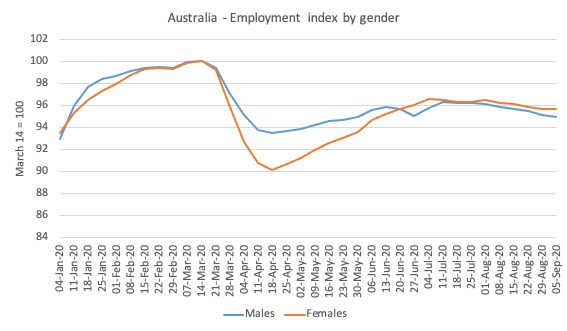
Here is the same series decomposed by gender.
While the pattern was almost identical for males and females up to March 22, 2020, the data for the earlier parts of April showed that the crisis was impacting disproportionately on females.
This bias was driven by the occupational segregation that has women dominating the sectors that were most impacted by the lockdown (accommodation, hospitality, cafes, etc)
As the lockdowns eased and businesses reopened, women started to gain jobs at a faster rate than men.
As the recovery has stalled both sexes are being impacted more or less evenly.
Comparison with prior cycles
As the lockdowns eased, the question was now how quickly the jobs would recover and how many businesses had been lost altogether. The persistence of the unemployment will be dependent on the number of businesses that failed.
The question now, as the situation declines again, is what the hell is the federal government doing about this disaster?
The answer to that question is nothing significant other than try to play politics.
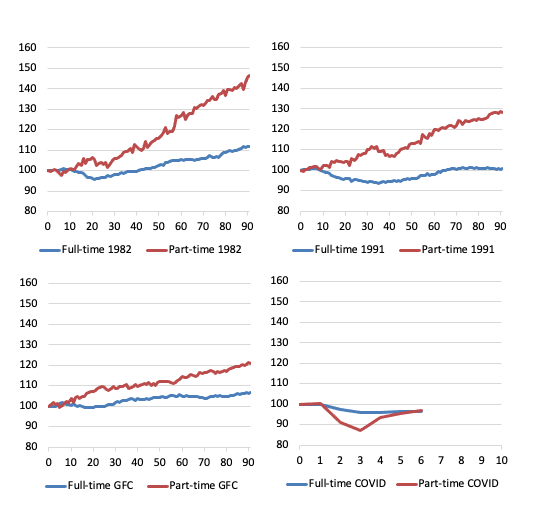
Which then brings us to the following butterfly graphs, which are constructed from ABS Labour Force data. They demonstrate why more fiscal stimulus aimed at job creation is required.
They show for full-time and part-time employment indexes set at 100 for the peak in total employment in the downturns for 1982, 1991, GFC and now the COVID-19 cycles.
For the first three events, they show the trajectory for 90 months after the peak, capturing the dynamics of the cycle.
The pattern in a usual downturn are demonstrated in the first three episodes – even as full-time employment declines as the recession bites, part-time employment continues to grow for a while, until it becomes obvious that the recession is deepening.
At the peak before the 1982 recession, the ratio of part-time to total employment was 16.2 per cent. By the time, full-time employment had reached the peak level again (after 41 months following the peak), the ratio was 17.6 per cent (and rising).
The 1991 recession was particularly bad and there was a major shift away from full-time work. At the peak before the 1991 recession, the ratio of part-time to total employment was 21 per cent. By the time, full-time employment had reached the peak level again (after 65 months following the peak), the ratio was 22.3 per cent (and continuing to rise).
The GFC event was reduced in intensity by the substantial fiscal stimulus that the Federal government introduced. But the part-time ratio still rose and full-time employment took 23 months to return to its pre-GFC peak. The part-time to total ratio in February 2008 (peak before the downturn) was 28.3 JobKeeper cent. After 23 months, the ratio had risen to 30.1 per cent.
While the ratio is rising on a trend basis as the labour market is increasingly casualised and job protections are wound back under the aegis of government policy designed to tilt the playing field towards the employers, there is an acceleration in the ratio during recessions when employers scrap full-time work and replace it in the recovery with part-time, fractionalised and insecure work.
The COVID episode is different given the nature of the job loss – lockdowns – which have directly impacted on the sectors where part-time work dominate.
But it is clear from the observations we have (lower-right panel) from the peak in February 2020 until July 2020, that as the lockdowns were eased, part-time employment rebounded but full-time employment has failed to respond significantly.
Experience tells me that there have been major business failures, which will leave a legacy of elevated unemployment.
Wages paid begin to rise
The ABS report that between March 14, 2020 and September 5, 2020:
Total wages decreased by 4.3%
Since the week-ending August 29, 2020, total wages paid have risen by 1 point, which is good news given the fears that the Stage 4 lockdown in Victoria would have greater negative impacts.
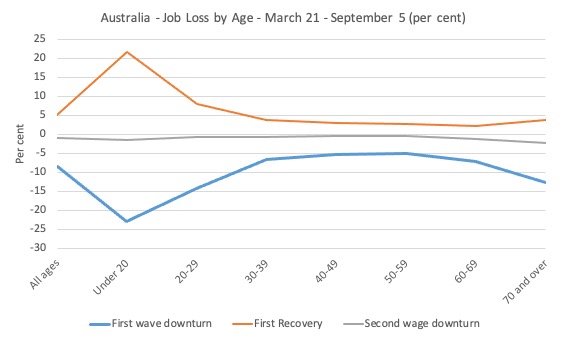
Age breakdown of Job Loss
The age breakdowns for Australia as a whole are shown in the next graph.
I have now decomposed the data into the job loss period (First wave downturn, March 22 to April 18), the first recovery period (April 18 to July 11), and the Second wage downturn (July 11 to current).
The timing of these periods is based on National data trends, and, of course, the cycles were slightly different at the state/territory level.
It is clear that our youth bore the brunt of the First wave downturn, largely due to the industrial composition of the job losses – services, accommodation etc.
Their jobs also recovered more quickly.
The other insight from this graph is in noting that the prime-age workers lost about 5 per cent of their employment during the First wave downturn period but in the period since the lockdowns have been eased, their first-stage recovery was very muted.
This links with the full-time, part-time analysis above and is suggestive of a conclusion that businesses have disappeared and the recession will be worse than the government has allowed for in their policy support.
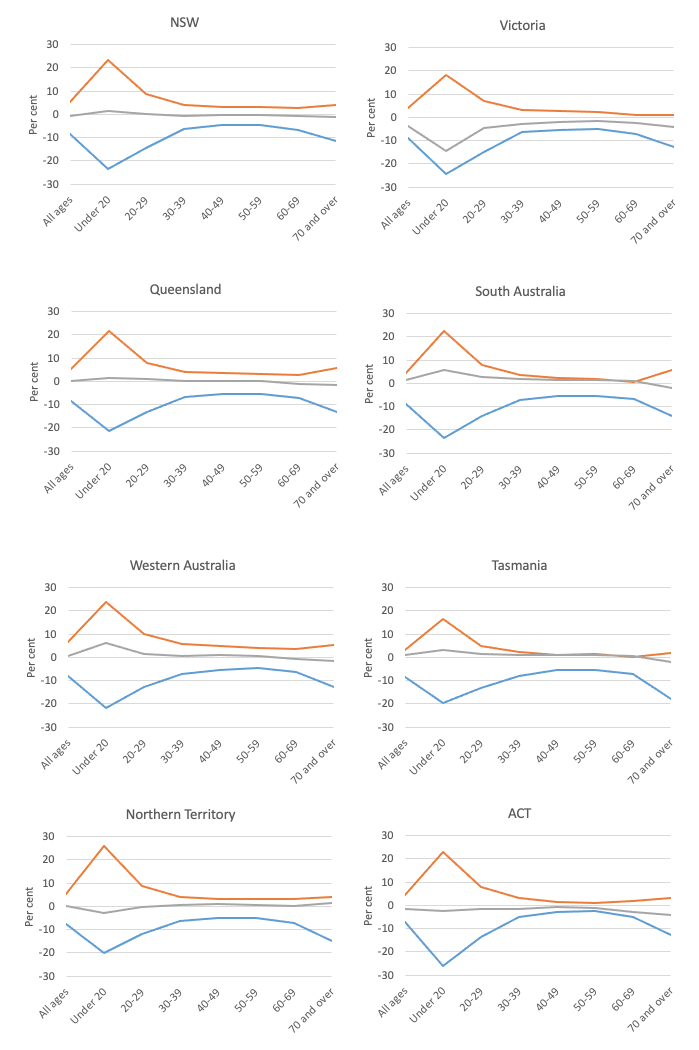
The following sequence of graphs gives the age profiles of the job loss for each State/Territory.
The colours for the lines are as in the aggregate graph: blue (first wave downturn), orange (first recovery) and grey (second wave downturn).
For most states and territories, the teenage job loss in the descent was in excess of 20 per cent and many were not being supported by the JobKeeper wage subsidy because of their casual status.
The recovery was very muted for teenagers but much worse for the prime-age workers (as above).
You can now clearly see the impact of the Stage 4 restrictions in Victoria which sets it apart from the other states/territories. Once again, the youth are taking the impact of the lockdowns.
Industry job loss breakdown
The following graph shows the percentage decline in employment between March 21, 2020 and April 18, 2020 for the Australian industry sectors (First-wave downturn), the First recovery period, which ended on July 25, 2020, and the Second-wave downturn up to September 5, 2020.
The turning points are based on the overall industry aggregate behaviour.
The worst hit sectors were Accommodation & food services (decline of 35 per cent) and Arts & recreation services (decline of 28.2 per cent).
The first stages of lockdown easing allowed some cafes etc to open, which is why employment in the Accommodation and food services rebounded by 18.2 per cent. The Arts and recreation services sector recovered by 14.5 per cent.
But the pace of the First recovery was insufficient to regain all the jobs lost in the First-wave downturn before the Second-wave downturn began.
In addition to the Stage 4 lockdown in Victoria as it deals with the second wave of the virus, the other dynamics are reflecting factors that have arisen from the wider impacts of the lockdowns as the damage permeates the supply chain across the industrial structure.
The deeper this cross-industry penetration the worse the longer lasting effects will be.

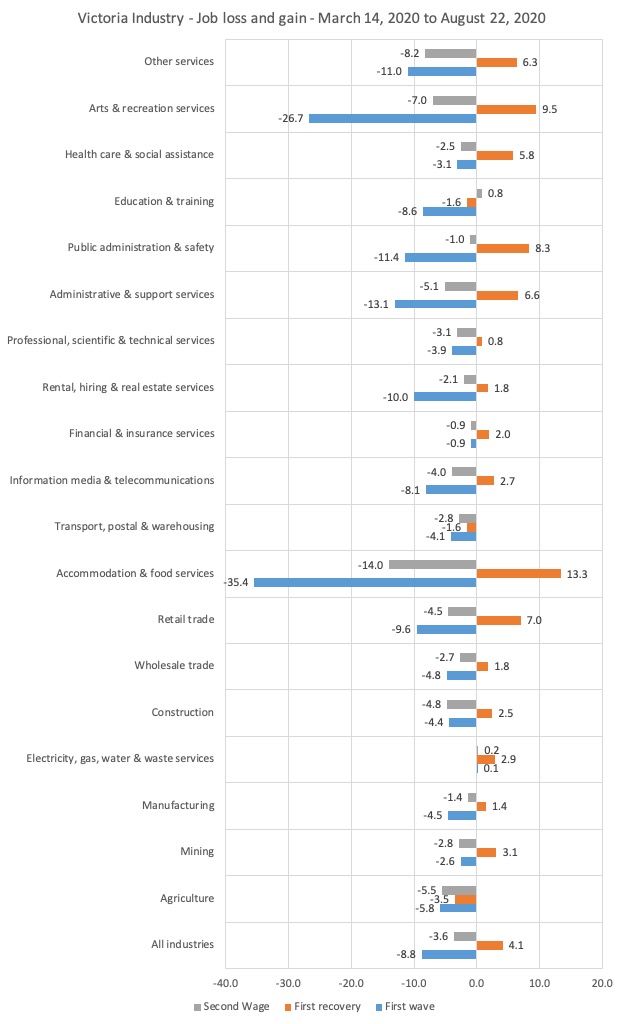
To examine the situation in Victoria more closely, given it is the only state to be experiencing a Second Wave with commensurate lockdowns being reimposed, the next graph shows the sectoral impacts since March 14, 2020.
The renewed lockdown associated with the Second Wave have wiped out the gains made in the short recovery period in:
– Accommodation and Food Services.
– Other Services.
– Professional, scientific and technical services.
– Rental, hiring and real estate services.
– Information, media and telecommunications.
– Transport, postal and warehousing.
– Wholesale trade.
– Construction.
– Agriculture.
It has nearly wiped out the gains in Arts and Recreation services (the second worst hit sector overall).
In aggregate, the second lockdown has nearly wiped out the gains.
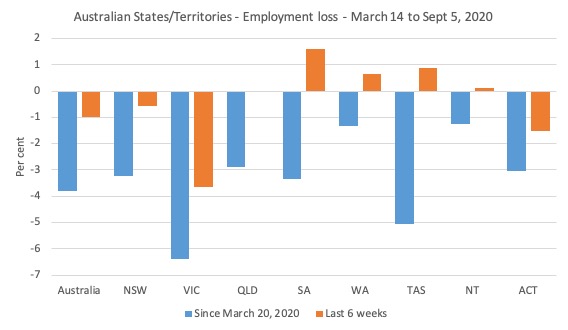
State job loss breakdown
The following graph shows the employment losses from March 14, 2020 to September 5, 2020 for the States and Territories (blue bars), while the orange bars shows what has happened over the last 6 weeks.
Clearly the renewed lockdowns are impacting on Victoria. But it is worrying to see the recovery stall in NSW as well – the two largest economies in the federation.
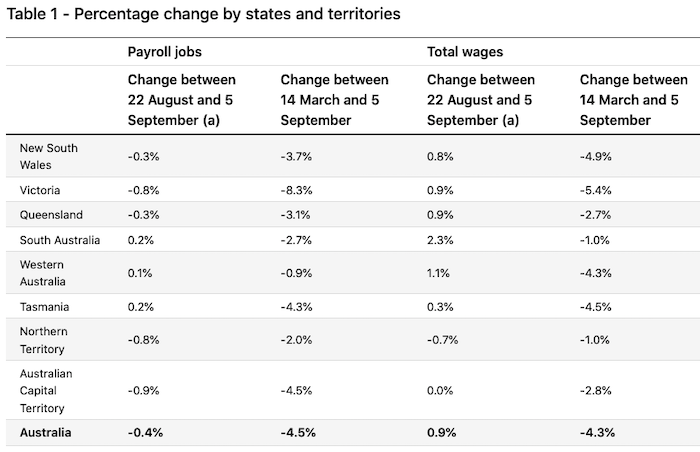
This table comes from the ABS Table 1 – and shows the summary of the outcomes for states and territories for various periods.
What would I do about this situation?
I am on The Age/Sydney Morning Herald Scope Survey Panel, which comprises most of the prominent economists in Australia who on a semi-annual basis answer questions about the period ahead about likely movement in aggregates (GDP, inflation, employment, unemployment, wages, house prices etc) and other more qualitative assessments.
I completed my survey response for the next period ahead this morning and one of the questions was:
Should the federal budget contain extra measures to stimulate economic activity? What sort of measures? Should that include a bring-forward of the 2022 and 2024 tax cuts?
I replied along these lines.
The current fiscal support is more than $100 billion short of what it should be. The Federal government has injected less than 9 per cent of GDP and spread it out over several years.
When you think that the Japanese government first stimulus injection was around 21 per cent of GDP and another injection of similar size is coming, the evidence is obvious.
Their unemployment rate has barely moved, our labour wastage is around 20 per cent (unemployment, underemployment, drop in labour force – hidden unemployment).
Tax cuts will not provide a spending boost – we saw that in the most recent cuts.
Why?
Because household debt is too high and people used the tax cuts to increase their saving and pay down their debt to make it less precarious.
You saw in the last National Accounts that the household saving ratio went from 6 per cent of disposable income to 19.8 per cent as the fear of the pandemic (unemployment, income loss) saw a dramatic cut in consumption expenditure.
It would be better for the government to increase spending substantially, which will allow saving to be supported by the growth in income and will directly boost sales and jobs.
Initiatives the government should pursue:
1. Fast track the shift to a non-carbon economy – for example, create the Hunter as a Renewable Hub Region and start investing in building that hub, which would span, research and design, innovation, manufacturing, sales, administration, technical support etc. The choice of the Hunter is because it will allow local workers to see their is a pathway out of coal.
2. Fast track the design and contracts for a fast train from Brisbane to Melbourne – which should have been constructed years ago. Make it a public corporation which does not have to earn profits.
3. Reassert NBN Co as a public company and abandon its ‘cost recovery’ constraints and offer free services to retailers at fast speeds and regulate low retail charges.
4. Abandon JobKeeper and instead directly pay wages and salaries of all workers in line with their previous tax statements. Work around the edges for those without a tax record.
5. Fund TAFE properly to increase its capacity to train apprentices and fund the creation of thousands of apprenticeships across Australia.
6. Invest in manufacturing capacity to make Australia more self-reliant in a number of areas – health care, transport, renewables, etc.
7. Increase the funding to universities and regulate the salaries of the managerial class in that sector downwards as a condition for adequate funding of research and teaching. End the trend towards casualisation in the research sector.
8. Regulate the GIG economy to bring it in line with other labour market segments – that is, ensure full leave and sick entitlements are paid, no ‘independent contractor’ exceptions, superannuation contributions etc.
9. Require the Fair Work Commission to restore penalty rates to all workers who have lost them.
10. Introduce a Job Guarantee – an unconditional job offer in the public sector at a socially inclusive minimum wage, with full entitlements (holiday, sick leave, super payments etc) which allows anyone to work and choose their hours, choose training and/or formal education. This is not workfare. Abandon the unemployment benefit system. We need a wide ranging discussion about what constitutes productive work to broaden that concept and include many areas of unmet community and environmental care needs in our employment focus.
11. Introduce a state-owned bank that can provide competition to the big 4 and bring down charges, gouging etc.
12. Free child care.
13. Free public transport.
14. Enhance the career public sector in several areas – health, education, occupational planning, regional development – and end the trend to rendering the public sector a contract brokerage for outsourced private contracts for public service delivery.
15. Ensure the CSIRO, the ABC, SBS are adequately funded as public institutions.
16. Increase foreign aid substantially.
17. Abandon the Closing the Gap process, and restart it with proper targets that are properly funded – which will include many of the initiatives outlined above.
18. Stop defunding public education and revise the schooling funding model in favour of public schools.
19. Invest in 400,000 or more social houses to meet the massive excess demand and make housing affordable for low-paid workers and their families. This will be a big boost to the construction sector.
20. Retrofit the existing housing stock to make it more carbon neutral. There is a massive amount that can be done in this area to invest in smart housing technology for all families to militate against the climate emergency.
And that is just for starters!
Conclusion
Troubled times but clearly indicative of a failing policy stance by the Federal government who think their miserable fiscal intervention in March and April would be sufficient.
The fact that the first recovery period failed to regain the jobs lost was an indicator that the policy intervention was insufficient.
Not to be content with the penny pinching in the first wave, the Federal government is now cutting spending soon, months if not years before they should.
The second-wave job losses tell us clearly that more needs to be done. Policy failure again.
That is enough for today!
(c) Copyright 2020 William Mitchell. All Rights Reserved.
Hi Bill,
Nice post!
The only thing I would change is the construction of social housing – the fed government should instead take possession of the coming tsunami of delinquent mortgages on the horizon, cancel the mortgage, owner(s) lose house to state govt. housing authority as a “gift” from the feds
Some of the 20 “initiatives” canvassed here may have merits as part of a medium term economic strategy for Australia.
But most of the jobs which might be created by these initiatives are poorly matched with the skills, experience and locations of workers who have recently lost their jobs.
Looking at ABS data, it seems that that a large proportion (roughly 70%) of job losses since March 2020 have been in the “Accommodation and Food Services”, “Arts and Recreation Services” plus several other service industries. Few of these workers are well-suited for the proposed initiatives.
.
The exception to this is the proposed job guarantee scheme, Prof. Mitchell’s initiative number 10.
This would try to create jobs suited to otherwise unemployed workers, rather than vice-versa.
No estimates are given here what these new jobs might be but it seems unlikely that they would be more COVID safe than staying at home. The proposed job guarantee initiative would therefore be inferior to leaving the unemployed locked down at home.
.
Moreover, the guaranteed public sector jobs would have lower value to consumers than their former private sector employment. For example, experience worldwide indicates that public sector organisations are inefficient at satisfying consumers’ demands for “Accommodation and Food Services”, “Arts and Recreation Services”, etc. It follows that the proposed job guarantee initiative would be inferior to opening up the private sector economy asp.
That’s an excellent list for the government. Here in the UK, apparently the Government has abandoned pretty much any long term thinking in a ‘scramble (shamble) for urgent measures to save jobs’ (The Guardian). Not that its long term thinking amounted to anything worthwhile before. Also from the Graun: ‘(carbon capture ambitions) stumbled in 2015 after the government abandoned a £1bn scheme to set up a CCUS project.. Three years later, ministers returned with less money and a new idea.’ This when costs of HS2, speedier trainline to London, currently the last place people want to live and work, are likely to be more than £100bn (much of it spent buying up wealthy people’s land as well as damaging our already depleted environment).
Orthodox ALP economist Craig Emerson (on ABC’s ‘The Drum’ tonight) defended former Left-wing PM Keating’s attack on the “high priests of the central bank” for not doing enough to help the government. (Right-wing Treasurer Frydenberg had previously said Keating’s attack on the CB is unforgivable).
Emerson noted public debt is approaching $1 trillion, and the reserve bank should buy treasury bonds of “say $200 billion”. Obviously a timid fellow, though not surprising since in a communication with me he considered MMT to be like handing out ‘helicopter money, which has its place in certain conditions”…..and he is still obviously enamoured with the quantity theory of money, rather than what an MMT’er might call the quantity theory of resources and productive capacity…
@Kingsley Lewis
As always, the nay-sayers want to skip immediately to debating precisely what JG jobs would be, without applying the necessary imagination and knowledge.
Unfortunately, many proponents of JG do at times fall into this trap and start discussing it, myself included.
I think the core point is that there would need to be a detailed JG system employing many administrators and team leaders etc (who would not just be on JG wages) which had multiple ways of receiving information re what jobs are needed. The average person doesn’t know enough about the genuine needs of the economy to identify all the jobs that could be done by JG workers, because it takes a vast amount of knowledge and many administrators at local and higher levels to collate and process that knowledge.
Bill, you should re-post a link to (and the relevant contents of) that state government proposal you worked on some time ago (in the noughties, 2007 perhaps?) regarding the details of how a jobs guarantee would work in terms of the governmental structures required to come up with the job ideas.
Good post for reference ! I’ll try and spread the word!
Hi Neil,
Emerson mightn’t get it but there’s one Liberal who might be getting close, Queensland MP Andrew Laming.
In “The Guardian” today he described Frydenberg’s abandoning of austerity to concentrate on unemployment in these terms:
“The “historic” reordering of priorities “is almost a diluted version of Modern Monetary Theory, a belief that the true crime is to leave the citizenry unutilised or underutilised”
I will as soon as possible “Spread the Word’ by distributing an extract from your Blog – the r response to The Age/Sydney Morning Herald Scope Survey Panel – to members of my Labor Party Branch in the hope that it can be considered and a Resolution made subsequently aiming at restoring some Policy credibility supporting the ALP’s “FairGo’ , in contrast to current blind Austerity blather.
John, Thanks for your note.
Meanwhile Frydenberg still feels impelled to condemn Keating’s scathing remarks on “high priests” Lowe and co. of the reserve bank.
No doubt Frydenberg think he can create full employment without the support of the CB by “growing the economy” via supply side economics ie by stepping up Reagonomics, as he said recently.
Great that the Guardian published Laming’s words. Unfortunately Guardian leadership itself is not yet onside with MMT.