As part of a another current project, which I will have more to say about…
Tax cuts are unlikely to work at present and are less effective than government spending increases
As governments grapple with the dissonance that the pandemic is causing them – realising that their old mainstream economics narratives are not going to cut it any more but still reluctant to admit that and pass onto a new phase of creative policy making – we are observing these contradictions in both statements about fiscal policy and monetary policy. The Australian government, for example, is convinced tax cuts are required but have observed that recent tax cuts, before the pandemic hardly stimulated any spending. Further research from the US is demonstrating that payments to households under the – Coronavirus Aid and Economic Security (CARES) Act – may not have resulting in the spending boost that was modelled as part of the policy design. And then on the monetary policy front, central bankers like Madame Lagarde are strutting around making grand statements about becoming flexible with their definition of price stability (that is, saying they will allow for higher inflation before they increase rates) despite not being able to remotely meet their current stability levels with deflation looming. I covered a statement along similar lines from the US Federal Reserve Bank boss recently – US Federal Reserve statement signals a new phase in the paradigm shift in macroeconomics (August 31, 2020). It all adds up to what happens when a paradigm is shifting and the old school are caught out – no longer able to really offer anything of use but hanging on to their status nonetheless. Pragmatism usually passes them by as it will in this case.
Fiscal policy puzzles for the mainstream
The US-based National Bureau of Economic Research has just published a Working Paper (27693) – How Did U.S. Consumers use their Stimulus Payments? – by US academics Olivier Coibion, Yuriy Gorodnichenko, and Michael Weber.
They conducted “large-scale survey of U.S. consumers” to explore “how the large one-time transfers to individuals from the CARES Act affected their consumption, saving and labor-supply decisions.”
They note that a “major component was a one-time transfer to all qualifying adults of up to $1200, with $500 per additional child” and seek to explore “How effective were these transfers in stimulating the consumption of recipients?”
The results are interesting:
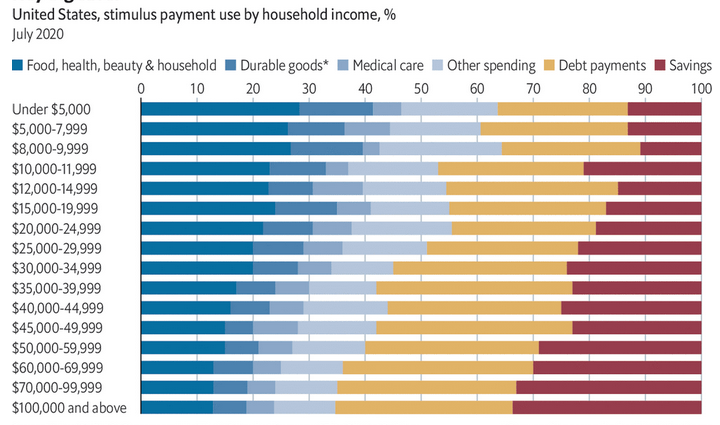
1. “Only 15 percent of recipients of this transfer say that they spent (or planned to spend) most of their transfer payment, with the large majority of respondents saying instead that they either mostly saved it (33 percent) or used it to pay down debt (52 percent).”
2. “U.S. households report having spent approximately 40 percent of their checks on average, with about 30 percent of the average check being saved and the remaining 30 percent being used to pay down debt.”
3. “Little of the spending went to hard-hit industries selling large durable goods (cars, appliances, etc.). Instead, most of the spending went to food, beauty, and other non-durable consumer products that had already seen large spikes in spending even before the stimulus package was passed because of hoarding.”
There were significant differences across the income distribution.
4. “lower-income households were significantly more likely to spend their stimulus checks, as were households facing liquidity constraints.”
5. “Individuals out of the labor force were also more likely to spend their checks than either employed or unemployed individuals, consistent with motives of consumption smoothing and hand-to-mouth behavior.”
6. “Other groups that were more likely to report spending most of their checks were those living in larger households, men, Hispanics and those with lower education.”
7. “In contrast, African-Americans were much more likely to report using their checks primarily to pay off debt, as were older individuals, those with mortgages, unemployed workers and those reporting to have lost earnings due to COVID.”
8. “higher-income individuals were more likely to save than pay off debts, those with mortgages or renters were much more likely to pay off debts instead as were financially constrained individuals.”
9. “Ninety percent of employed workers who had received a stimulus check reported that the transfer had no effect on their work effort.”
The Economist Magazine published an interesting graphic about this study in this article (September 2, 2020) – How did Americans use their coronavirus stimulus cheques? – which I reproduce here:
This relates to the debate about tax cuts versus government spending.
The Australian government introduced tax cuts from July 1, 2019 estimated to be worth about $A158 billion.
The assessment was that they largely benefitted the higher income earners. I don’t with to comment on that here.
Even with that reality, the Government’s estimates were that they would stimulate real GDP growth by 2.9 per cent per year.
It didn’t happen.
The UK Guardian article (December 8, 2019) – Turning the economic tide: could a radical monetary theory fix Australia’s woes? – written after I gave an extensive interview to the journalist Martin Farrer, reported my view that the tax cuts did not stimulate spending but were saved and used to pay off debt.
Retail sales hardly moved following the tax cuts.
The question is why?
Australian households, like US households are carrying record levels of household debt and it has been obvious that the Australian consumers have reduced their thirst for higher debt and have started to cut consumption spending and increase the household saving ratio as uncertainty rises.
The most recent report from the New York Federal Reserve Bank – Household Debt and Credit Report (Q2 2020) – published August 6, 2020, shows that “total household debt decreased by $34 billion (0.2%) … in the second quarter 2020” which “is the largest decline since the second quarter of 2013.”
However, household debt remains at record levels.
So it is no surprise that handing out increases in disposable income via transfers or tax cuts will be used by households to pay down debt and improve the quality of their balance sheets.
Conservatives favour tax cuts because they ultimately reduce the sustainable size of government. Why?
While tax revenue does not fund government spending it does represent a reduction in the purchasing power of households and corporations, which means it frees up real resources that may have been deployed within the non-government sector with increased purchasing power.
That allows the government to increase spending and bring those ‘idle’ productive resources back into use.
If the non-government sector spending is higher and they have a greater share of the total resources available in the economy then there is less room for the government sector to spend without promoting inflationary pressures.
Notwithstanding these ideological issues, tax cuts are, in general, less effective in stimulating spending that direct government spending.
This is a well-known result from macroeconomics.
Why is that?
You might like to read this blog post – What is the balanced-budget multiplier? (December 30, 2010) – which deals with this issue.
In a simple conception of household consumption we might say that it depends on how much of each extra dollar is consumed times the total dollars received.
The marginal propensity to consume (c) is the extra consumption per dollar of extra disposable income. So if c = 0.8 we know that for every extra dollar of disposable income that the economy produces 80 cents will be consumed.
So, in the most simple hypothesis, we might write:
C = cYd
where Yd is disposable income, which is total income (Y) less total taxes paid (T), that is, Yd ≡ Y – T.
The marginal propensity to consume (MPC) is intrinsically related to the marginal propensity to save (MPS) which is the amount of every extra dollar generated that is saved (after households decide on their consumption). So the MPS = 1 – MPC by definition.
The importance of MPC is that is one of the key determinants of the expenditure multiplier, which tells us the total change in GDP when there is an injection of new spending from an autonomous source.
Please read my blog – Spending multipliers (December 28, 2009) – for more discussion on this point.
The MPC lies between 0 and 1. The higher the MPC the higher is the proportion of new income generated that is consumed.
We can also consider a simple tax rule: T = tY, where t is the marginal (and average) tax rate.
So if t = 0.2 then Yd = (1 – t)Y = 0.8Y.
It means that if total Y (that is, GDP) changes by 100, then disposable income rises by 80, because taxes rise by 20, given the tax rate is 20 cents in the dollar.
What about an increase in government spending
So what happens when government increases spending by $100 to stimulate total spending in the economy?
That spending will enter the economy directly and stimulate sales and production (if there is idle capacity).
Remember the basic macroeconomic rule – aggregate demand drives output with generates incomes (via payments to the productive inputs).
There is a saying that one person’s income is another person’s expenditure and so the more the latter spends the more the former will receive and spend in turn – repeating the process.
What is spent will generate income in that period which is available for use. The uses are further consumption; paying taxes and/or buying imports.
So if for every dollar produced and paid out as income, if the economy imports around 20 cents in the dollar, then only 80 cents is available within the system for spending in subsequent periods excluding taxation considerations. This is a ‘leakage’ from the system.
However there are two other ‘leakages’ which arise from domestic sources – saving and taxation. Take taxation first. When income is produced, the households end up with less than they are paid out in gross terms because the government levies a tax.
Finally consider saving. Consumers make decisions to spend a proportion of their disposable income. The amount of each dollar they spent at the margin (that is, how much of every extra dollar to they consume) is determined by the marginal propensity to consume.
Saving will be the residual after the spending (and tax) decisions are made. Saving (S) is thus a ‘leakage’ from the expenditure system.
So when the government increases spending, the second-round spending induced is via household consumption (in a simple model) which is less than the initial government expenditure injection.
That is, workers who receive the increased incomes from the initial injection, spend some of that increase in shops and the like, which then stimulates further production and income increases.
And so it goes, each additional increment in income being less than the last as a result of the ‘leakages’ until the process is exhausted.
This process is called the expenditure multiplier and the value of the multiplier depends on the size of the leakages. The larger is the propensity to save, the propensity to import and the tax rate, the lower the multiplier.
If the multiplier is say 1.6, then a $100 government injection will lead to a final increase in total GDP of $160.
What about a tax cut?
A tax cut increases household disposable income.
So, for example, if total GDP is $1000 (keeping the sum simple) and the tax rate is 0.2 then disposable income is $800.
What happens if the tax rate is halved to 0.1?
Then, disposable income rises by $100.
Note that for comparison purposes we have calibrated this rise to be equal to the $100 government injection in the previous example.
What happens next?
The initial rise in household spending (assuming their propensity to consume does not change) is given by: Change in C = c times Change in Disposable Income.
We write this in symbols for simplicity as:
ΔC = cΔYd
where the Δ symbol just means change.
So, in our example, with the MPC assumed to be 0.8:
ΔC = 0.8 times 100 = 80.
That increase in consumption expenditure then triggers off the same multiplier process as before.
The $80 increase in consumption leads to an increase in GDP (income).
The workers who earned that increase in income increase their consumption and the production system responds.
And so the process continues with each period seeing a smaller and smaller induced spending effect (via additional rounds of consumption) because the leakages are draining the spending that gets recycled into increased production.
Eventually the process stops and income reaches its new ‘equilibrium’ level.
With our spending multiplier assumed to be 1.6, then the initial rise in consumption that follows a tax cut which increases disposable income by $100 will generate a total change in GDP of $128 (1.6 times $80), which is much less than the increase that follows a $100 increase in government spending.
What explains the difference?
In the case of the tax cut, even with the marginal propensity to consume assumed to be constant, households will save some of the increase in disposable income, which means less extra spending flows into the system than if the government just directly increases spending.
In the latter case, every dollar of increased government spending flows into increased sales orders or income generation.
And when we add some reality to these simple frameworks, we know that spending propensities are not fixed in stone (and vary across different income cohorts).
They are clearly sensitive to the precariousness of household balance sheets and the uncertainty in the economy.
So while the impacts I have outlined in a simple schema above still apply, these real world insights attenuate them, which is why households have, at least in the short run, pocketed increases in disposable income arising from stimulus packages in order to increase their risk management capacity through extra saving per dollar and improving the precarious states of their balance sheets that are overburdened with debt.
It is interesting that those who still believe government fiscal policy is ineffective in stimulating the economy and serving as a counter-stabilising function jump on these empirical outcomes as evidence that they are correct.
Nothing could be further from the truth.
All the facts tell us is that the intitial stimulus provided by the government was less than was required given the situation it faced.
So if, for example, the heightened uncertainty etc reduced the spending multiplier to 1.2 from 1.6 because the marginal propensity to consume is much lower than anticipated in ‘normal’ times.
And the government assesses that GDP has to rise by $100 to mop up unemployment but is still basing its fiscal strategy on the 1.6 multiplier assumption.
It thus injects an additional $62.50 into the economy by way of direct government spending, and finds that GDP only rises by $75 (1.2 times 62.5).
That doesn’t mean that the spending is ineffective. It just means that the government should have increased spending by $83.30, given that the circumstances have led households to be more cautious.
And if tax cuts are to be the source of stimulus, then they have to be that much larger again to get the desired effect.
And then progressives should realise that if the scale of tax cuts is very large, then it starts to compromise the viable size of government, for reasons noted above.
Conclusion
A short lesson in macroeconomics.
Next week, I will consider Madame Lagarde’s statement yesterday that attempted to reframe ECB policy strategies. Tomorrow, the Weekend Quiz.
That is enough for today!
(c) Copyright 2020 William Mitchell. All Rights Reserved.
“While tax revenue does fund government spending”
Typo
“households will save some of the increase in disposable income”
The way I’ve been trying to explain this to people who can’t see it, is to call financial saving *and* paying back debt: “voluntary taxation”.
It’s a concept that works reasonably well with those people who think saving and reducing debt adds some sort of capacity to the economy.
So a tax cut just changes some compulsory taxation into voluntary taxation and that won’t improve the monetary flow.
Targeted fiscal interventions at those most likely to spend money is the way to go. Which means more money to those at the low end. Believers in “trickle down” rather than “bubble up” don’t like that conclusion.
Re Neil’s comment: thinking that ‘saving and reducing debt adds some sort of capacity to the economy.’ The way I think of it is that tax and saving both take money out of the flow going round the economy being exchanged for goods or labour. Savers can choose to put the saved money back into the flow at any time, subject to type of saving (or if money taken out has been used to pay down debt, then more debt can be taken on in the future) but that doesn’t help the here and now. Also while savers are unrestricted in putting money into circulation in the future, so is the government.
For my money, that re-framing admirably serves its declared purpose (namely, to disabuse people of the faulty belief that saving &/or paying-down debt adds something to the economy).
And
“So a tax cut just changes some compulsory taxation into voluntary taxation and that won’t improve the monetary flow”
is arguably the corollary.
Nevertheless, people generally do, I think, instinctively favour tax-cuts as the course of first resort whereas Bill’s “short lesson in macroeconomics” makes crystal clear to anyone not previously aware of it (such as me!) that their (arithmetically smaller) net effect is demonstrably such as to merit their being placed only second in line after increased govt spending – other things equal.
Getting that message across is a more difficult task, I think (and “not improving the monetary flow” doesn’t cut it), because it falls foul of the – current ever since the ‘seventies – ascendancy of neoliberalism, with its ideologically-driven antipathy to govt spending and “budget deficits”, in the consciousness of politicians and the general public alike.
(And yes, it IMHO most definitely still works its magic, despite the pandemic).
Targetted Govt spending, rather than across the board tax cuts, also makes more sense in geographically/economically diverse countries like the UK. More Govt spending, or even the effect of tax cuts, in the SE of England can lead to localised overheating and higher inflation, especially in the property market.
Whereas there are large areas of the UK which have much more scope for increased Govt spending leading to increased economic activity with little or no risk of economic overheating.
When governments, under massive and relentless citizen pressure, begin to focus on the critical emergencies of human and environmental survival, instead of screwing around with futile efforts to stimulate consumer spending in an already stone dead, formerly ecocidal neoliberal economy, THEN things will get serious and there will be much to talk about. Right now, we’re not only in an interregnum but in a coma, and apart from the pressing need for a JG that pays people to work or stay home in accord with public health constraints (again, as a matter of survival MUCH more than economic stimulation), there’s not a hell of lot to say. Bill’s one of the best number crunchers out there, but I long to hear again his clear, courageous voice about the FAR bigger picture–without exaggeration, one of life or death for humanity and all other living things. For example, how do we transition ASAP to some viable form of eco-socialism in which, guided by MMT, we take care of each other and begin to rescue the imperiled health of our global ecosystem? My hope is that Bill and Tom’s upcoming sequel to “Reclaiming the State” will grapple constructively and creatively with such vital issues.
“This chapter finds that increased public infrastructure investment raises output in both the short and long term, particularly during periods of economic slack and when investment efficiency is high. This suggests that in countries with infrastructure needs, the time is right for an infrastructure push: borrowing costs are low and demand is weak in advanced economies, and there are infrastructure bottlenecks in many emerging market and developing economies. Debt-financed projects could have large output effects without increasing the debt-to-GDP ratio, if clearly identified infrastructure needs are met through efficient investment. . . .
The point estimates in panel 2 of the figure show that higher public investment spending typically reduces the debt-to-GDP ratio both in the short term (by about 0.9 percentage point of GDP) and in the medium term (by about 4 percentage points of GDP), but the decline in debt is statistically significant only in the short term. There is no statistically significant effect on private investment as a share of GDP (panel 3).
The latter finding suggests the crowding in of private investment, as the level of private investment rises in tandem with the higher GDP as a result of the increase in public investment.
. . . an increase in public infrastructure investment affects output both in the short term, by boosting aggregate demand through the fiscal multiplier and potentially crowding in private investment, and in the long term, by expanding the productive capacity of the economy with a higher infrastructure stock.”
‘The IMF Confirms That ‘Trickle-Down’ Economics Is, Indeed, a Joke”
A devastating new report from the International Monetary Fund has declared the idea of “trickle-down” economics to be as much a joke as he’d imagined.
INCREASING THE INCOME SHARE TO THE BOTTOM 20 PERCENT OF CITIZENS BY A MERE ONE PERCENT RESULTS IN A 0.38 PERCENTAGE POINT JUMP IN GDP GROWTH.
The IMF report, authored by five economists, presents a scathing rejection of the trickle-down approach, arguing that the monetary philosophy has been used as a justification for growing income inequality over the past several decades. “Income distribution matters for growth,” they write. “Specifically, if the income share of the top 20 percent increases, then GDP growth actually declined over the medium term, suggesting that the benefits do not trickle down.” ‘
the whole MPC/MPS thing is interesting. Because i think its a lot more correct then the more classical used velocity. They are the same thing really. If velocity is how fast money changes hands, well the fastest would be someone spending it as soon as they got it. A MPC of 100%
Taxes are just velocity maximisers, they take money that might not be used fully and get it moving again. The whole Gesell problem of money needs to flow to be a useful medium of transaction. Sure we can keep pumping in water from the gov spigot but its pretty wasteful way of doing it.
Like money is a two way street, i spend it on an individual who might have a great idea and is raking it in. But now he has all this money for society to function he needs to turn around and spend it to grow his idea or start a new business etc. If they don’t spend out of their capital and employ people to realise their specific vision then their money needs to have a level of entropy.
gov taxes and spending allow that level of entropy and flow of money to happen. but its a hard sell to say to someone that your money shouldn’t be a good store of value. and that’s where inflation comes in as a way “tax” savings without taxing it. even the idea of say a negative interest rate at a certain level is just a tax on savings.
“Taxes are just velocity maximisers”
They’re not. Very specifically not in the MMT view. Taxes are velocity minimisers – there to ensure there is less spend than there otherwise would be on items that are required for public use. Don’t need to minimise velocity because there is lots of saving? Then there is little need to tax.
It is government sector injections that are the velocity maximisers, along side the private sector spending injections that banks facilitate via their collateral discounting processes.
If you attempt to “tax” savings in any way, then people just build the savings back up to the level they require to feel comfortable (if the savings are for insurance purposes – including working capital) or superior (if the savings are for status purposes). And that generates a deflationary feedback loop.
The correct approach, identified by MMT, is to accommodate the savings. Let them go to whatever is required, and realise you don’t have to pay people to do that. The insurance and status drivers will do that for you.
Doesn’t the multiplier depend upon how taxes are applied? With a base case of Y_0=1000M, if the tax is a consumption tax (VAT or GST) then it gets collected every period, so the combined effect on increased GDP is greater than a one-off government spending increase at the beginning of the cycle. For Y_0=1000M with Delta Y =100M (so new Y_0=1100M) , and tax rate 20%, the spending multiplier for 12 periods is k=1.79. With a tax cut down to tax rate=12.9%, the total tax revenue over the whole cycle =$100M less than the increase spending $100M case, but then the multiplier is k=1.98. Correct me if I’m wrong. Maybe I am computing the multiplier differently to Bill?
If the tax cut is a one-off credit, $100M, (taxed on the initial $1000M) and so only operates once during a cycle, at the start, and during subsequent periods the tax rate is back to normal 20%, then the tax cut multiplier is less, about k=1.43. So I am not sure Bill’s tax cut scenario is realistic? Is an increase in initial Y_d really what people mean by a tax cut equivalent to a spending increase?
Isn’t the proper comparison one of equal end of cycle accumulated government deficit? In which case I think a permanent tax cut has a better GDP multiplier than the deficit equivalent one-off increase in spending, because the tax cut operates at every period, not just the initial.
The real lessons to take-away are that (a) taxation is powerful, roughly for every $1 taxed the government can spend $1.20. And (b) the stimulus from a tax cut has to peter-out compared to government spending when the tax rate needed to produce the same GDP growth becomes 0%, because then you are in the territory of drastic currency depreciation. Hence (c) government spending functions best with fairly high tax rates, the tax prevents inflation, while tax cuts move the economy towards inflation faster than equivalent spending increases with unchanged tax rate. The point being the high tax permits much higher government spending, to lift up the most disadvantaged.
I know conservatives hate this new, and neoliberals pretend to be favourable but still hate it, and both want lower taxes, but they should know that will be more inflationary and the Austrians at least alwyas whine about how inflation is an indirect tax. They can’t have it both ways. Meanwhile, decent people have to spread the word that taxes serve a useful purpose, but only if they are seen as permitting greater government spending, not insane budget balances.