I regularly scan research output from disciplines other than economics that I think impacts on…
Australian labour market continues to go backwards as government sits idly by
On Tuesday (October 20, 2020), the ABS released the latest data for – Weekly Payroll Jobs and Wages in Australia, Week ending 3 October 2020 – which gives us the most up-to-date picture of how the labour market is coping with the on-going restrictions. Last week, the ABS released the monthly labour force survey data which covered the period up until September 14. Today’s data gives us an extra two weeks of information to gauge what is happening. It also provides us more accurate estimates of the impact of the harsh Stage 4 restrictions that have been imposed in Victoria to address the Second Wave of the coronavirus. Those restrictions were eased last weekend after the government has brought the outbreak under control. So hopefully, today’s data will signal just about the trough before the slow recovery begins as more activities open up. Overall, payroll employment has fallen by 0.7 points since July 25, 2020, when the lockdowns began in earnest. Unsurprisingly, payroll employment fell in the six-week period ending October 3, 2020 in Victoria by 2.3 points. Employment has also fallen in NSW by 0.7 points over the same period. The Victorian case is about lockdown. NSW is in decline because of failed macroeconomic policy, which goes to the performance of the federal government. The fact that the first recovery period failed to regain the jobs lost was an indicator that the policy intervention was insufficient. The second-wave job losses tell us clearly that more needs to be done by the Federal government. The problem is the federal government is now engaging itself in trivial political point scoring instead of showing economic leadership.
Past analysis of ATO Payroll Data
Relevant blog posts as I trace this data trail over time are:
1. “We need the state to bail out the entire nation” (March 26, 2020).
2. The government should pay the workers 100 per cent, not rely on wage subsidies (March 30, 2020).
3. A Job Guarantee would require $A26.5 billion net to reduce the unemployment rate by 6 percentage points (April 30, 2020).
4. Latest employment data for Australia exposes Federal government’s wilful neglect (May 5, 2020).
5. The job losses continue in Australia but at a slower pace (May 19, 2020).
6. Worst is over for Australian workers but a long tail of woe is likely due to policy failure (June 16, 2020).
7. Latest Australian payroll data suggests employment damage from shutdown is worse than thought (July 20, 2020).
8. Australia’s job recovery stalling and soon to head south again (August 12, 2020).
9. Payroll employment falling again as second-wave and inadequate policy response bites (August 25, 2020).
10. Federal government cutting spending as payroll data shows employment still in decline (September 10, 2020).
11. Latest employment data in Australia continues sorry tale and what I would do about it (September 24, 2020).
In terms of the coverage of the ATO Single Touch Payroll data, the ABS report that:
Approximately 99% of substantial employers (those with 20 or more employees) and 71% of small employers (19 or less employees) are currently reporting through Single Touch Payroll.
Background with respect to timing
1. The most recent monthly Labour Force data (published October 15, 2020) showed that total employment decreased 29,500 (-0.2 per cent), full-time employment decreased 20,100 and part-time employment decreased 9,400. – see my review – Australian labour market – recovery over and more fiscal stimulus is needed (October 15, 2020).
2. The Labour Force data was based on a survey that ended around the second-week of September, so by the time the data is published it is a month out of date.
3. The latest payroll data from the Australian Tax Office (ATO) records takes us up to October 3, 2020, which means it is more representative of where we are at now (although still two weeks out of date).
4. The Stage 4 restrictions in Victoria had been in force for nearly 10 weeks by the time this data was gathered.
5. The assumption by the Federal government that the economy would rebound quickly is ill-founded. There is mounting evidence that many businesses will not ‘make it across’ the lockdowns. There will be lasting damage which requires a much stronger fiscal response than has been forthcoming to date.
We can do some ‘back-of-the-envelope’ calculations with some assumptions to see what this might imply.
6. What the latest ATO data shows, is that total employment has fallen by 0.6 points in the three weeks since the last Labour Force survey was completed – which based on the current labour force data would amount to a further 81 odd thousand jobs being lost.
7. If we assumed no change in participation, but added the hidden unemployed who left the labour force in April back into this revised estimate of the official rate, then the adjusted unemployment rate would be around 8.9 per cent.
That is the background to analysing the latest payroll data.
Overall jobs recovery stalls as Victoria goes backwards
The ABS – Press Release – notes that:
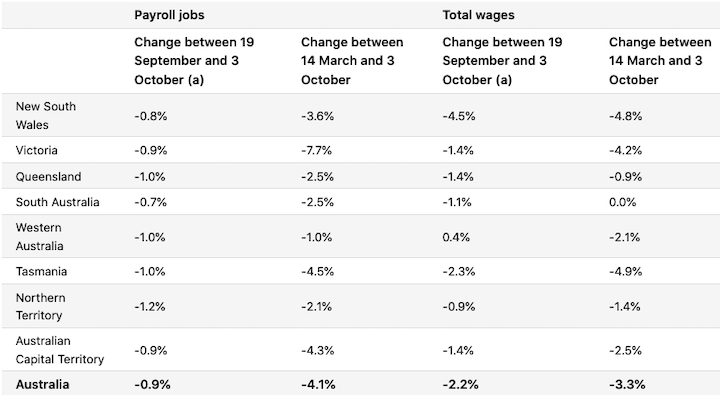
Payroll jobs fell 0.9 per cent across the fortnight to 3 October … All states and territories reported a fall in payroll jobs in late September, ranging from a 1.2 per cent decrease in the Northern Territory to a 0.7 per cent decrease in South Australia … Nationally, payroll jobs remain 4.1 per cent lower than mid-March; 7.7 per cent lower in Victoria and 2.8 per cent lower in the rest of Australia …
People aged 20 to 49 accounted for almost two thirds (65 per cent) of payroll jobs prior to COVID-19. In the fortnight to 3 October, payroll jobs worked by this age group decreased by around 1 per cent – nationally and within most states and territories.
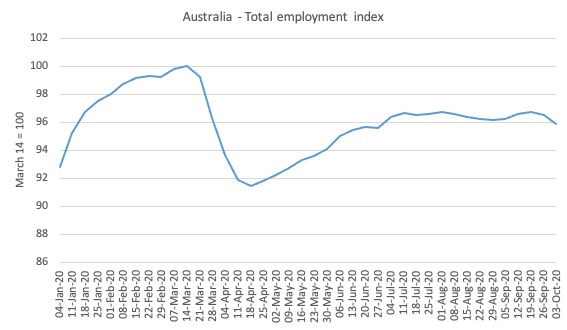
Here is what has happened to total employment in Australia since January 4, 2020 (the ATO data starts at the beginning of the year). The index is based at 100 on March 14, 2020 which appears to be around the peak employment, although it was slowing since February 29, 2020.
1. Overall, there has been a 4.1 per cent contraction between March 21, 2020 and October 3, 2020. The first trough came in the week ending April 18, 2020 and the total employment loss was 8.5 per cent.
2. As the lockdowns were eased, employment started to return until July 11, 2020, after which there was a slight contraction.
3. The renewed job attrition was expected, given the severity of the Stage 4 lockdown in Victoria.
4. However, in the two weeks after the labour force data came out, the payroll data shows that employment shrunk by 0.8 points.
The policy response from the Federal government to this renewed labour market deterioration has been to start politicising the Victorian situation (given the State government is Labor and the feds are conservative).
By trying to shift blame they are just exposing their own unwillingness to use their superior fiscal capacity (relative to the currency-using state government) to reduce the damage that is being caused by the lockdown.
Gender trends
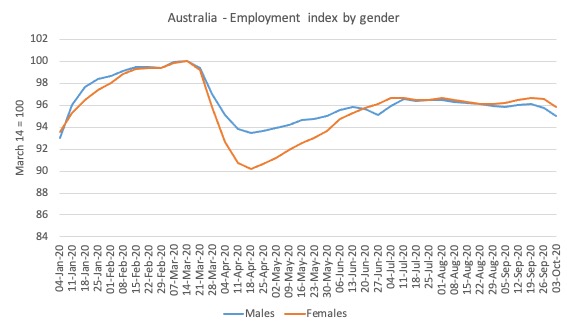
Here is the same series decomposed by gender.
While the pattern was almost identical for males and females up to March 22, 2020, the data for the earlier parts of April showed that the crisis was impacting disproportionately on females.
This bias was driven by the occupational segregation that has women dominating the sectors that were most impacted by the lockdown (accommodation, hospitality, cafes, etc)
As the lockdowns eased and businesses reopened, women started to gain jobs at a faster rate than men.
As the recovery has stalled both sexes are being impacted more or less evenly.
Comparison with prior cycles
As the lockdowns eased, the question was now how quickly the jobs would recover and how many businesses had been lost altogether. The persistence of the unemployment will be dependent on the number of businesses that failed.
The question now, as the situation declines again, is what the hell is the federal government doing about this disaster?
The answer to that question is nothing significant other than try to play politics.
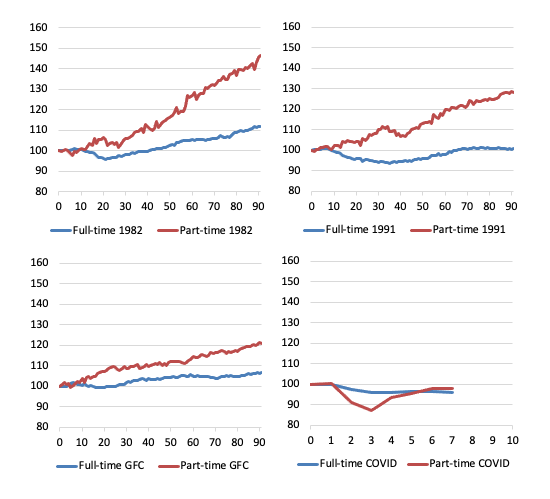
Which then brings us to the following butterfly graphs, which are constructed from ABS Labour Force data. They demonstrate why more fiscal stimulus aimed at job creation is required.
They show for full-time and part-time employment indexes set at 100 for the peak in total employment in the downturns for 1982, 1991, GFC and now the COVID-19 cycles.
For the first three events, they show the trajectory for 90 months after the peak, capturing the dynamics of the cycle.
The pattern in a usual downturn are demonstrated in the first three episodes – even as full-time employment declines as the recession bites, part-time employment continues to grow for a while, until it becomes obvious that the recession is deepening.
At the peak before the 1982 recession, the ratio of part-time to total employment was 16.2 per cent. By the time, full-time employment had reached the peak level again (after 41 months following the peak), the ratio was 17.6 per cent (and rising).
The 1991 recession was particularly bad and there was a major shift away from full-time work. At the peak before the 1991 recession, the ratio of part-time to total employment was 21 per cent. By the time, full-time employment had reached the peak level again (after 65 months following the peak), the ratio was 22.3 per cent (and continuing to rise).
The GFC event was reduced in intensity by the substantial fiscal stimulus that the Federal government introduced. But the part-time ratio still rose and full-time employment took 23 months to return to its pre-GFC peak. The part-time to total ratio in February 2008 (peak before the downturn) was 28.3 JobKeeper cent. After 23 months, the ratio had risen to 30.1 per cent.
While the ratio is rising on a trend basis as the labour market is increasingly casualised and job protections are wound back under the aegis of government policy designed to tilt the playing field towards the employers, there is an acceleration in the ratio during recessions when employers scrap full-time work and replace it in the recovery with part-time, fractionalised and insecure work.
The COVID episode is different given the nature of the job loss – lockdowns – which have directly impacted on the sectors where part-time work dominate.
But it is clear from the observations we have (lower-right panel) from the peak in February 2020 until July 2020, that as the lockdowns were eased, part-time employment rebounded somewhat but full-time employment has continued to decline.
Experience tells me that there have been major business failures, which will leave a legacy of elevated unemployment.
Wages paid begin to rise
The ABS report that between March 14, 2020 and October 3, 2020:
Total wages decreased by 3.3%
Since the week-ending September 19, 2020 up to week-ending October 3, total wages paid have decreased by 2.2 per cent, which is a reversal of the 1.3 per cent increase the fortnight prior to this.
Age breakdown of Job Loss
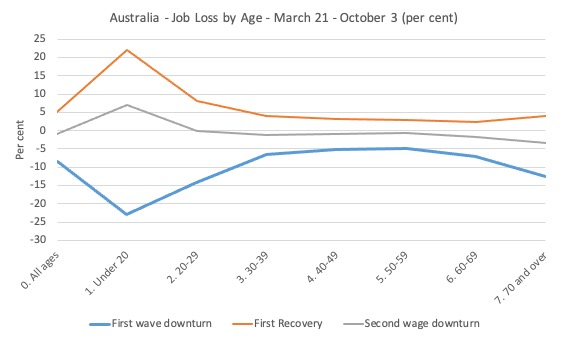
The age breakdowns for Australia as a whole are shown in the next graph.
I have now decomposed the data into the job loss period (First wave downturn, March 22 to April 18), the first recovery period (April 18 to July 11), and the Second wage downturn (July 11 to current).
The timing of these periods is based on National data trends, and, of course, the cycles were slightly different at the state/territory level.
It is clear that our youth bore the brunt of the First wave downturn, largely due to the industrial composition of the job losses – services, accommodation etc.
Their jobs also recovered more quickly.
The other insight from this graph is in noting that the prime-age workers lost about 5 per cent of their employment during the First wave downturn period but in the period since the lockdowns have been eased, their first-stage recovery was very muted.
This links with the full-time, part-time analysis above and is suggestive of a conclusion that businesses have disappeared and the recession will be worse than the government has allowed for in their policy support.
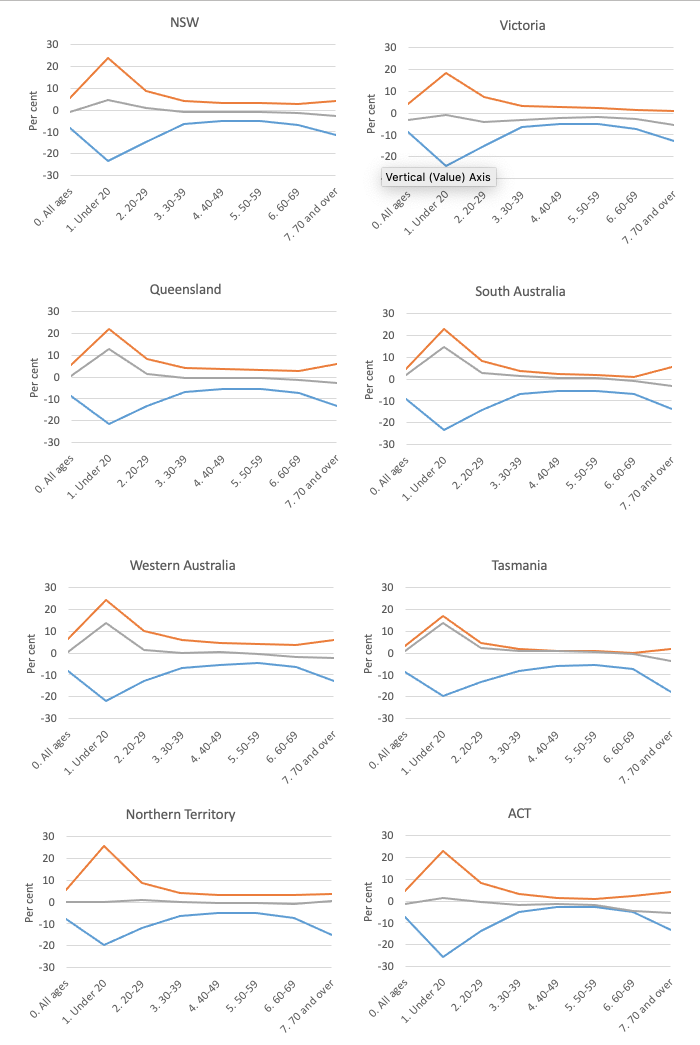
The following sequence of graphs gives the age profiles of the job loss for each State/Territory.
The colours for the lines are as in the aggregate graph: blue (first wave downturn), orange (first recovery) and grey (second wave downturn).
For most states and territories, the teenage job loss in the descent was in excess of 20 per cent and many were not being supported by the JobKeeper wage subsidy because of their casual status.
The recovery was very muted for teenagers but much worse for the prime-age workers (as above).
You can now clearly see the impact of the Stage 4 restrictions in Victoria which sets it apart from the other states/territories. Once again, the youth are taking the impact of the lockdowns, particularly the 20-39 age cohort.
Industry job loss breakdown
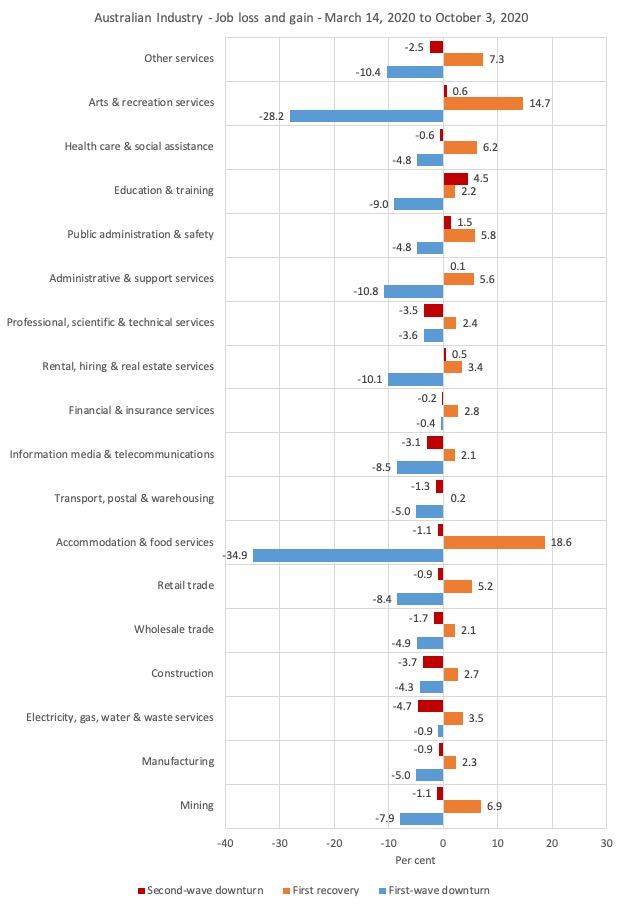
The following graph shows the percentage decline in employment between March 21, 2020 and April 18, 2020 for the Australian industry sectors (First-wave downturn), the First recovery period, which ended on July 25, 2020, and the Second-wave downturn up to October 3, 2020.
The turning points are based on the overall industry aggregate behaviour.
The worst hit sectors were Accommodation & food services (decline of 34.9 per cent) and Arts & recreation services (decline of 28.2 per cent).
The first stages of lockdown easing allowed some cafes etc to open, which is why employment in the Accommodation and food services rebounded by 18.6 per cent. The Arts and recreation services sector recovered by 14.7 per cent.
But the pace of the First recovery was insufficient to regain all the jobs lost in the First-wave downturn before the Second-wave downturn began.
In addition to the Stage 4 lockdown in Victoria as it dealt with the second wave of the virus, the other dynamics are reflecting factors that have arisen from the wider impacts of the lockdowns as the damage permeates the supply chain across the industrial structure.
The deeper this cross-industry penetration the worse the longer lasting effects will be.
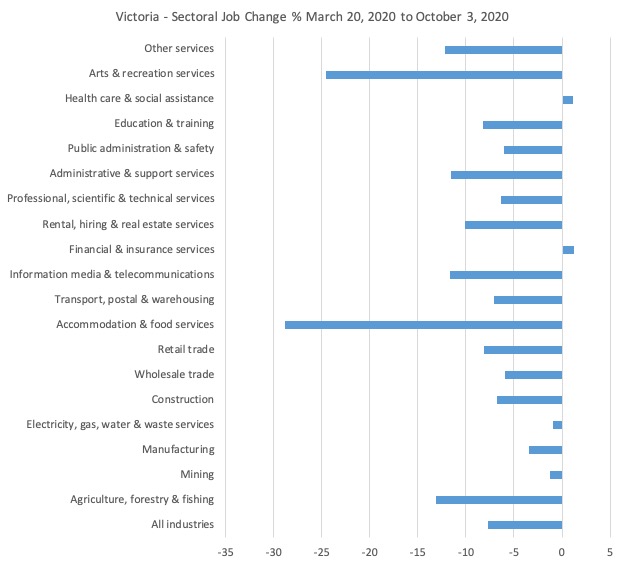
To examine the situation in Victoria more closely, given it is the only state to be experiencing a Second Wave with commensurate lockdowns being reimposed, the next graph shows the sectoral impacts since March 14, 2020.
Widespread losses in all but two industries.
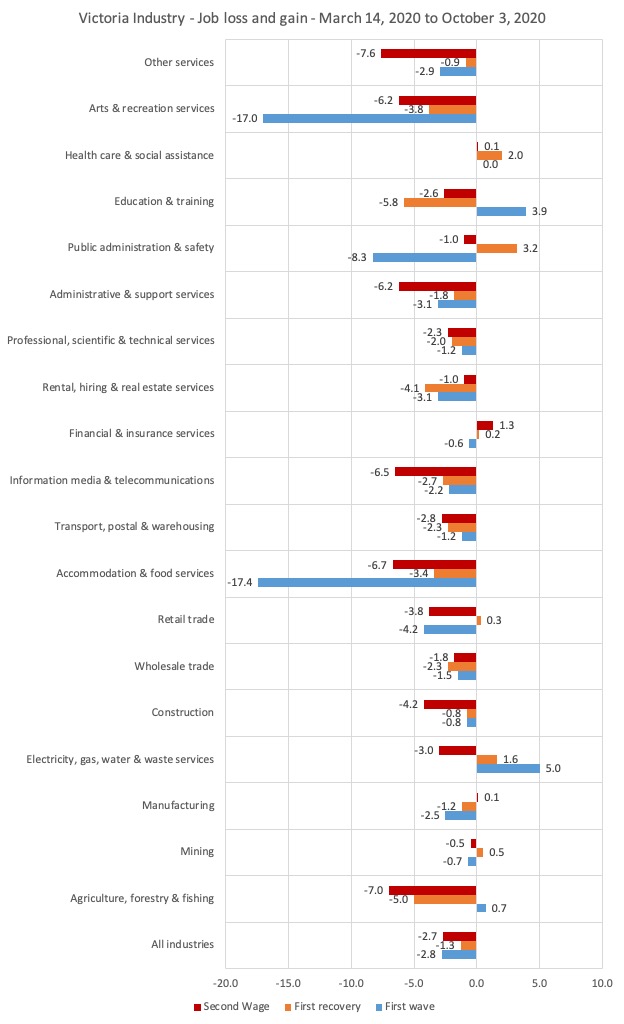
And here is the breakdown by the three phases (applicable to the overall economy).
State job loss breakdown
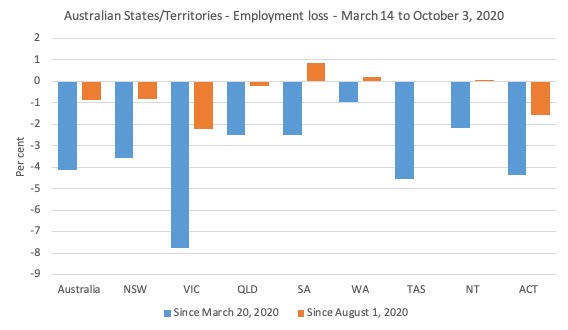
The following graph shows the employment losses from March 14, 2020 to October 3, 2020 for the States and Territories (blue bars), while the orange bars shows what has happened since August 1, 2020, which was the date when the recovery in the national index ceased and job losses resumed.
Clearly the renewed lockdowns are impacting on Victoria. But it is worrying to see the recovery stall in NSW, Queensland, and the ACT as well.
It is hard to blame that on Victoria alone.
This table comes from the ABS Table 1 – and shows the summary of the outcomes for states and territories for various periods.
Conclusion
Troubled times but clearly indicative of a failing policy stance by the Federal government who think their miserable fiscal intervention in March and April would be sufficient.
The fact that the first recovery period failed to regain the jobs lost was an indicator that the policy intervention was insufficient.
Not to be content with the penny pinching in the first wave, the Federal government is now cutting spending soon, months if not years before they should.
The second-wave job losses tell us clearly that more needs to be done. Policy failure again.
I outlined a number of initiatives that I would be pursuing if I was the Treasurer in the last update 4 weeks ago – Latest employment data in Australia continues sorry tale and what I would do about it (September 24, 2020).
Since then we have had the Treasurer’s fiscal statement, which I analysed in this blog post – Australia – Treasurer’s fiscal statement 2020-21 – abandons nation building (October 8, 2020).
Summary: a really poor document and strategy.
The fact that the nation is going backwards again is a testament to his failure as a Treasurer.
And since then, the Treasurer has been berating the Labour Premier in Victoria demanding he open up the economy and more just to score political points. He knows that if Victoria opens too quickly from its disastrous second wave then they will be back to where they were in August.
Cheap shots from a failed Treasurer. He should resign due to his incompetence.
That is enough for today!
(c) Copyright 2020 William Mitchell. All Rights Reserved.
This Post Has 0 Comments