Today (April 18, 2024), the Australian Bureau of Statistics released the latest - Labour Force,…
US claimants recovery stalls
Today, I celebrate – my home town of Melbourne has recorded zero new infections for the first time since June 9, 2020 and zero deaths. But things are not so hot elsewhere in the world. As the US labour market started to rebound over the summer, I stopped updating my analysis of the claimants data horror story that had earlier demonstrated how sharp the decline in March and April had been. But I have still been monitoring it on a weekly basis and the information we are now getting from the US Department of Labor’s weekly data releases are indicating that as the virus escalates, seemingly out of control, the labour market recovery has all but stalled and a reasonable prediction would be that it will deteriorate somewhat if the infection rate leads to tighter restrictions (which it should). A relatively short blog post today (tied up with things today) – just some notes as I updated the data to see what was going on. The conclusions are obvious. Much more fiscal support is needed in the US, especially targetted at the bottom end of the labour market. Devastation will follow with the sorts of numbers that appear to be entrenched at present.
Here is the latest update (as for the week ending October 17, 2020) from the US Department of Labor’s weekly data releases for the unemployment insurance claimants.
The Department of Labor provides an archive of the weekly unemployment insurance claims data back to January 7, 1967 – HERE.
The weekly data can be found in the – UI Weekly Claims Report.
New claimants recovery stalled
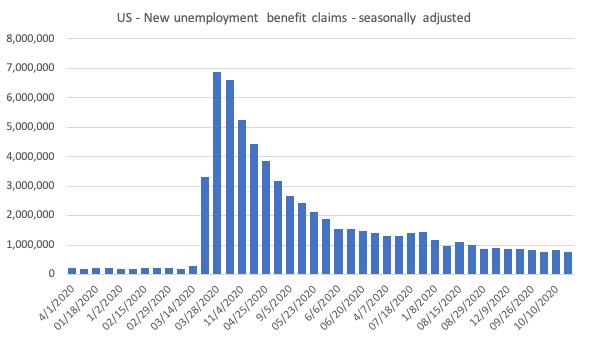
The next graph shows the data for New claimants data from January 1, 2020 to October 17, 2020.
I had previously posted the full sample, which showed how insignificant the previous deep recessions of the early 1980s, 1990s and the GFC were by comparison with the current event.
But we get little information from seeing a huge vertical line dwarfing all previous observations. We know the scale.
This series provides the best information on the state of the labour market and reinforces the information we learned from the monthly payroll and labour force survey data, which showed that while employment was still growing in September, the rate of improvement has moderated significantly.
I analysed that data in this blog post – US labour market – floundering now despite modest gains (October 5, 2020).
The problem that the data on new (first-time) claimants for benefits demonstrates is that the weekly claims have not substantially declined since August, which tells me that employment growth is not fast enough to absorb the accumulated pool of jobless workers.
Continuing claims and covered unemployment rate
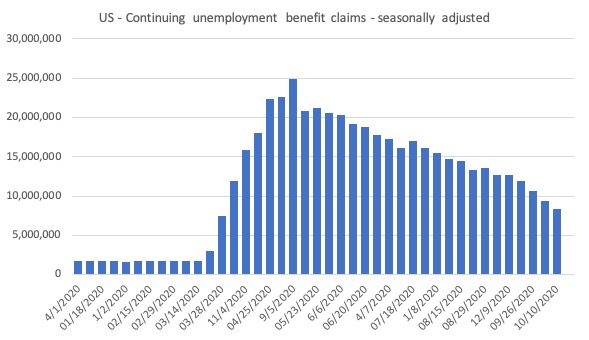
The other series, which is of interest is the continuing claims, which lags the new claims by a week.
The following graph shows that this series is dropping steadily and is now at 8.3 million. On March 7, 2020, the stock of continuing claims was 1,702,000 persons. So the figure has grown nearly 5 times.
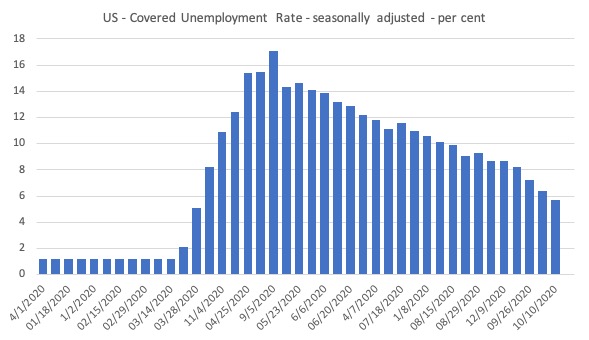
The next graph shows the evolution of the insured unemployment rate, which measures the proportion of the labour force that is collecting unemployment benefits.
It fell from 6.4 per cent to 5.7 per cent which might on the surface suggest an improving situation.
However, the monthly labour force data (see link to my analysis above) showed that the decline in the unemployment rate was mostly driven by a fall in the participation rate, which effectively means that the official unemployed are becoming hidden unemployed outside the labour force measure.
Bringing together the archived data and the most recent release (October 17, 2020), the following table tells the story for those who like numbers.
| Week ending | Initial Claims (SA) | Weekly Change | Cumulative sum since March 7, 2020 |
| March 7, 2020 | 211,000 | -6,000 | n/a |
| March 14, 2020 | 282,000 | +71,000 | 282,000 |
| March 21, 2020 | 3,307,000 | +3,025,000 | 3,589,000 |
| March 28, 2020 | 6,687,700 | +3,560,000 | 10,456,000 |
| April 4, 2020 | 6,615,000 | -252,000 | 17,071,000 |
| April 11, 2020 | 5,237,000 | -1,378,000 | 22,308,00 |
| April 18, 2020 | 4,442,000 | -795,000 | 26,750,000 |
| April 25, 2020 | 3,867,000 | -575,000 | 30,617,000 |
| May 2, 2020 | 3,176,000 | -691,000 | 33,793,000 |
| May 9, 2020 | 2,687,000 | -489,000 | 36,480,000 |
| May 16, 2020 | 2,446,000 | -241,000 | 38,926,000 |
| May 23, 2020 | 2,123,000 | -323,000 | 41,049,000 |
| May 30, 2020 | 1,897,000 | -226,000 | 42,946,000 |
| June 6, 2020 | 1,566,000 | -331,000 | 44,512,000 |
| June 13, 2020 | 1,540,000 | -26,000 | 46,052,000 |
| June 20, 2020 | 1,482,000 | -58,000 | 47,534,000 |
| June 27, 2020 | 1,408,000 | -74,000 | 48,942,000 |
| July 4, 2020 | 1,310,000 | -98,000 | 50,252,000 |
| July 11, 2020 | 1,308,000 | -2,000 | 51,560,000 |
| July 18, 2020 | 1,422,000 | 114,000 | 52,982,000 |
| July 25, 2020 | 1,435,000 | 13,000 | 54,417,000 |
| August 1, 2020 | 1,191,000 | -244,000 | 55,608,000 |
| August 8, 2020 | 971,000 | -220,000 | 56,579,000 |
| August 15, 2020 | 1,104,000 | 133,000 | 57,683,000 |
| August 22, 2020 | 1,011,000 | -93,000 | 58,694,000 |
| August 29, 2020 | 884,000 | -127,000 | 59,578,000 |
| September 5, 2020 | 893,000 | 9,000 | 560,471,000 |
| September 12, 2020 | 866,000 | -27,000 | 61,337,000 |
| September 19, 2020 | 873,000 | 7,000 | 62,210,000 |
| September 26, 2020 | 849,000 | -243,000 | 63,059,000 |
| October 3, 2020 | 767,000 | -82,000 | 63,826,000 |
| October 10, 2020 | 842,000 | 75,000 | 64,668,000 |
| October 17, 2020 | 787,000 | -55,000 | 65,455,000 |
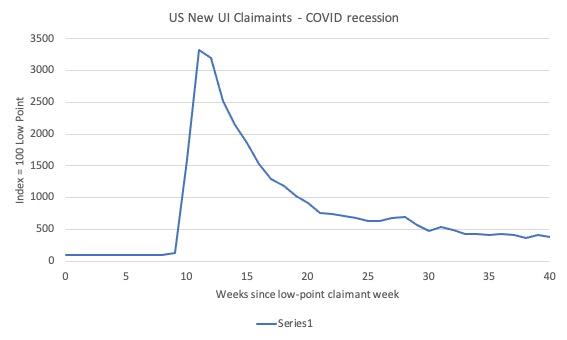
Past Recessions Comparison
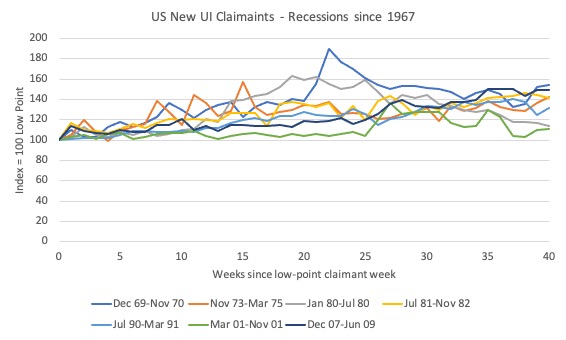
I wondered what the behaviour of this time series had been in past recessions. The data goes back to January 1967, which means it covers 8 official US recessions.
I started the indexes at 100 for each recession in the week where the lowest claimant count occurred before the recession began and then graphed the index out to 40 weeks, which is the duration of the current COVID recession.
The following graph covers the 7 official recessions up to and including the GFC.
I decided to graph the COVID episode separately because it completely obliterates any of the past dynamics in amplitude.
As you can see, the pattern is very similar for all these events (with some variational spikes).
Here is the graph for the COVID period. Stunning.
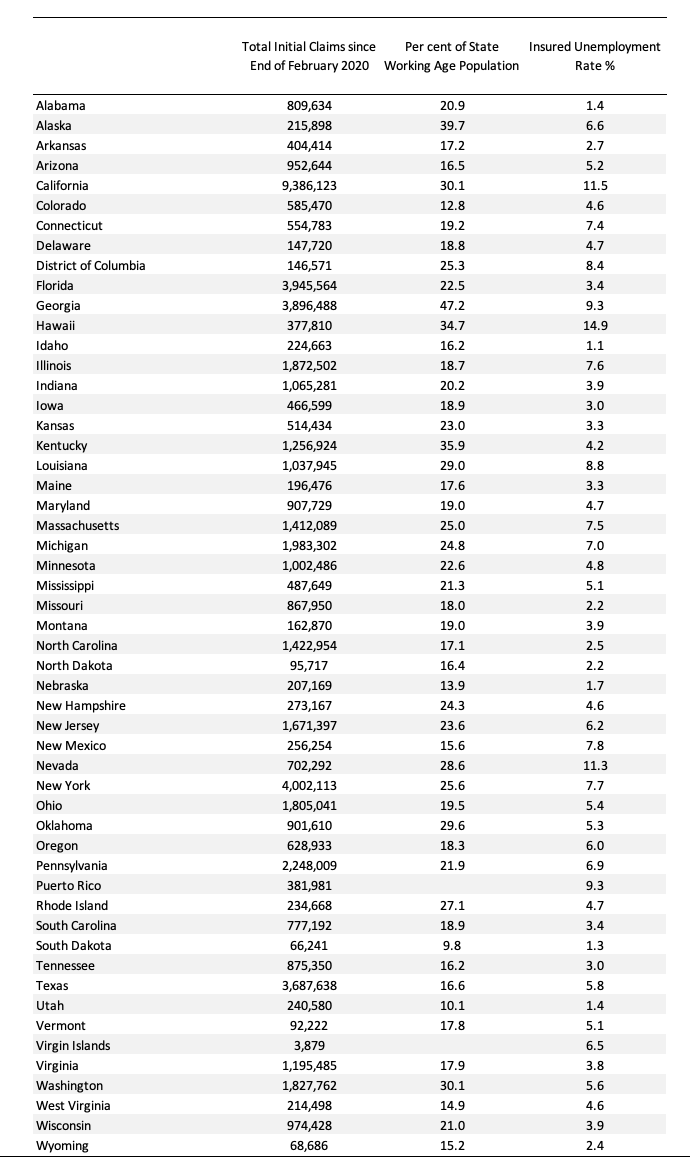
The spatial patterns
The following Table presents the most recent data to October 10, 2020 for the US states.
It shows the cumulative claims since February 26, 2020 to October 10, 2020 in total and as a percentage of the State’s working age population, as well as the insured unemployment rate.
Upcoming event – Public Access
October 29, 2020 – Economic Policy after Brexit and COVID-19: Taking Control
The team at the Full Brexit is sponsoring this event.
Date: October, 29, 2020.
Time: 20:00-21:30 (online event) – This is London time.
Britain is in its worst economic crisis since the Great Depression. The costs of the coronavirus pandemic continue to dwarf even the most exaggerated Remainer predictions of the costs of leaving the European Union.
But neoliberal shibboleths have also been shattered, with the government intervening to save jobs and businesses, while even the EU has set aside its treasured state aid rules (despite continuing to try to force the UK to abide by them).
At the same time, governments around the world seem short on imaginative ideas to reboot the economy. The priority seems to be trying to restore a pre-crisis system that was already failing millions long before COVID-19.
So how do we really “build back better”? How do we avoid a slow, jobless recovery – a degraded “new normal”? What policies and programmes are required to allow working people to take control of their lives, and enjoy a more prosperous and fulfilling future?
Join two world-leading experts to debate these crucial issues:
- Professor Costas Lapavitsas, renowned economist, former member of the Greek parliament, and author of The Left Case Against the EU (Polity, 2019).
- Professor Bill Mitchell, one of the leading lights of Modern Monetary Theory, and co-author, with Thomas Fazi, of Reclaiming the State: A Progressive Vision of Sovereignty for a Post-Neoliberal World (Pluto, 2017).
Professor Costas Lapavitsas, renowned economist, former member of the Greek parliament, and author of The Left Case Against the EU (Polity, 2019), and
The event is free but you have to register to get Zoom access. Registered attendees will be emailed with the link on the day of the event.
Conclusion
Without further fiscal support, I suspect the situation will become very grim in the US as the pace of the recovery has slowed and this locks in those who lost jobs at the beginning of the crisis to a long period of joblessness.
That is enough for today!
(c) Copyright 2020 William Mitchell. All Rights Reserved.
This Post Has 0 Comments