We sometimes encounter commentary that blows away the smoke that provides cover for important myths…
US and UK fiscal stimulus supporting growth while the delays in the Eurozone lead to a double-dip recession
Last week (April 29, 2021), the US Bureau of Economic Analysis published the latest national accounts data – Gross Domestic Product, First Quarter 2021 (Advance Estimate) – which showed that the US economy grew by 1. The following day (April 30, 2021), saw Eurostat announce that the Eurozone contracted by 0.6 per cent in the first-quarter 2021, which means it is now enduring a double-dip recession. The European Union, now without Britain as a member, contracted by 0.4 per cent. In contrast, with Britain now out of that mess and determining its own future, we saw the British economy return a positive GDP growth rate in February as exports rose and government stimulus sustained domestic activity. Why should we be surprised about this. In this post, I examine the US situation in more detail and reflect on some interesting trends in the UK. The Eurozone situation is too depressing to write about on a sunny day!
The US rebound
The US Bureau of Economic Analysis said that:
Real gross domestic product (GDP) increased at an annual rate of 6.4 percent in the first quarter of 2021 … In the fourth quarter of 2020, real GDP increased 4.3 percent.
Note that the BEA is using the annualised quarterly figure here (multiplying the March-quarter growth by 4) rather than the actual annual (year-on-year) growth rate which is the percentage shift from the March-quarter 2019 to the March-quarter 2020.
That aggregate was 0.4 per cent, which still means that the US economy managed to grow a tad during the pandemic.
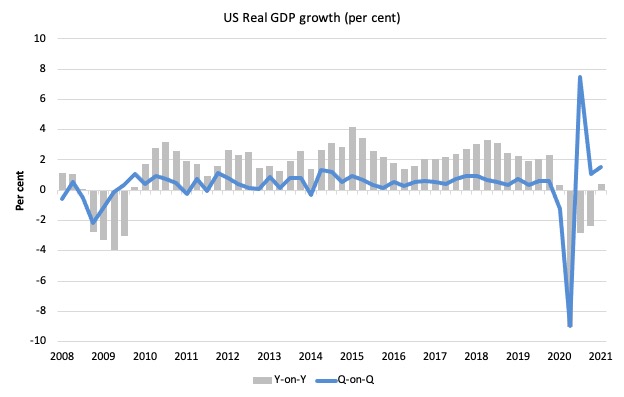
The quarter-on-quarter growth outcome for the March-quarter was 1.56 per cent, which built on the 1.06 per cent in the December-quarter.
The following sequence of graphs captures the story.
The first graph shows the annual real GDP growth rate (year-to-year) from the peak of the last cycle (December-quarter 2007) to the March-quarter 2020 (grey bars) and the quarterly growth rate (blue line). Note the date line starts at March-quarter 2008.
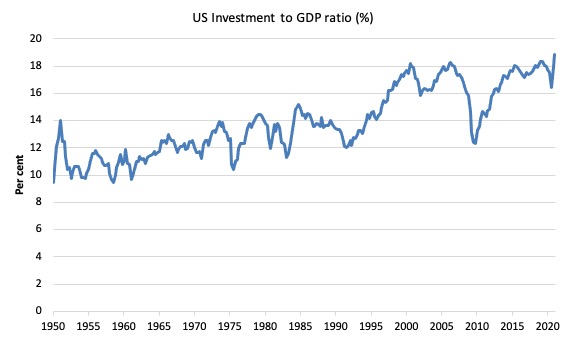
The next graph shows the evolution of the Private Investment to GDP ratio from the December-quarter 2007 (real GDP peak prior to GFC downturn) to the March-quarter 2021.
The decline in the investment ratio as a result of the crisis was substantial and endured for 2 years. As a result the potential productive capacity of the US contracted somewhat. There are various estimates available but the overall message is that potential GDP fell considerably as a result of the lack of productive investment in the period following the crisis.
In more recent times, the investment ratio has stalled and then took a small hit during the pandemic.
Since March 2020, the ratio has risen from 17.7 per cent to 18.8 per cent in the March-quarter 2021. The ratio rose 0.9 points in the first three months of 2021.
It is now at the highest level since the current BEA data series began in the March-quarter 1947.
I will have more to say about the current impact on the evolution of potential GDP in a later blog post.
Contributions to growth
The accompanying BEA Press Release said that:
The increase in real GDP in the first quarter reflected increases in personal consumption expenditures (PCE), nonresidential fixed investment, federal government spending, residential fixed investment, and state and local government spending that were partly offset by decreases in private inventory investment and exports. Imports, which are a subtraction in the calculation of GDP, increased …
The increase in PCE reflected increases in durable goods (led by motor vehicles and parts), nondurable goods (led by food and beverages) and services (led by food services and accommodations). The increase in nonresidential fixed investment reflected increases in equipment (led by information processing equipment) and intellectual property products (led by software). The increase in federal government spending primarily reflected an increase in payments made to banks for processing and administering the Paycheck Protection Program loan applications as well as purchases of COVID-19 vaccines for distribution to the public. The decrease in private inventory investment primarily reflected a decrease in retail trade inventories.
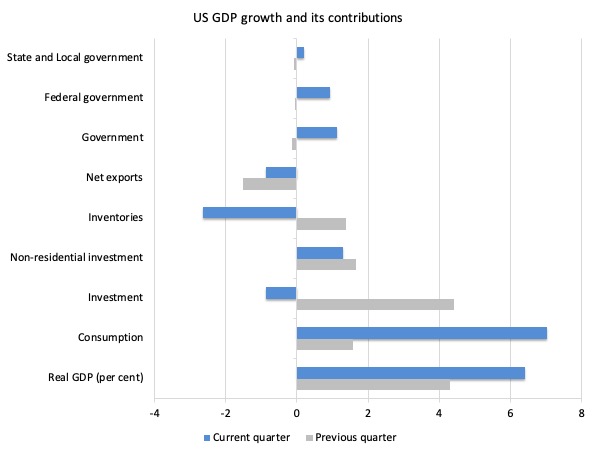
The next graph compares the December-quarter 2020 (grey bars) contributions to real GDP growth at the level of the broad spending aggregates with the March-quarter 2021 (blue bars).
The major driver of the GDP rebound has been the recovery in personal consumption spending, which is also probably driven the run down in retail trade inventories.
The change in Administration in the US has seen the government sector increase its contribution to the recovery.
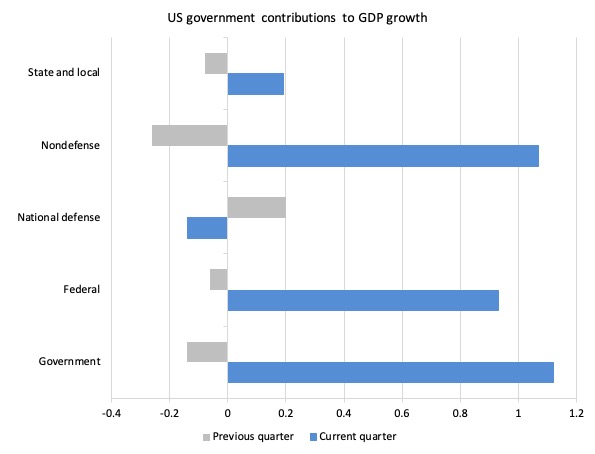
The next graph decomposes the government sector and shows that Federal non-defense spending has dominated.
The next graph breaks down the contributions to real GDP growth of the various components of investment.
The overall decline was driven by the inventory reductions, while other capital formation expenditure was positive and contributed to production.
That is a good sign.
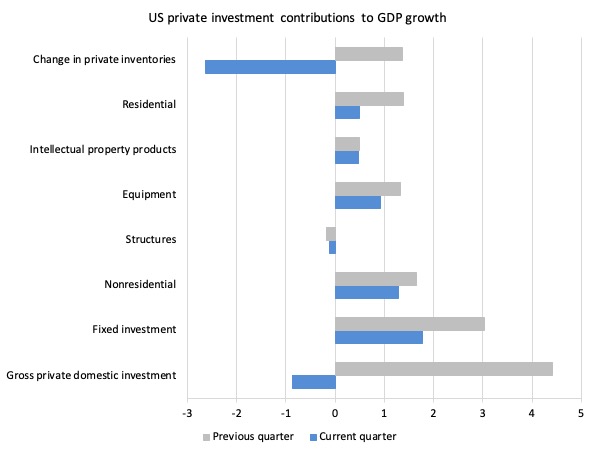
One would expect the inventory cycle to drive an increase in stocks in the June-quarter reinforcing the positive sentiment in the other investment catgories.
US Household consumption and debt
The Federal Reserve Bank of New York publication – Household Debt and Credit Report – was last updated for the December-quarter 2020 (published February 2021) – (PDF Download).
It shows:
… total household debt increased by $206 billion (1.4 percent) to $14.56 trillion in the fourth quarter of 2020, driven in part by a steep increase in mortgage originations. The total debt balance is $414 billion higher than at the end of 2019. Newly originated mortgages, which include refinances, reached a record high of $1.2 trillion, surpassing in nominal terms the volumes seen during the historic refinance boom in the third quarter of 2003. Auto and student loan balances increased by $14 billion and $9 billion, respectively …
Credit card balances are $108 billion lower than they had been at the end of 2019, the largest yearly decline seen since the series begins in 1999, consistent with continued weakness in consumer spending as well as paydowns by card holders.
So the housing market is robust but households are taken the opportunity of an increased saving rate to pay down their credit card debt.
The data also shows that:
Aggregate delinquency rates have continued to decline in the fourth quarter and continuing what was seen in the second and third, reflecting an uptake in forbearances (provided by both the CARES Act and voluntarily offered by lenders), which protect borrowers’ credit records from the reporting of skipped or deferred payments.
So government fiscal support is both allowing US consumers to save and pay down some debt but also stimulating investment in housing.
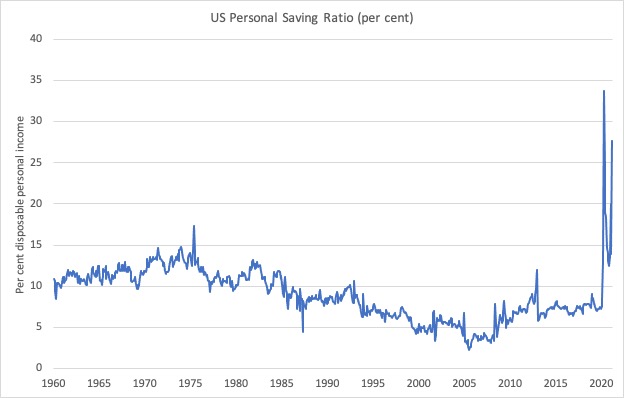
The following graph shows the US personal saving rate (personal saving a a percentage of disposable personal income).
The strengthening consumption expenditure and the credit card pay downs are the result of the fiscal support being provided by the government sector.
UK Household saving ratio
A similar trend of paying down credit card debt is occurring in the UK. UK households have substantially reduced their credit card exposure over the last year.
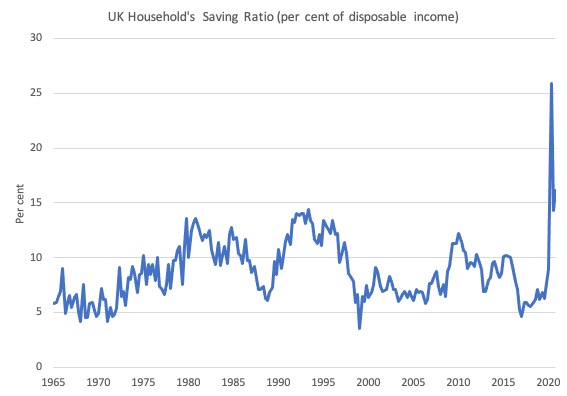
The ONS data for the – Household’s saving ratio – is shown in the next graph.
The rise in the household saving ratio is observed in most countries as the impacts of the lockdowns reduced expenses (working from home) and reduced opportunities to spend.
The British ratio peaked at 25.9 per cent in June 2020 (the average since 1963 has been 8.7 per cent).
The question is what happens next.
Many commentators are projecting that the build up of savings and pent up frustration will unleash a consumption expenditure boom and expose the UK economy to accelerating inflation.
However, it is unclear what the impacts of the short-term crisis borrowing which some households have engaged in to stay afloat as the pandemic reduced their incomes.
Evidence provided by the UK Parliamentary Committee on Work and Pensions – Universal Credit: the wait for a first payment (published October 19, 2020)- found that:
1. “people on Universal Credit are more likely to need a food bank or have rent arrears than people on the legacy benefits that it replaces …”
2. There was a longer than 5 weeks delay in first payment receipt for “more than 200,000 people” and “many disabled people and people with health conditions must wait much longer than five weeks to receive their first payment in full”.
3. These delays increased the likelihood that low-income persons would fall prey to so-called payday lenders.
In November 2020, the StepChange Debt Charity group released a report – Tackling the coronavirus personal debt crisis –
which showed that:
A personal debt crisis is emerging: the number of people affected by coronavirus in severe problem debt has almost doubled since the beginning of the outbreak to 1.2 million people.
The number of those affected who have fallen into arrears or borrowed to make ends meet has increased from 4.6 to 5.6 million …
… 28% of adults in Great Britain had experienced at least one negative change of circumstances following the beginning of the coronavirus outbreak
So how all that plays out is uncertain but it is hard to see a massive consumer-led boom occurring in the coming year for the UK.
UK Debt trends
However, while some households that are experiencing financial stress are resorting to emergency credit, overall UK households are taking the opportunity to improve their balance sheet positions.
I have been trawling through the latest data from the Bank of England to understand how far this dynamic has gone.
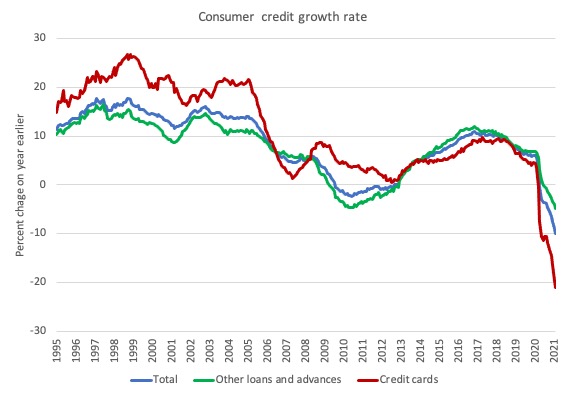
The following graph shows the monthly growth (annual rate) in consumer credit in the UK since March 1995 to February 2021.
It gives a good indication of the speed at which credit is expanding or contracting over a year.
The data series began in 1994 and you can see two main features:
1. The credit boom before the GFC was not repeated in the slow recovery following the extended recession. British consumers were more cautious in their use of credit card debt.
2. The pandemic has seen a massive decline in the net credit card debt. That means that consumers are paying off their credit card debt at a faster rate than they are taking on new debt.
The House of Commons Library issued an interesting report last week (April 30, 2021) – Household Debt: Key Economic Indicators – which showed that “Household debt peaked in Q2 2008 at 150.1% of household disposable income … In Q4 2020 it was 129.5%.”
The Insolvency Service in the UK publishes monthly statistics and the latest (issued April 15, 2021) – Monthly Insolvency Statistics March 2021 – shows that for England and Wales:
1. “The number of registered company insolvencies in March 2021 was … 20% lower than the number registered in the same month in the previous year … [and] … 37% lower than the number registered two years previously …”
2. “For individual insolvencies, the number of bankruptcies in March 2021 was 1,028, while the number of Debt Relief Orders (DROs) was 1,591. Both were 31% lower than in March 2020 and 34% lower than in March 2019.”
3. “Overall numbers of company and individual insolvencies have remained low since the start of the first UK lockdown in March 2020, when compared with pre-pandemic levels.”
This is, in part, a reference to the introduction of the – Corporate Insolvency and Governance Act 2020 (June 26, 2020) – which effectively invoked a moratorium on debt repayments to allow companies “to restructure unmanageable debt”.
The lower insolvencies were mostly due to government liquidity support rather than the moratorium in place.
The financial support that the UK government has clearly provided in the wake of the pandemic has helped considerably. Whether it has been enough is debatable but not the issue here.
The point is that this is what the UK government should have done when the GFC hit.
Instead of invoking a deficit and debt hysteria and introducing austerity measures, George Osborne should have expanded the fiscal deficit further to provide essential support for private saving and a household debt reduction effort.
That is what we know about so-called balance sheet recessions where the problem is that non-government debt is too high and an extended period of saving and debt reduction is needed, which must be supported by larger than normal fiscal deficits.
The fact that it didn’t meant that the economy took so much longer to get moving again but also left households with a legacy of excessive debt.
The pandemic has seen a different response from government which is allowing British households in total to pay down credit card and other debt in a significant way.
Conclusion
One of the major responsibilities of a government is to reduce the possibility of a deep and extended recession.
The faster an economy can recover from a recession the less damage there is to business firms and workers.
Fiscal support should always err on the side of ‘too much for too long’ rather than ‘too little for not long enough’.
The scarring from the latter error is much worse and harder to rectify than any slight ‘overheating’ issues that arises from erring in the former way.
Fortunately, and in contradistinction to what we saw during the GFC, governments are not showing any strong tendency to invoke austerity any time soon.
That is enough for today!
(c) Copyright 2021 William Mitchell. All Rights Reserved.
Bill, what do you think of Pres. Biden’s plans for additional spending?
They are $1.8T so far, and $2.2T and $1.8T more later, IIRC. =$5.8T
Is this way too much?
IMHO, it may not be enough.
.
Not enough, because most of it is spread over many years.
.
Steve,
I suspect he started big because he knew that it will be whittled down as he pushes it through the blockage that is the Senate.
Fortunately we don’t have that problem in the UK, or debt ceilings, or PAYGO. All we have is politicians with ideological blinkers.
Whenever there is a discussion of credit card debt, I can’t help comparing our position to that in China, where they went straight from payment only by cash to the now mostly used payment by mobile phone app wallet, connected to bank account: immediate debit. Sure people still borrow privately for business, education etc, but debt is taken on a lot less lightly.
The inflationistas are squawking loudly in the press both in the US and Canada. It is to be hoped that their foolish demands for austerity will be ignored.
I love this …
As it shows once you scratch the surface of the sectoral balances.Of what to look at and where to find it under certain conditions.
Concerns would be 3 fold or 100 fold depending….
1. Economic rent seekers – Out of one side of their mouth they’ll say wages cannot rise because of the fear of inflation even though they do not have to compete for labour. Out of the other side of their mouth they’ll say they have to increase what they charge for household bills, watching TV, mobile phones, internet usage, travel, education, housing, using the fear of job losses. Even though they captured the majority of furlough payments. We’ve heard it all before how the rent seekers and FIRE sector create this narrative for the last 50 years to entrench their power over everyone else for geopolitical reasons.
2. How is the investment figure to GDP calculated ?
I take it no loans are included in that figure. Loans that were not used for investment but for survival so businesses could continue to pay the FIRE sector for and rent seekers?
Is the investment figure big enough considering the amount of savings held by the non government sector? Shortages have been reported everywhere from chickens to wood. What happens if the private sector can’t adjust to demand quick enough and inflation does indeed start to rise. What will the response be ?
3. We know what the response will be. They’ll increase interest rates thinking they are fighting inflation which will only increase the chance of causing it. Get trapped in a cycle of madness continually raising the rate and increasing the chances of inflation every time they do it. Whatever they do they do it early to stay ahead of the curve they say that destroys the recovery.
So unless, they have been listening to Bill, Warren and Stephanie we know what the recovery will look like. The status Quo recovery of the last 50 years. Low growth that allows both the FIRE sector and the economic rent seekers to increase their power for geopolitical reasons. If inflation gets out of control because of their actions it will be a great opportunity for them to blame MMT. Kill two birds with one stone.
We are on the very cusp of finding out if we are indeed living through a paradigm shift in economics or if politics stay the sane. The politics of not caring what happens inside your own borders but more interested in what happens abroad.
My money is on politics stay the same and the paradigm shift won’t happen. There are no signs whatsoever that things are going to change. What we see is the usual status quo recovery of the last 50 years and fiscal should ONLY be used in a downturn.
I do however see many examples of the US doubling down on foreign policy and going even further than they ever would have 20 years ago. To achieve their goals without sending in the US military they need a very powerful and consolidated and coordinated FIRE/ rent seeker sector.
Pay your money and take a chance – What’s it going to be a paradigm shift in economics or politics stay the same ? Well at long last we are about to find out.
“So government fiscal support is … also stimulating investment in housing.” Unless this is new build it is not investment. Most activity in the housing market is merely churning second-hand houses, which is private banks’ predilection. The main component of house price is land price – location, location, location.
“The main component of house price is land price”
The main component of a house price is planning permission. Land without it is still fairly cheap – prime arable, the most expensive land type, is still less than £10,000 per acre. That shoots up to £1million per acre once it gets planning permission.
Well, well, well….look what we have here from the normally egregious IEA:
https://www.theguardian.com/business/2021/may/03/uks-rising-debts-can-be-coped-with-says-rightwing-thinktank
” “We do not wish to downplay the seriousness of the scale of the debt,” wrote the authors, Forrest Capie and Geoffrey Wood, both professors at City, University of London. “Clearly steps should be taken by government to curb spending and behave extra prudently. Our central point is that large-scale debt is far from unknown in our economic experience. And it would be misguided and futile to jump to tax-raising measures. The debt can be coped with and the best way of doing that is to encourage economic growth.”
They also argued it would be “misguided and futile to jump to tax-raising measures”, instead calling for deregulation and simplifying the tax system. Inflation was a danger if public debt remained high, they said, but it was not inevitable.”
Hah! Yes, inflation. But whatever happened to insolvency, bankruptcy, and “there’s no money left”?
We are indeed living through unusual times!
Overall model of the FIRE sector: producers, consumers, government, world
Incorporating the Rentier Sectors into a Financial Model
https://michael-hudson.com/2012/09/incorporating-the-rentier-sectors-into-a-financial-model-3/
” Creating a more realistic model of today’s financialised economies to trace this phenomenon requires a breakdown of the national income and product accounts (NIPA) to see the economy as a set of distinct sectors interacting with each other. These accounts juxtapose the private and public sectors as far as current spending, saving and taxation is concerned. But the implication is that government budget deficits inflate the private-sector economy as a whole. “
“The main component of a house (land) price is planning permission”. With that difference in value (for the UK) per Neil Wilson, no wonder developers are so keen on dodgy Jenrick as Secretary of State for Housing, Communities and Local Government. And even more reason for local government provision of affordable housing, instead of the 5 bedroom detached gated communities favoured by developers. But there are thousands of acres around London where the planning permission was given many years ago and the mansions and grounds have already been set out and inherited. A lot of this ought to be compulsorily repossessed for affordable housing before any more green fields are concreted over. If an American company can buy up a town to turn it into a coal mine, as I recently read, then a government ought to be able to act in the face of a housing crisis.
Why isn’t MMT at the forefront of creating a better way than GDP to assess a country’s overall economic situation? If it is, please school me. I understand that New Zealand, for example, has started to use a Happiness Index to measure economic growth in a manner that includes human and environmental wellbeing. I’m also aware of a number of interesting proposals put forward by various economists along similar lines. If MMT, as a discipline, has not already thrown itself into the effort to devise a broader and deeper standard of economic measurement, shouldn’t it do so and take the lead, given the clarity of its lens?
“The main component of a house price is planning permission.” Put another way, the main component of land value is permitted use. The highest permitted use is for residential – that despite the fact that residential, except in the growing rental market, does not produce a revenue stream. The reason for this is that residential is so lightly taxed (there’s an inverse relationship between tax and price). New build is – and will always be – a minor part of the housing stock. What do you do about the second-hand homes which are unaffordable? LVT is the only solution: high LVT rate on all but owner-occupied primary residences (which should be registered as such at Land Registry).
Another concern would be considering the right understand MMT more than the left. Is if the right decide to implement the JG as part of a pandemic recovery.
The Right say okay we are going to get right behind the JG and introduce it straight away. Then once they’ve rebuilt the whole infrastructure of the economy via a green new deal. They then implement tax cuts that bankrupt local councils, states, Euro countries etc. That then forces councils, states, Euro countries to sell off the infrastructure for a penny to the private sector.
Who then set up rent extracting opportunities on the infrastructure they bought for a penny. Take even more from the household sector savings whilst not increasing wages.
I’d actually be surprised if they have not thought about that. Get everything built for free then take it and charge for it. Under the neoliberal sell it or go bankrupt New York, Chile, Greece blueprint.
Another sound reason why the FIRE sector has to be nationalised because nobody can stop them if they decide to go down that route. What’s needed is what what Dennis Kucinich proposed in his National Emergency Employment Defense Act of 2011 and a new political party set up that can win elections.
Mr Shigemitsu,
That’s just an example of the right understanding MMT better than the left. No change in stance whatsoever. Announcing something they’ve known as fact for 100 years and more.
” instead calling for deregulation and simplifying the tax system” and ” government to curb spending and behave extra prudently. ”
That’s the Thatcher and Regan bible. Forrest Capie and Geoffrey Wood. Forrest is a mouth piece for the FIRE sector. In 1999, Capie was appointed by Francis Maude as a member of the new Council of Economic Advisors, tasked with assisting the Shadow Chancellor of the Exchequer to develop the Conservative Party’s economic policy.
Professor Geoffrey Wood has lectured in Economics at the University of Warwick and in Banking and Finance at City University, London, where he has been Professor since 1986. He worked at the Bank of England as Economist. Another mouthpiece for the FIRE sector.
Probably funded by the City Of London. Same place as Professor John Hearn who promotes a reverse income tax that Warren has debated with my times.
The drown the government in the bath tub brigade. Banks should be the allocator of real resources. That can never get voted out or be held accountable or held responsible for their actions by the voters. These two FIRE sector spokesmen are the” we need a balanced budget” twins , dumb and dumber. John Hearn being the dumbest of the lot.
Dear Bill,
The US economy exhibits signs of robust recovery which is predicted that it will lead to one of the largest expansion in the post WWII era, as the pandemic is contained. At the same time, as the Eurozone continues to contract, it has already fallen into double-dip recession and there aren’t any clear indications of reversal. Notwithstanding these developments, the Euro is gaining strength against the dollar and retains its highest value over the last year. How is this reconciled?
The main component of house price IS land price, which itself is a function of Planning Permission.
@jonM All already-built homes have planning permission. How does that knowledge help to solve the housing crisis?