The Australian Bureau of Statistics (ABS) released the latest data today (March 12, 2025) on…
Staggered minimum wage increases in Australia further punish the most vulnerable workers
Last Thursday, guest blogger Scott Baum analysed the recent decision by the Fair work Commission – Annual Wage Review 2020-21 – on June 16, 2021, which raised the National minimum Wage in Australia to $772.60 per week or $20.33 per hour. See his blog post at – The working poor are still poor in Australia (July, 2021). Today, I also review that decision as part of my annual surveillance on minimum wage trends in Australia. The Fair Work Commission, is Australia’s wage setting tribunal, and as part of that task conducts an annual wage review which sets minimum wages across the nation. The minimum wage determination then flows on to other wage rates (these are the wage awards linked to the NMW). The decision is poor because it will further undermine the real living standards of tens of thousands of low paid workers. In particular, the decision to phase in the pay increases (November 2021 for Group 2 Awards and February 2022 for Group 3 Awards) is a disaster for low-paid workers in the hospitality, retail and tourism sectors. Meanwhile the major employer groups argued for zero or mimimal nominal rise while enjoying growth in profits with rising productivity growth. A scandalous indictment of our system.
In this blog post – Australia’s minimum wage rises – but not sufficient to end working poverty (June 6, 2017) – I outlined:
1. Progressive minimum wage setting principles.
2. The way staggered wage decisions (annually) lead to falling real wages in between the wage adjustment points.
I won’t repeat that analysis here. But it is essential background to understanding why the decisions taken by Fair Work Australia have been inadequate for a long time.
The FWA Decision
In its 2020 decision – Fair Work Australia wrote:
The factors the Panel are required to take into account have led it to award an increase of 2.5 per cent. The NMW will be $772.60 per week or $20.33 per hour. The hourly rate has been calculated by dividing the weekly rate by 38, on the basis of the 38-hour week for a full-time employee. This constitutes an increase of $18.80 per week to the weekly rate or 49 cents per hour to the hourly rate.
The Decision applies to around 2.2 million or 21.0 per cent of all employees in Australia through flow-on effects via Australia’s award pay system.
However, the FWC has estimated in 2020 that “the proportion of all employees that are paid at the adult NMW rate is estimated to be 1.7 per cent (or around 180 200 employees)”.
The Fair Work Commission decision took into account the following considerations:
1. “The Australian economy has recovered to a greater extent and more quickly than anticipated”.
2. “The improved recovery was fuelled in large part by strong household spending and public demand, as well as better health outcomes and continued expansion of monetary and fiscal policy.”
3. “there were ‘significant downside risks in the period ahead’ and that the economic considerations ‘weigh in favour of greater moderation in terms of the outcome of the Review’.”
4. The previous forecasts of economic activity that the 2019-20 Review was based on (that is, last year’s decision) “proved too pessimistic, with improvement across most indicators recorded during the second half of 2020.”
5. “In line with expectations of strong demand for labour throughout 2021, job vacancies as a proportion of the labour force are at historically high levels, at over 2 per cent.”
6. “labour productivity improved over the year to the March quarter 2021. GDP per hour worked increased by 2.5 per cent and GVA per hour worked (in the market sector) rose by 2.8 per cent”.
7. “Total company gross operating profits increased by 11.9 per cent over the year to the March quarter 2021, which is above the 10-year average”.
8. “every industry had higher profits in 2020 compared to the previous three years except for Finance and insurance services”.
9. “WPI declined to an annual growth of 1.4 per cent for two consecutive quarters in the second half of 2020 … the staggered implementation of the 2019-20 Review decision have all contributed to the historically low rate.” WPI is the wage index and the staggered implementation refers to the delays the FWC introduced to the wage changes.
In other words, wages growth is at record lows and real wages are falling overall. And the lack of immediacy in the minimum wage implementation has exacerbated that parlous state.
10. Any price increases at present are “expected to be temporary”.
So the context in which the FWC made it decision is clear: Corporate profits are booming, wages growth is flat and real wages are falling.
The wage share in national income is also at record lows.
The FWC also noted that:
Households in the lowest household income quintile have a higher propensity to consume and a lower propensity to save relative to other households.
Which means that a pay rise to the lowest-paid workers boost sales immediately and stimulate further employment, contrary to what the submissions from the employer groups say (they are all focused on job loss from minimum wage increases).
The FWC also acknowledged:
… that awarding an increase which is less than increases in prices and living costs would amount to a real wage cut. Such an outcome would mean that many award-reliant employees, particularly low-paid employees, would be less able to meet their needs. For some households such an outcome would lead to further disadvantage and may place them at greater risk of moving into poverty.
However, their decision did follow through on this concern (see below).
This is particularly when we consider that the FWC decided to phase in the increase across difference industrial sectors.
On July 1, 2021, workers in sectors such as healthcare, education etc will be paid the new rate.
However, other workers will have to wait until November 2021, while workers in tourism, hospitality and retail will not see the pay rise until February 2022.
The process of inflation is ongoing so while the FWC can talk about the damage real wage cuts inflict on living standards, the fact is that many workers will have to endure real wage cuts for the next several months, at least.
Real wage cuts for lowest paid workers
Now what is the impact of a 2.5 per cent increase in the NMW? Is it a real wage increase for the lowest paid workers?
Obviously it depends on when the wage increase is awarded.
If we assumed all workers were granted the increase on July 1, 2021 then the following graph shows the annual percentage change in the real National Minimum Wage since the September-quarter 1998 up to September-quarter 2021 (the first quarter the new level will be applicable).
I assume the inflation rate will be constant at its March-quarter 2021 value for the next two quarters.
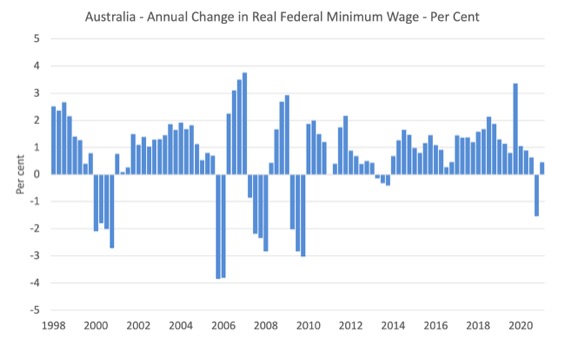
Conclusion: The real purchasing power equivalent of the NMC would rise modestly after a substantial cut in the previous quarter as a result of the FWC decision.
So even for workers (Group 1) who receive the increase as of July 1, 2021, the FWC’s decision does not make up for the cut in the June-quarter.
But we also have to take into account the tax structure.
Once we take into account the tax free threshold of $18,200 and then compute the higher tax the workers will be paying, their disposable annual wage income only grows by around 2.2 per cent.
So with the RBA forecasting CPI-inflation to be 1.75 per cent over the next year, the actual real wage cut in disposable income terms for the lowest paid workers is very substantial.
And for those in Groups 2 and 3, the cuts are much worse, given that the inflation is eroding their purchasing power on a continuous basis and they have to wait to get the nominal increases in their pay (as above).
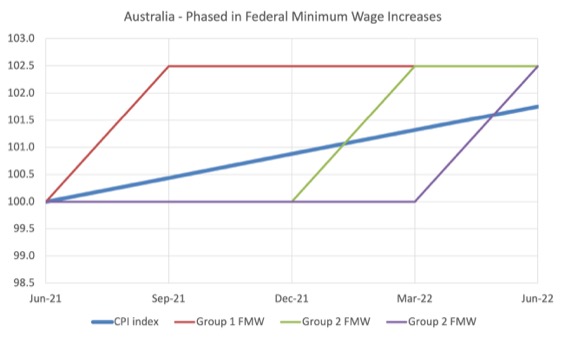
The following graph simulates the phase-in of the pay increases for the three groups.
The blue line is the assumed inflation profile based on the RBA forecast that by June 2022 the inflation rate will have increased by 1.75 per cent.
June 2021 is assumed to be 100 index points.
I then simulated the new minimum wage in nominal terms for the three groups:
1. Group 1 – pay increase from July 1, 2021 – red line.
2. Group 2 – pay increase from November 2021 – green line.
3. Group 3 – pay increase from February, 2022 – purple line.
So while all groups reach June 2022 with the same minimum wage, the continuous nature of the inflationary process has different impacts on the real equivalent of the minimum wage for the three groups.
That impact is indicated by the gap between the inflation blue line and the three minimum wage profile lines.
So Group 1 enjoys a modest real increase in the purchasing power of the minimum wage from July 1, 2021 (through the September-quarter) but then that gain is continuously eroded.
Group 2 sees real purchasing power cut until the December-quarter and then only very modest offsets after that.
Group 3 loses until the final quarter of the year (June-quarter 2022) and the cumulative losses outweigh the final modest gain.
Poverty wages get worse
There was a lot of discussion about a “fair” minimum wage and the concept of a living wage, which is often considered to be 60 per cent of the median wage.
This is sometimes expressed as the 60 per cent of median income poverty line.
The Fair Work Commission agreed that there were many workers in highly disadvantaged situations and contested the claims from the employers that the Commission had no role to play in setting living standards.
In their decision, they said:
We disagree. As we have mentioned, the data … show that for a number of hypothetical household types at various wage rates there was a decline in their disposable income relative to the 60 per cent median income poverty line between the December quarter 2019 and the December quarter 2020 … Those households that improved were mainly as a result of temporary increases to transfer payments, such as a higher JobSeeker payment, during the pandemic period.
In other words, by their own words, the FWC has undermined the task of alleviating poverty in Australia and it was only some temporary fiscal measures (now terminated) that offset that damage.
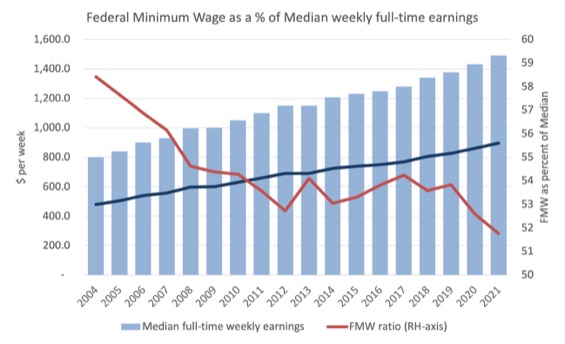
The following graph shows Median weekly earnings of full time employees from 2004 to 2021 (blue bars) and the Federal weekly minimum wage as a proportion of the median (red line, right-axis, per cent).
For 2021 median earnings I extrapolated the annual growth from 2019-20.
The dark blue line is the 60 per cent of median income poverty line.
Since 2010, this desired ratio has languished well below 60 per cent, which is the benchmark that is universally used to denote a ‘poverty threshold’.
The Federal Minimum Wage relativity has worsened in this recent decision.
What is the weekly shortfall?
Conclusion: The Federal Minimum Wage is around $122 per week shy of reaching the 60 per cent of median benchmark and the gap is rising.
The scandal is that the major employer groups like the Australian Chamber of Commerce and Industry (ACCI), the Australian Industry Group (Ai Group) and the Australian Business Industrial (ABI) only wanted a 1.1 per cent increase in the FMW (instead of the 2.5 per cent awarded.
Even worse, the “Master Grocers Australia and the National Farmers’ Federation stipulated no increase.”
This is in an environment where profits and productivity have been rising.
They ran the usual story that wage increases would kill employment.
They said the same thing when they persuaded the FWC to cut penalty rates (weekend and public holidays) for the lowest paid workers and promised an employment bonanza. The data shows that even before the pandemic employment was not rising in the sectors that had cut wages.
And they never say boo when they are handing out massive CEO payments to themselves.
The Australian government also did not show any leadership in the issue providing no guidance to the FWC.
Depriving workers a share of productivity growth
Another way of looking at this dismal outcome is to compare the movement in the Federal Minimum Wage with growth in GDP per hour worked (which is taken from the National Accounts). GDP per hour worked is a measure of labour productivity and tells us about the contribution by workers to production.
Labour productivity growth provides the scope for non-inflationary real wages growth and historically workers have been able to enjoy rising material standards of living because the wage tribunals have awarded growth in nominal wages in proportion with labour productivity growth.
That relationship has been severely disrupted by the neo-liberal attacks on unions, wage fixing tribunals and other legislative initiatives that have eroded the capacity of workers to share in labour productivity growth.
The widening gap between wages growth and labour productivity growth has been a world trend (especially in Anglo countries) and I document the consequences of it in this blog post – The origins of the economic crisis (February 16, 2009).
But the attack on living standards has targetted more than the bottom end of the labour market, although the minimum wage workers have certainly been more deprived of the chance to share in national productivity growth than other workers.
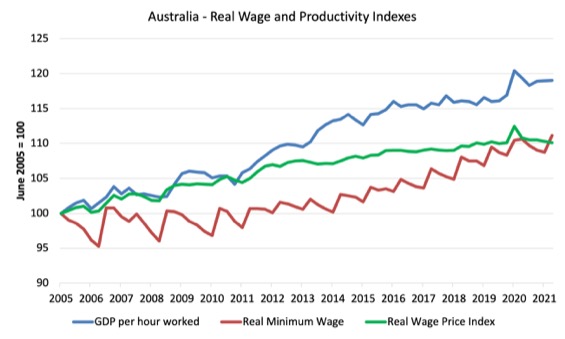
The following graph shows the evolution of the real Federal Minimum Wage (red line), GDP per hour worked (blue line), and the Real Wage Price Index (green line), the latter is a measure of general wage movements in the economy.
The graph is from the June-quarter 2005 up until September-quarter 2021 (indexed at 100 in June 2005 and extrapolated as above out to September 2021).
By June 2021, the respective index numbers were 119 (GDP per hour worked), 110 (Real WPI), and 108.7 (real FMW).
Overall, all workers have failed to enjoy a fair share of the national productivity growth, and that minimum wage workers in Australia have been largely excluded from sharing in any of the productivity growth although the low-paid workers have fared a little better in recent years.
Of-course, like all graphs the picture is sensitive to the sample used. If I had taken the starting point back to the 1980s you would see a very large gap between productivity growth and wages growth, which has been associated with the massive redistribution of real income to profits over the last three decades.
Wage Parity
I have already showed the parity with respect to the accepted poverty threshold (see above).
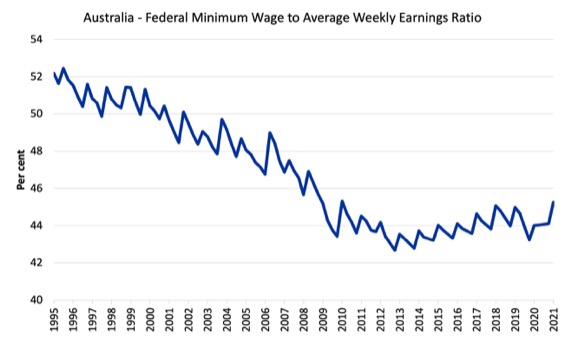
In terms of other parities with other wage earners, the following graph shows the ratio of the Federal minimum wage to the Full Time Adult Ordinary time earnings series provided by the ABS (the latest being for the December-quarter 2017). This series in now bi-annual (previously quarterly). I have interpolated on the basis of the most recent growth.
I simulated this series out to September-quarter 2021 (the quarter after which the latest FWC Annual Wage decision will start impacting) based on a constant growth in earnings (assessed over the last 12 months).
The logic of the neo-liberal period which encompasses the data sample shown was to at least achieve cuts at the bottom of the labour market, given that workers with more bargaining power would put up resistance against generalised cuts.
Successive minimum wage decisions forced workers at the bottom of the wage distribution to fall further behind in relative terms.
In the December-quarter 1993, minimum wage workers earned around 55 per cent of the Full Time Adult Ordinary time earnings. By June 2019, this ratio will have fallen to around 44.3 per cent.
There has been a serious erosion of parity over the last 23 years.
But in the last few years, as the general Wage Price Index grows at record low levels (and overall real wages flat-line) and the FWC awards moderate real wage increases to the minimum wage workers, the erosion in the parity ended.
Staggered adjustments in the real world
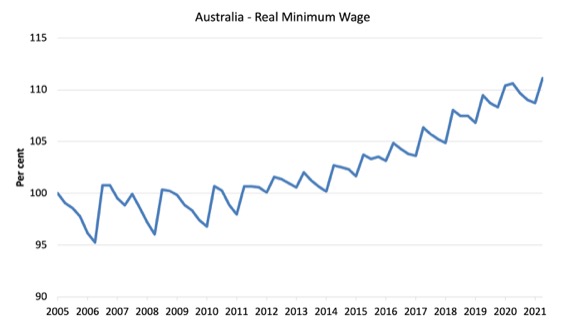
The following graph shows the evolution of the real Federal Minimum Wage (FMW) since the June-quarter 2005 extrapolated out to September-quarter 2021 (the quarter in which the recent decision will start impacting) based on a constant (current) inflation rate.
This is the FMW expressed in purchasing power terms.
You can see the saw-tooth pattern that the theoretical discussion I provided in this blog post – Australia’s minimum wage rises – but not sufficient to end working poverty (June 6, 2017) – describes.
Each period that curve heads downwards the real value of the FMW is being eroded. Each of the peaks represents a formal wage decision by the Fair Work Commission.
You can gauge the annual growth in the real wage by comparing successive peaks.
The decisions since 2012 have provided for some modest real income retention by these workers although it depends on how inflation is measured.
You can also see the troughs became shallower between 2012 and 2016 than in the past because the inflation rate moderated as a result of the GFC and the austerity since that has kept economic activity at moderate levels.
In more recent years the peak-trough amplitude has risen again.
So while each adjustment provides some immediate real wage gain for workers, those gains are ephemeral and the inflation process systematically cuts the purchasing power of the FMW significantly by the time the next decision is due – these are permanent losses.
The current peak for the September-quarter 2020 will be below the peak for the September-quarter 2019, which means that the erosion of purchasing power throughout the year has resulted in an overall reduction in real purchasing power.
Conclusion
While Australia’s lowest-paid workers received a small nominal annual wage rise from the FWC, the rise is to be phased in which will be detrimental to the real purchasing power of many low-paid workers.
Some workers will not receive the pay rise until February 2022.
In terms of the accepted 60 per cent of median full-time weekly earnings, the Federal Minimum Wage remains some $122 per week shy of reaching that benchmark, which is the commonly accepted poverty line for workers.
The gap reflects a history of decisions by Australia’s wage setting tribunals which have undermined the capacity of low-paid workers to enjoy real wage gains and keep pace with productivity growth.
That is enough for today!
(c) Copyright 2021 William Mitchell. All Rights Reserved.
Any chance you could give an option on the state of NZ?
Thanks.
neoliberals in consistently keeping to their philosophy banquets for the rich austerity for the poor!