Today (April 18, 2024), the Australian Bureau of Statistics released the latest - Labour Force,…
Australian labour market in dire straits
At present, the pandemic is causing massive fluctuations in the labour force aggregates to the point that it is very difficult to know more than that things a bad even when conventional indicators would normally be moving in a direction that would lead to the opposite conclusion. Today (September 16, 2021), the Australian Bureau of Statistics put out the latest – Labour Force, Australia – for August 2021. The background is that the entire East Coast is in or has been in lockdown over the last few months and for the two largest labour markets (NSW and Victoria) that lockdown has been very tight. The August 2021 data reveals that the longer NSW lockdown is now impacting heavily on employment growth. Employment, working hours, and participation are now falling sharply and we have the situation where unemployment and the unemployment rate is falling because the labour force is declining faster than employment. Of course that just means that the workers who would normally have been counted as officially unemployed as they lost jobs are now outside the labour force – and we consider them to be hidden unemployed. Their participation decline is because employment opportunities have collapsed. The more stable ratio – the Employment-to-Population ratio fell by 0.8 points in August, which is a massive shift for one month. The situation will get worse in September. So while the unemployment rate might be falling the situation is dire. The lack of any significant stimulus from the federal government is telling. There is now definite evidence that further and rather massive fiscal support is required. The lack of support is one reason low-paid workers in high infection rate areas are still mobile – looking for work etc and spreading the virus further.
The summary ABS Labour Force (seasonally adjusted) estimates for August 2021 are:
- Employment decreased by 146,300 (-1.1 per cent) – Full-time employment decreased by 68,000 and part-time employment increased by 78,200.
- Unemployment decreased by 21,900 to 617,100 persons.
- The official unemployment rate decreased 0.1 points to 4.5 per cent.
- The participation rate fell 0.8 points to 65.2 per cent.
- The employment-population ratio fell by 0.8 points to 62.2 per cent.
- Aggregate monthly hours worked decreased 66 million hours (-3.7 per cent).
- Underemployment increased by 1 points to 9.3 per cent (a rise of 119.3 thousand). Overall there are 1,268 thousand underemployed workers. The total labour underutilisation rate (unemployment plus underemployment) increased by 0.9 points to 13.8 per cent. There were a total of 1,885.2 thousand workers either unemployed or underemployed.
Employment decreased by 146,300 in August 2021
The impact of the extended lockdowns in NSW and Victoria are now manifesting with a massive contraction in employment in August.
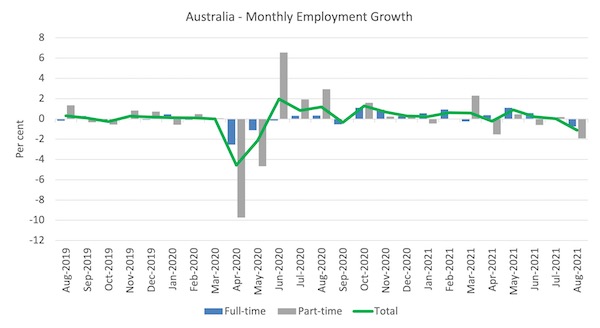
1. Employment growth was -1.1 per cent with 146,300 (net) jobs being scrapped.
2. Full-time employment decreased by 68,000 and part-time employment increased by 78,200.
3. Employment in Australia is now above the February 2020 level by 161.4 thousand (1.2 per cent). However, some sectors are still languishing.
The following graph shows the month by month growth in full-time (blue columns), part-time (grey columns) and total employment (green line) for the 24 months to August 2021 using seasonally adjusted data.
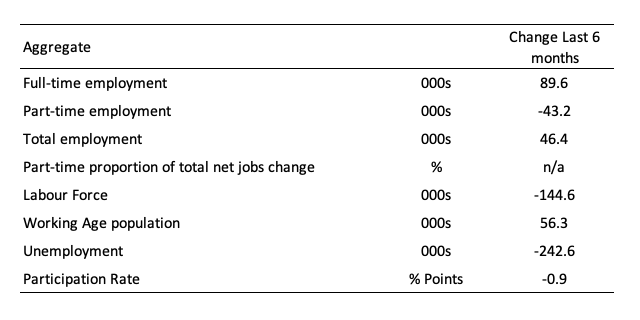
The following table provides an accounting summary of the labour market performance over the last six months to provide a longer perspective that cuts through the monthly variability and provides a better assessment of the trends.
However, with the situation in free fall at present, even a longer view of the data is likely to be misleading.
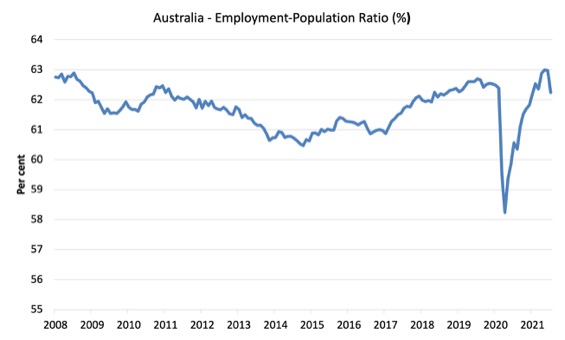
Given the variation in the labour force estimates, it is sometimes useful to examine the Employment-to-Population ratio (%) because the underlying population estimates (denominator) are less cyclical and subject to variation than the labour force estimates. This is an alternative measure of the robustness of activity to the unemployment rate, which is sensitive to those labour force swings.
The following graph shows the Employment-to-Population ratio, since February 2008 (the low-point unemployment rate of the last cycle).
It fell with the onset of the GFC, recovered under the boost provided by the fiscal stimulus packages but then went backwards again as the Federal government imposed fiscal austerity in a hare-brained attempt at achieving a fiscal surplus in 2012.
The ratio fell by 0.8 points in August 2021 to 62 per cent.
There are two forces working here – the denominator (population) is clearly providing favourable pressures due to the slower population growth as a result of the lack of immigration due to the on-going external border closures.
This is forcing employers to search harder for workers already in Australia rather than discriminate against the unemployed.
The numerator (employment) is clearly weaker as a result of the current lockdowns.
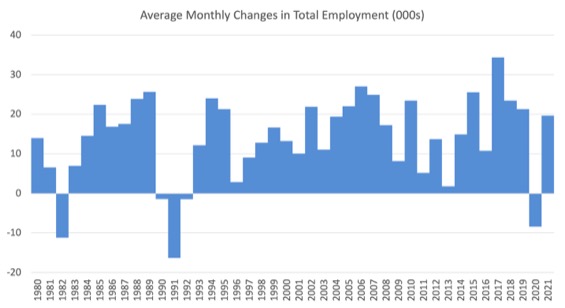
To put the current monthly performance into perspective, the following graph shows the average monthly employment change for the calendar years from 1980 to 2021 (to date).
1. The labour market weakened considerably over 2018 and that situation worsened in 2019.
2. The average employment change over 2020 was -7.8 thousand.
3. So far in 2021, the average monthly change is 19.6 thousand (and falling rapidly).
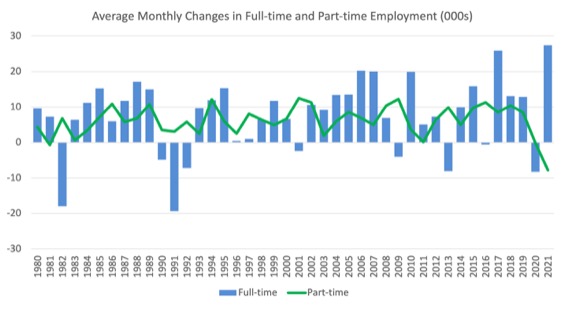
The following graph shows the average monthly changes in Full-time and Part-time employment (lower panel) in thousands since 1980.
The interesting result is that during recessions or slow-downs, it is full-time employment that takes the bulk of the adjustment. Even when full-time employment growth is negative, part-time employment usually continues to grow.
However, this crisis is different because much of the employment losses are the result of lockdown and enforced business closures in sectors where part-time employment dominates.
Hours worked decreased 66 million hours (-3.71 per cent) in August 2021
The dramatic decline in working hours this month is due to the ongoing lockdowns in NSW and Victoria. The situation will worsen as those restrictions deepen.
The following graph shows the monthly growth (in per cent) over the last 24 months.
The dark linear line is a simple regression trend of the monthly change – which depicts slightly positive trend.

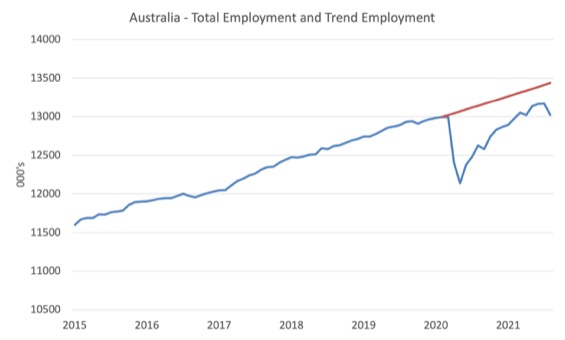
Actual and Trend Employment
The Australian labour market is still some way from catching up on the jobs that were lost during the pandemic. And the situation worsened in August 2021.
The following graph shows total employment (blue line) and what employment would have been if it had continued to grow according to the average growth rate between 2015 and February 2020.
The gap as at August 2021 rose by 171.2 thousand to 414.9 thousand jobs.
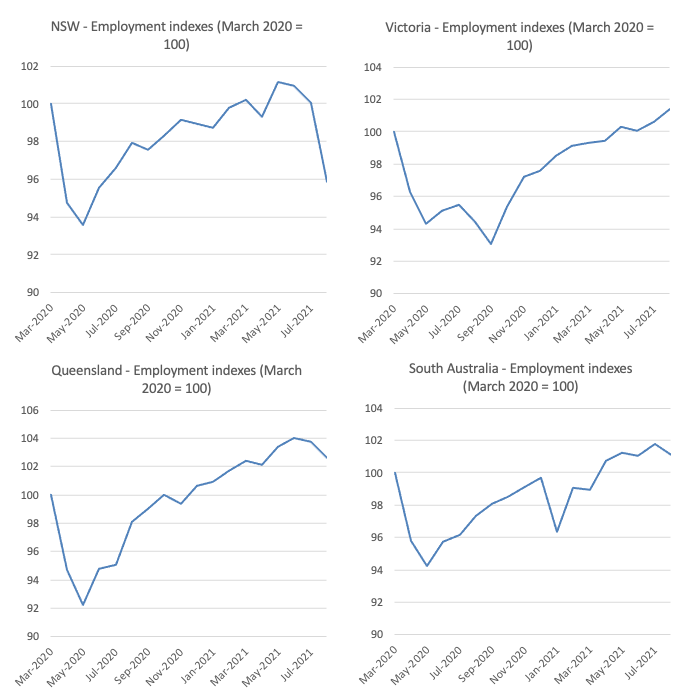
State by State Employment Trends
With renewed lockdowns imposed by Sydney and Melbourne (and to a lesser extent Canberra), the expectation was that employment would fall sharply given the extent of the restrictions.
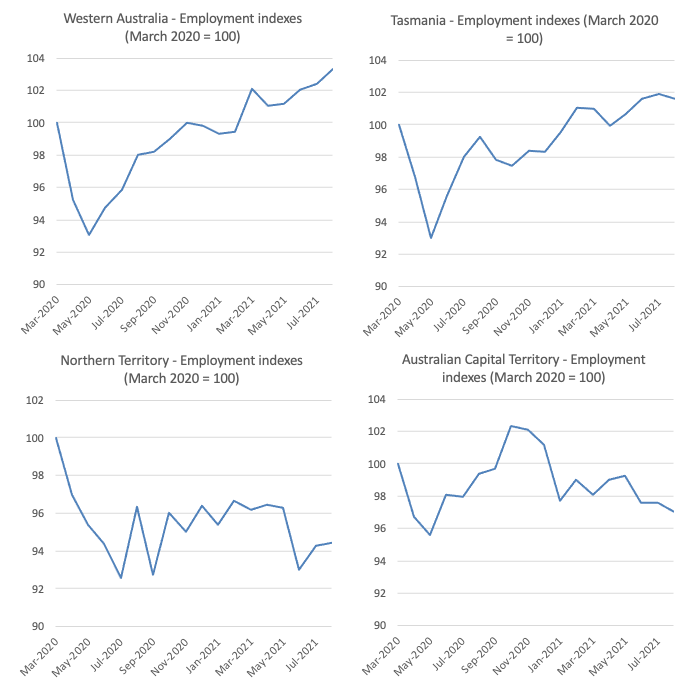
The following graphs show the employment evolution since March 2020 by state and territory.
The impact of the, now lengthy lockdown in NSW are showing and employment is now below the March 2020 (pre-pandemic level) again.
The current lockdown in Victoria (shorter than NSW) is not yet showing in the data but it will next month.
Interestingly, even with lockdown 5.0 in Victoria (we are now in lockdown 6.0), which was just before the current lockdown, employment only declined slightly, which suggests that short, sharp closures are better than the staggered closures that the NSW government has imposed as they progressively lost control of the outbreak (incompetence).
The states with the tightest border controls and the least COVID outbreaks (Tasmania and Western Australia) are clearly performing the best. A lesson is in that data.
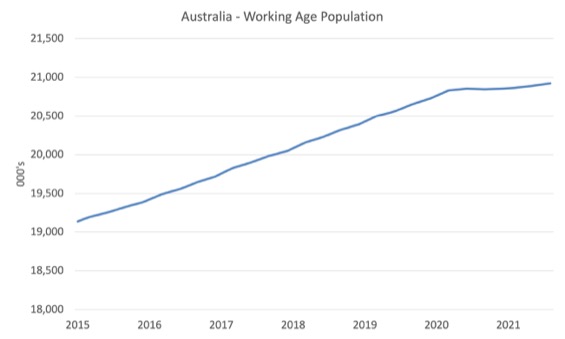
The Population Slowdown
The following graph shows Australia’s working age population (Over 15 year olds) from January 2015 to August 2021.
With the external border closed, immigration has shrunk to virtually zero and the impact is very clear.
This flattening out has forced employers to work harder to get workers and is one of the reasons unemployment is falling quite quickly, given the circumstances.
Unemployment decreased by 21,900 to 617,100 persons
The official unemployment rate fell 0.1 points to 4.5 per cent all due to the fact that the labour force shrunk faster than employment.
A terrible situation.
While a fall in unemployment is usually a good sign, in this case, it reflects the shrinkage in the labour force by 168.1 thousand as the participation rate collapsed by 0.8 points.
So not only is the slowdown in the working age population due to the restrictions on the external border taking pressure of unemployment, but, over the last two months, some of those who would normally be either employed or unemployed have given up looking for work due to the slowdown in opportunities for work.
They are considered the hidden unemployed.
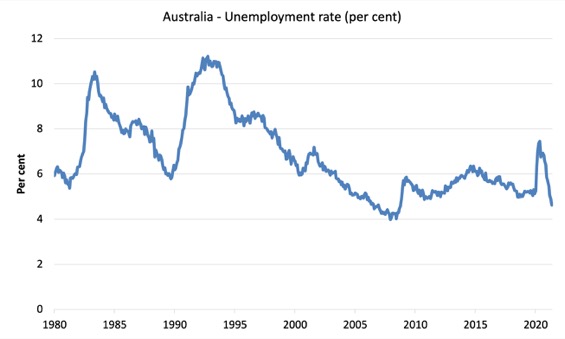
The following graph shows the national unemployment rate from February 1980 to August 2021. The longer time-series helps frame some perspective to what is happening at present.
Assessment:
1. Unemployment is now lower than the pre-pandemic February 2020 level – but we shouldn’t use that as the aspirational benchmark.
2. The usual cyclical asymmetry where unemployment rises quickly and falls very slowly is not being observed this cycle because of the population growth slowdown.
2. There is still considerable slack in the labour market that could be absorbed with further fiscal stimulus.
Broad labour underutilisation increased by 0.9 points to 13.8 per cent in August 2021
The results for August 2021 are (seasonally adjusted):
1. Underemployment increased by 119.3 thousand.
2. The underemployment rate rose by 1 points to 9.3 per cent.
2. Overall there are 1,268 thousand underemployed workers.
3. The total labour underutilisation rate (unemployment plus underemployment) increased by 0.9 points to 13.8 per cent.
4. There were a total of 1,885.2 thousand workers either unemployed or underemployed.
So the slack over the last few months is showing up as an increase in underemployment and an increase in hidden unemployment, rather than a rise in official unemployment
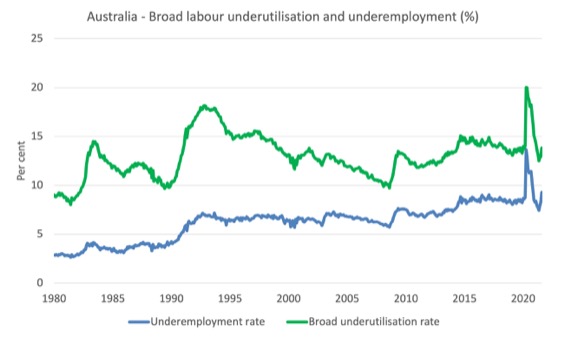
The following graph plots the seasonally-adjusted underemployment rate in Australia from February 1980 to the August 2021 (blue line) and the broad underutilisation rate over the same period (green line).
The difference between the two lines is the unemployment rate.
The three cyclical peaks correspond to the 1982, 1991 recessions and the more recent downturn.
The other difference between now and the two earlier cycles is that the recovery triggered by the fiscal stimulus in 2008-09 did not persist and as soon as the ‘fiscal surplus’ fetish kicked in in 2012, things went backwards very quickly.
The two earlier peaks were sharp but steadily declined. The last peak fell away on the back of the stimulus but turned again when the stimulus was withdrawn.
Aggregate participation rate decreased by 0.8 points to 65.2 per cent
As noted above, the decline in official unemployment was driven by the fall in participation – that is, unemployed workers seeking jobs.
The labour force contracted by 168.1 thousand persons in August – a massive shift.
This occurred because of the slowdown in employment opportunities.
So even though employment contracted by 146.3 thousand, the labour force fell further, and, hence, official unemployment fell by 21,900 (the difference).
In other words, the official unemployed have become hidden unemployed – so not an improvement at all.
What would have been the case if the participation rate had not fallen?
We can make two calculations:
1. Just the monthly implication.
2. The implication of the participation rate being below its most recent peak of 66.2 per cent in August 2019.
The labour force is a subset of the working-age population (those above 15 years old). The proportion of the working-age population that constitutes the labour force is called the labour force participation rate. Thus changes in the labour force can impact on the official unemployment rate, and, as a result, movements in the latter need to be interpreted carefully. A rising unemployment rate may not indicate a recessing economy.
The labour force can expand as a result of general population growth and/or increases in the labour force participation rates.
The following Table shows the breakdown in the changes to the main aggregates (Labour Force, Employment and Unemployment) and the impact of the rise in the participation rate.

The change in the labour force in August 2021 was the outcome of two separate factors:
- The underlying population growth added 7.3 thousand persons to the labour force. The population growth impact on the labour force aggregate is relatively steady from month to month but has slowed in recent months due to the border restrictions and the impact they have had on migration rates; and
- The fall in the participation rate meant that there were 175.4 thousand workers exiting the labour force (relative to what would have occurred had the participation rate remained unchanged).
- The net result was that the labour force fell by 168.1 thousand.
Assessment:
1. If the participation rate had not have fallen in August 2021, total unemployment, given the current employment level, would have been 792.5 thousand rather than the official count of 617.1 thousand as recorded by the ABS – a difference of 175.4 thousand workers (the ‘participation effect’).
2. Without the fall in the participation rate in August 2021, the official unemployment rate would have been 5.7 per cent (rounded) rather than its current value of 4.5 per cent).
3. In other words, the underlying state of the labour market did not improve at all in August despite the fall in official unemployment.
4. Relative to the August 2019 peak participation rate, the unemployment rate would be 5.9 per cent had the participation rate in August 2021 not fallen.
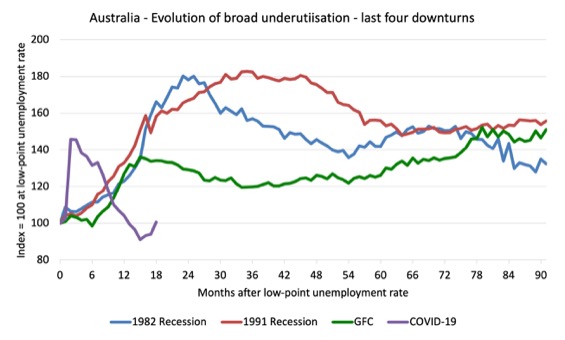
Unemployment and broad labour underutilisation indexes – last four downturns
The following graph captures the evolution of the unemployment rates for the 1982, 1991, GFC and COVID-19 downturns.
For each episode, the graph begins at 100 – which is the index value of the unemployment rate at the low-point of each cycle (June 1981; December 1989; February 2008, and February 2020, respectively).
We then plot each episode out for 90 months.
For 1991, the peak unemployment which was achieved some 38 months after the downturn began and the resulting recovery was painfully slow. While the 1982 recession was severe the economy and the labour market was recovering by the 26th month. The pace of recovery for the 1982 once it began was faster than the recovery in the current period.
During the GFC crisis, the unemployment rate peaked after 16 months (thanks to a substantial fiscal stimulus) but then started rising again once the stimulus was prematurely withdrawn and a new peak occurred at the 80th month.
The COVID-19 downturn was obviously worse than any of the previous recessions shown but because of its unique nature – the job losses being largely driven by lockdowns etc.
The graph provides a graphical depiction of the speed at which each recession unfolded (which tells you something about each episode) and the length of time that the labour market deteriorated (expressed in terms of the unemployment rate).
After 18 months, the unemployment had risen from 100 to:
1. 174.9 index points in 1982 and rising.
2. 163.4 index points in 1991 and rising.
3. 143.6 index points in the GFC and falling.
4. 88.1 index points currently and falling (but note the following graph shows underemployment rising).

Note that these are index numbers and only tell us about the speed of decay rather than levels of unemployment.
The next graph performs the same operation for the broad labour underutilisation rate (sum of official unemployment and underemployment).
Teenage labour market continues to deteriorate in August 2021
The following Table shows the distribution of net employment creation in the last month and the last 12 months by full-time/part-time status and age/gender category (15-19 year olds and the rest).
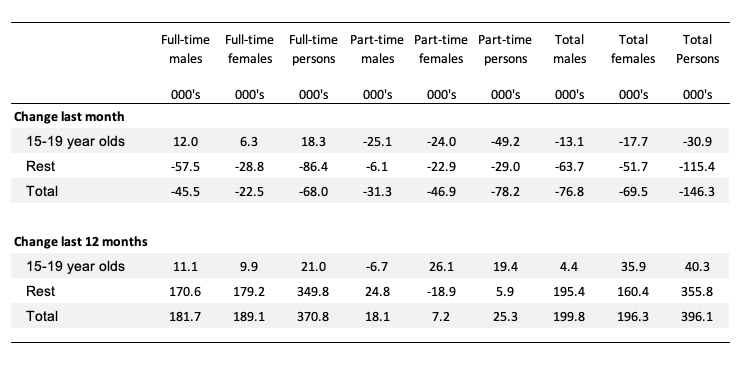
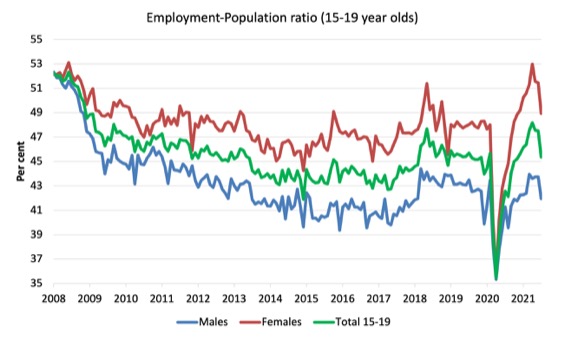
To put the teenage employment situation in a scale context (relative to their size in the population) the following graph shows the Employment-Population ratios for males, females and total 15-19 year olds since June 2008.
You can interpret this graph as depicting the loss of employment relative to the underlying population of each cohort. We would expect (at least) that this ratio should be constant if not rising somewhat (depending on school participation rates).
1. The male ratio has fallen by 10.4 percentage points since February 2008, and in August it fell by 1.5 points. It is now 1.8 points below its level in March 2020.
2. The female ratio has fallen by 3.2 percentage points since February 2008, and in August it fell by 2.5 points. It is now 0.9 points above its level in March 2020.
3. The overall teenage employment-population ratio has fallen by 6.9 percentage points since February 2008, is now 2.2 points above its level in March 2020. It fell by 0.3 points over the month.
Conclusion
My standard monthly warning: we always have to be careful interpreting month to month movements given the way the Labour Force Survey is constructed and implemented.
At present, the pandemic is causing massive fluctuations in the labour force aggregates to the point that it is very difficult to know more than that things a bad even when conventional indicators would normally be moving in a direction that would lead to the opposite conclusion.
The August 2021 data is now reflecting the lengthy lockdowns on the East Coast of Australia.
Employment, working hours, and participation are now falling sharply and we have the situation where unemployment and the unemployment rate is falling because the labour force is declining faster than employment.
So, workers who would normally have been counted as officially unemployed as they lost jobs are now outside the labour force as hidden unemployed.
The more stable ratio – the Employment-to-Population ratio fell by 0.8 points in August, which is a massive shift for one month. The situation will get worse in September.
My overall assessment is:
1. The on-going impacts of the pandemic are once again killing job prospects and the lack of employment opportunities is pushing people out of the official labour force in substantial numbers.
2. Without that participation response, unemployment would have been 1.1 points higher.
3. What is preventing a worse outcome is the fact that the lower population growth due to the external border closures, means that employers are now having to absorb the unemployed more quickly to maintain their operations.
3. There is now definite evidence that further fiscal support is required and the silence from the Federal government reveals their disdain for the plight of the workers.
That is enough for today!
(c) Copyright 2021 William Mitchell. All Rights Reserved.
Queensland has had very little in the way of lockdowns compared to New South Wales and Victoria. But we do seem to have taken something of a hit to employment, though not nearly in the same league as NSW.
What we have had is strict lockouts – that is, interstate border closures in addition to the closed international borders.
With it’s tropical climate, beaches, Great Barrier Reef etc, Queensland probably has a more substantial tourism industry than the other states. I wonder the this is the reason for the employment impact in a state that has remained largely Covid-free?
I agree that further fiscal support for workers and the unemployed is needed. Right now is very much the right time in our national history to start implementing a Job Guarantee. Of course, unfortunately, this will never happen under a neoliberal government. The novel zoonoses disease crisis (COVID-19 won’t be the last one) and the climate crisis, with all its attendant crises, are the very time to reconfigure our economy to meet these existential challenges by increasing health, environmental and adaptational sector employment. Private enterprise won’t do any of this, indeed they resist it. So the democratically elected state must step in. We need extensive statist and dirigist measures. We also need to re-nationalize all economically strategic and natural monopoly enterprises WITHOUT compensation to the very rich.
@ikonokast,
Agree with the sentiment eg re nationalisation, buybacks the political reality will probably preclude this. The neoliberal media would go IMO a frenzy and probably convince voters that this is “communism” etc. also don’t forget what happened to the mildly reformist Whitlam government in 1975 and Chile 1973.
For now I think the best we can hope for is the election of the Labor party, neoliberal lite for sure. I don’t know if they understand MMT and of course their public statements on debt and deficits suggests they do not or do not feel confidant they can re educate the public at this stage.
Whether employment and unemployment and the economy are growing or shrinking is of secondary importance. What is of primary importance is whether the economy is delivering to people what they need to thrive.
Of course that would include intangibles like self- respect and purpose as well as material needs. But during times like these, taking care of material needs is particularly important.
On the other site I asked why is it that zero people are suggesting that to win the climate fight nations should use rationing like the US & UK did in WWII?
Why are people settling for the indirect effects of gov. actions, instead of direct gov. action to get people to do what needs to be done. Whatever that is.
The nation needs people to burn less gas and oil, ration it.
The nation needs people to plant trees in burned over square miles of forest or brush. hire them to do that and pay them. Hire helpers, including people to stand there with a large sun shade. It isn’t necessary to be efficient, until we run out of unemployed people.
The nation needs people to eat less beef, ration beef.
With modern debit cards it would be simple to make the ration system work. Give *every* person over 12 years old a ration card to use.
Why not ration things, instead of raising their price? We could let the very rich buy a 2nd card and the super rich buy 2 more cards. These would be expensive, though.
IMHO, the world is in a “state of siege”. Back in the day, the gov. took control of all the food and rationed it, and provided shelter or all inside the walls. This is the model to follow in this crisis.
“There is now definite evidence that further fiscal support is required and the silence from the Federal government reveals their disdain for the plight of the workers.”
Certainly I agree with this, but in my opinion we need to consider, on a less granular level, the overarching problem that is likely to see us in fairly dire straits in every respect for the next 18 months at the very least.
Basically, with an “all-in on vaccines” policy, the Australian governments are implementing by stealth a sort of Great Barrington-Lite (you’ll remember that the Great Barrington Declaration was the assertion by various ghouls last year, before a vaccine was on the horizon, that we have to stay open at all costs, public health consequences be damned).
It’s a truism to point out that lockdowns have a real cost, as does Covid itself. It’s important to remember, though, that Melbourne’s 2020 lockdown was a success, insofar as it lead to the elimination of Covid in this country. The state government was to blame for it getting to that point in the first place, but they did what was necessary and, once the lockdown was implemented, they did it well. It has, however, been forgotten, that it is not the lockdown alone that caused case numbers to decline in Melbourne last year. It was only the introduction of the mask mandate (Australia – and the west in general – was abjectly late to masking). See this paper for more: https://journals.plos.org/plosone/article?id=10.1371/journal.pone.0253510
That mask policy was good enough for Covid in 2020 when the “natural” R0 was only about 2. It took several months but Melbourne (where I live) got back to normal, relatively speaking, and enjoyed a relatively blissful period of normalcy from October to June, due to our having eliminated Covid.
Fast forward to June this year (and setting aside Berejiklian’s grotesque misleadership specifically for a second) and the lockdowns and mask mandates we have now are bound to leave us treading water, instead of eliminating the virus or even just reducing the R0 in a helpful way. The latter is still possible. There is nothing mechanically about the delta variant that means in principle that masks that worked against last year no longer work this year. The difference is that the virus is more transmissible, in part because of its higher “natural” viral load (which means the R0 is closer to 8, I think, instead of 2).
We have failed to adapt our masking advice to the new variant of delta. Masks “work” but it’s not a dichotomy of “yes they work”/”no they don’t work” – it’s about reducing the probability of infection, and this is going to vary dramatically based primarily on the fit and material of the mask. Generic surgical masks may have been enough last year, but now it’s not enough.
Instead of looking at a Covid reduction strategy that is empircally known to work on first principles and looking at how we can improve it, we have completely neglected it in favour of relying on vaccines and the ridiculous Doherty Institute modelling (modelling so shabby that any mainstream macroeconomist would be proud to call it their own – accordingly, politicians cling to the mythical 70 and 80% numbers with dogmatic fervour) and have more or less advised “yep, keep wearing masks, but they’re not enough to stop delta spreading”. It’s tendentious nonsense.
The fact is, masking in Melbourne (and I presume NSW) is woefully inadequate for fighting delta. Loosely fitted, ‘leaky’ surgical masks are the norm, and many people wear them under their nostrils or, worse, lower them when they’re speaking. Cloth masks are probably better than poorly fit surgicals but they vary wildly in fit and quality, as they are not standardised. Good enough for last year’s variant, less helpful for delta. People wear masks outdoors in crowded areas (often where people are exercising and breathing heavily) when we know the risk of outdoor transmission is greater now. The best masks right now for the general public are those that meet the ‘KN95/N95/P2’ standard, and they are rarely seen. These masks will protect the individual wearing them, and those they share an indoor space with. I personally “double mask” – wear a looser cloth mask over a fitted surgical or KN95 mask (not all KN95s are rigid and inflexible, and for non-health workers, they can be re-used), there’s not a huge body of research on this yet but the technique appears to be promising in terms of conferring extra protection (and makes sense purely as a common-sense hypothesis). I don’t want to bombard the blog with links to mask evidence so I hope readers will take this information in good faith.
It’s one thing to get people to co-operate with a mask mandate in the first place, another to say “okay, but now you have to a wear a certain kind of mask, a certain kind of way”. But actually, the solution is pretty obvious: Have the Federal Gov’t supply KN95 or equivalent masks to every resident of the country, on an ongoing basis if necessary, along with an info card/fridge magnet explaining best masking practices and what we would stand to gain from following them. You don’t even need to be an MMTer to understand that this is obviously possible: the federal government is doing similar right now with vaccines. Seriously, it is embarrassing how out of date our mask advice is – even the US CDC’s advice is better, more up-to-date than ours! Try telling me that this won’t – at the very least – meaningfully reduce the R0 in Australia, which is what we should be doing particularly as NSW’s health system is overwhelmed, with Victoria’s presumably to follow.
We don’t know what the ‘endgame’ for this virus is. Many people breezily assume that in one or two years time it will evolve into something completely benign and will be just like the common cold. Pure hubris. We don’t know what’s going to happen – although I daresay a variant even more transmissible than Delta is almost a certainty at some point, meaning that control of transmission is only ever going to get harder. We can make educated guesses, but that is what they are. Consider how much consensus experts have got wrong about this virus since the beginning; do we really want to be planning for the future based on their Panglossian prognostications? How’s that worked out for the world so far?
I have to point out that I’m not anti-vax – I had my first shot on Tuesday – but the vaccines have been oversold as the “road out of the pandemic” when they’re nothing of the sort. Moreover, this has been known since last year. It was known after the new vaccines’ trials that they did not stop infection or transmission (they were never designed to). An Australian immunologist Robert Clancy wrote in Quadrant (I know, I know) early this year a predictive outline of the limitations of the vaccines, which has pretty much exactly come to pass. The “Pandemic of the unvaccinated” rhetoric is not only arrant nonsense, it’s pernicious social Darwinist dreck. The UK, 80% vaccinated, has been wavering between 100-200 daily deaths from Covid for the last month. That’s some definition of “living with the pandemic”.
There’s no doubt the vaccines were very important to deploy in the rest of the world where cases were raging out of control and things were very bleak indeed (that countries seem to have failed to plan much farther beyond this vaccination campaign is an issue for another day). But the situation in Australia was completely different. In this respect, criticising Morrison for the vaccine supply cock-up is a bit of a red herring. In fact, up until June I had been viewing it as a blessing in disguise – we would have plenty of time to view what the vaccines were doing in the rest of the world, how they coped with delta, how long they offered strong protection, and then plan accordingly. This would have been a perfectly scientific thing to do, nevermind straightforwardly prudent. But then delta came to Sydney and, well, like I said: Great Barrington-lite. 70%! 80%! Back To Normal!
(I see that Bill has already linked in the past to the Institut Economique Molinari’s paper on the superior health, economic, and civil liberty outcomes for those jurisdictions that pursue a zero covid policy – readers can search for the relevant terms to read more on this)
And notice how quickly the rhetoric changed. “it’s inevitable, we all have to get infected eventually”. “We can’t stop the virus, we’re going to have to live with it, just like the flu” (have you checked the flu stats in Aus and NZ lately?) “masks can’t beat delta”. These were not arguments, they were handwaves, assertions completely unsupported by any convincing evidence. These have come to be almost completely accepted by the public without question, and besides, the miracle vaccines are here to save the day and get us back to normal. Oh, and Long Covid, of course, is never mentioned by these charlatans.
Unfortunately, my parents who will both be double vaccinated are nevertheless going to be at ongoing high risk if the virus is left to run rampant, and consequently I will be leaving my life in melbourne early next year to be closer to them. The irony of this is, I could well be the one that ends up transmitting the virus to them, in spite of all my precautions. Oh, but obviously, the one and only risk to mental health in this country is lockdowns, not the capricious cruelty of a dangerous virus allowed to spread uncontrolled throughout the population (as an aside: this is a dangerous game of political cynicism to be playing. Maybe we could ask what the mental health consequences of abandoning the full employment white paper have been over the past 50 years, hm? Who foots the bill for that one?)
I’m at my wit’s end about it to be honest. What is happening here is so unnecessary, and so avoidable. It is absolutely gutless behaviour by Berejiklian, Morrison and, ultimately, Andrews as well. The Lucky Country’s luck is about to run out.
I’m sorry Bill, I need to get my 2 cents in about covid and the future.
1] Smallpox didn’t not mutate ti become less lethal in Europe over the centuries.
We know this because smallpox killed millions of natives in the New World in the 1500s and 1600s.
So, why were fewer and fewer Europeans dying of smallpox as time went on?
It is clearly obvious that it was because the surviving people had the kids that were more likely to survive, and over 1000 years, every European had some built in immunity to it. So, fewer and fewer died from it.
So, yes, covid could evolve quickly to be less lethal, but the chance this will happen in unknown, given our current state of science. Or humans could over centuries evolve to be somewhat immune to it.
2] I also double mask when I’m out in building with people. I single mask when I’m driving and sitting in the car waiting as the wife shops.
3] The vaccines do not give 100% protection from covid, and they seem to need booster shots. Living with covid may require a booster to *every* person on earth every 1 or 2 years. Worse, people can be sick, spreading it, and not know.
. . These 2 facts (if true) mean that to live with covid we will need both masks and vaccines.
4] We need better vaccines before we can live the same normal lives as we did before it came along. This may not be possible.
5] Therefore, we may need to find a way to live a new way of normal, if it becomes necessary. Time will tell us. However, as of now we don’t know the future.
I’m not making recommendations here, except to get vaccinated and double mask when around people. I’m just sharing my opinion of some facts.
OTOH, we need people working in factories making stuff to fight covid and to fight ACC.
I basically agree with Basil Pesto and Steve_American above. The general public are being sold a lot of over-simplistic nonsense about COVID-19, vaccines and opening up. This is the standard neoliberal script. Business incomes are sacrosanct. Worker, pensioner, minority, ill/disabled peoples’ lives and even the lives of people with immune / inflammatory and/or neurological systems rather different from the norm are all expendable lives according to neoliberalism.
Vaccines work well for sure. But they are not perfect and significant problems are emerging with immune escape, vaccine escape and vaccine leak.
Masks can work well but it’s not binary, it’s probabilistic. Just like vaccines they improve our chances most if applied correctly. For masks this means worn correctly, preferably doubled up or of high virion trapping quality. Also, work best if just about everybody wears them.
Finally, self-imposed isolation works. The less you go out, the less danger you will face. Of course, isolation has to be balanced with requirements to earn income, interact and even care for other people and also to care for your own mental health.
The idea whatever your situation is to use your advantages, whatever they are, to buffer against your vulnerabilities. The (relatively) ideal situation, if you can engineer it is;
(a) Get double vaxxed and boostered as appropriate.
(b) Wear double masks in public.
(c) Socially distance as much as possible.
(d) Get home deliveries instead of physical shopping.
(e) Live in detached housing: the bigger the block of land the better.
(f) Reduce social circles to similarly careful people.
(g) Plan trips and holidays (when these become possible) for the period after vaccination when your protection is highest and before it would wane significantly. Practice distancing even on holidays.
(h) Never, never set foot on a cruise ship for the first time or ever again. SERIOUSLY!
Do as many of these as you can. I would avoid all indoor venues too but then I may be more paranoid than most… or I may know more than most.
‘Progressives’ have become blind to fascism.
My God Bill you’ve got some right nutters commenting here.
@ Bill Marsh perhaps you can illuminate us regarding why some of the commenters are nutters?
Clearly, the *fact* that as vaccination numbers go up as we sloooowly open up and infections, hospitalizations and deaths go down, as well as the increase in discrepancy between vaccinated and vaccinated groups, means we are, and always were, nuts to think we could save lives!
(And by “we”, I mean Portugal; let me by proud of my country, for once, for leading vaccination rates, even though it’s just as random of an event as anything else.)
Seriously, though, they clearly work pretty well at helping to fight it when you inevitably catch it, they clearly work at reducing hospital load and mortality, and it’s likely post-vaccination infection will give you the same super-protection post-infection vaccination does as your body keeps adapting. Anything about general boosters, potential variants, herd immunity,… is just irrelevant noise at this point. (outside of those whose job is to study it). And probably profit margin increases.
Although it probably is still dreadful if you have a weak immune system. Hang in there. And, well, most of the world we still keep vaccines from.