It's been a week of grand fiscal statements. Tuesday, it was for Australia as I…
UK Office of Budget Responsibility demonstrating the well-trodden GIGO format
I have finally been able to read the latest fiscal statement – Autumn Budget and Spending Review 2021 – from the H.M. Treasury, which was released on October 29, 2021. That 202 page document is not something anyone should spend time reading but in my job one has to in order to stay abreast of what is happening around the world. It also took me down the Office of Budget Responsibility snake hole to read their latest – Fiscal risks report – July 2021 – which obviously conditions the way the fiscal statement is framed. That is a really bad document. And as it happens, footnotes in that document take us further into the pit of New Keynesian fiction, where we find modelling that OBR relies on, that has the temerity to model fiscal shocks where labour markets always clear and households choose the unemployment rate, which is constructed as ‘leisure’, as they maximise their satisfaction. I suppose that is okay in a world where we assume households live to infinity. That is, nothing remotely like the world we live in. I don’t plan to analyse in detail the fiscal statement. Rather, here are some reflections on some of the material that the Treasury think is useful in framing the statement. Which helps to explain why these sorts of statements become lame quickly.
While – Autumn Budget and Spending Review 2021 speech as delivered by Chancellor Rishi Sunak – talked about the real world, the modelling by the Treasury uses is about anything but.
In Chapter 4 of the OBR document, we study “The Cost of public debt” – and from the outset the reader is confronted with this statement:
The stock of government debt is both the result of past fiscal risks crystallising and a source of future fiscal risks
They consider these ‘risks’ to be related to “the future path of interest rates” and how that path “is reflected in the public sector’s financing costs”.
We could make the obvious point – there is no risk to the government from anything related to its outstanding debt.
But that wouldn’t be much fun, would it?
The OBR document also claims that as a result of QE, the risk is amplified because the larger outstanding debt is biased towards shorter-term liabilities, which according to them, have to be turned over more often and be more exposed to yield changes.
The other fiction that they entertain is that the British government might run out of investors and the debt will become unsustainable:
But the willingness of investors to hold a government’s debt will depend on their confidence in its ability and willingness to undertake the fiscal actions necessary to meet its debt obligations as they fall due … The willingness of investors to hold a given country’s public debt will also depend on the attractiveness of holding other assets, such as the debts of other countries’ governments, corporate bonds, equities or real estate. So there will be a limit on the capacity of a government to borrow and high debt may constrain that government’s willingness and ability to undertake desirable fiscal actions for fear of reaching this limit.
Note ‘may constrain’. Fear not fact.
The point is this.
If the bond investors decide to go elsewhere, the British government has three options:
(a) roll over and allow them to be screwed by the markets – pay them higher yields etc. This would not be particularly problematic except it would result in an increased transfer of public funds to the top-end-of-town. Hardly desirable.
(b) ignore the auction tenders and instruct the Bank of England to take up the auction tender at low yields. More desirable.
(c) finally eliminate the gilt market – and just modernise internal accounting between the central bank and treasury to ensure spending is facilitated through appropriate bank transfers (as it is now) without all the hoopla run by the Debt Management Office. Most desirable.
But what evidence is there that the bond investors are about to become ‘unwilling’?
Just the other day (October 21, 2021) I read a report – The U.K. sold the world’s longest sovereign green bond yet as it tapped pension fund cash to start building a yield curve – which reported that:
The country racked up more than 74 billion pounds ($102 billion) in orders via banks for the 6 billion-pound sale of its second green gilt, due to mature in July 2053. That was the highest ever bid-to-cover ratio, at more than 12 times, for any sovereign green issuance …
Someone out there with cash doesn’t appear to be reading the OBR analysis.
The latest data from the UK Debt Management Office – Auction Results (published November 12, 2021) – shows that bid-to-cover ratios are strong.
Across all auctions between May 20, 1998 and November 10, 2021, the average has been 2.1.
I explain bid/cover ratios in this blog post – D for debt bomb; D for drivel (July 13, 2009).
See also this blog post – Bid-to-cover ratios and MMT (March 27, 2019).
The bid-to-cover ratio is just the the £ volume of the bids received to the total £ volumes desired. So if the government wanted to place £20 million of debt and there were bids of £40 million in the markets then the bid-to-cover ratio would be 2.
Of course, the ratio doesn’t matter at all where the government issues its own currency and is thus not revenue-constrained.
Why doesn’t it matter?
Because those who fuss about it assume that the government needs the bond sale revenue in order to function (to spend).
Even while maintaining that myth, recent events show that the Bank of England has been purchasing massive amounts of debt – effectively the government is financing its own spending using its own currency while hiding behind (not very well) an elaborate set of accounting gymnastics.
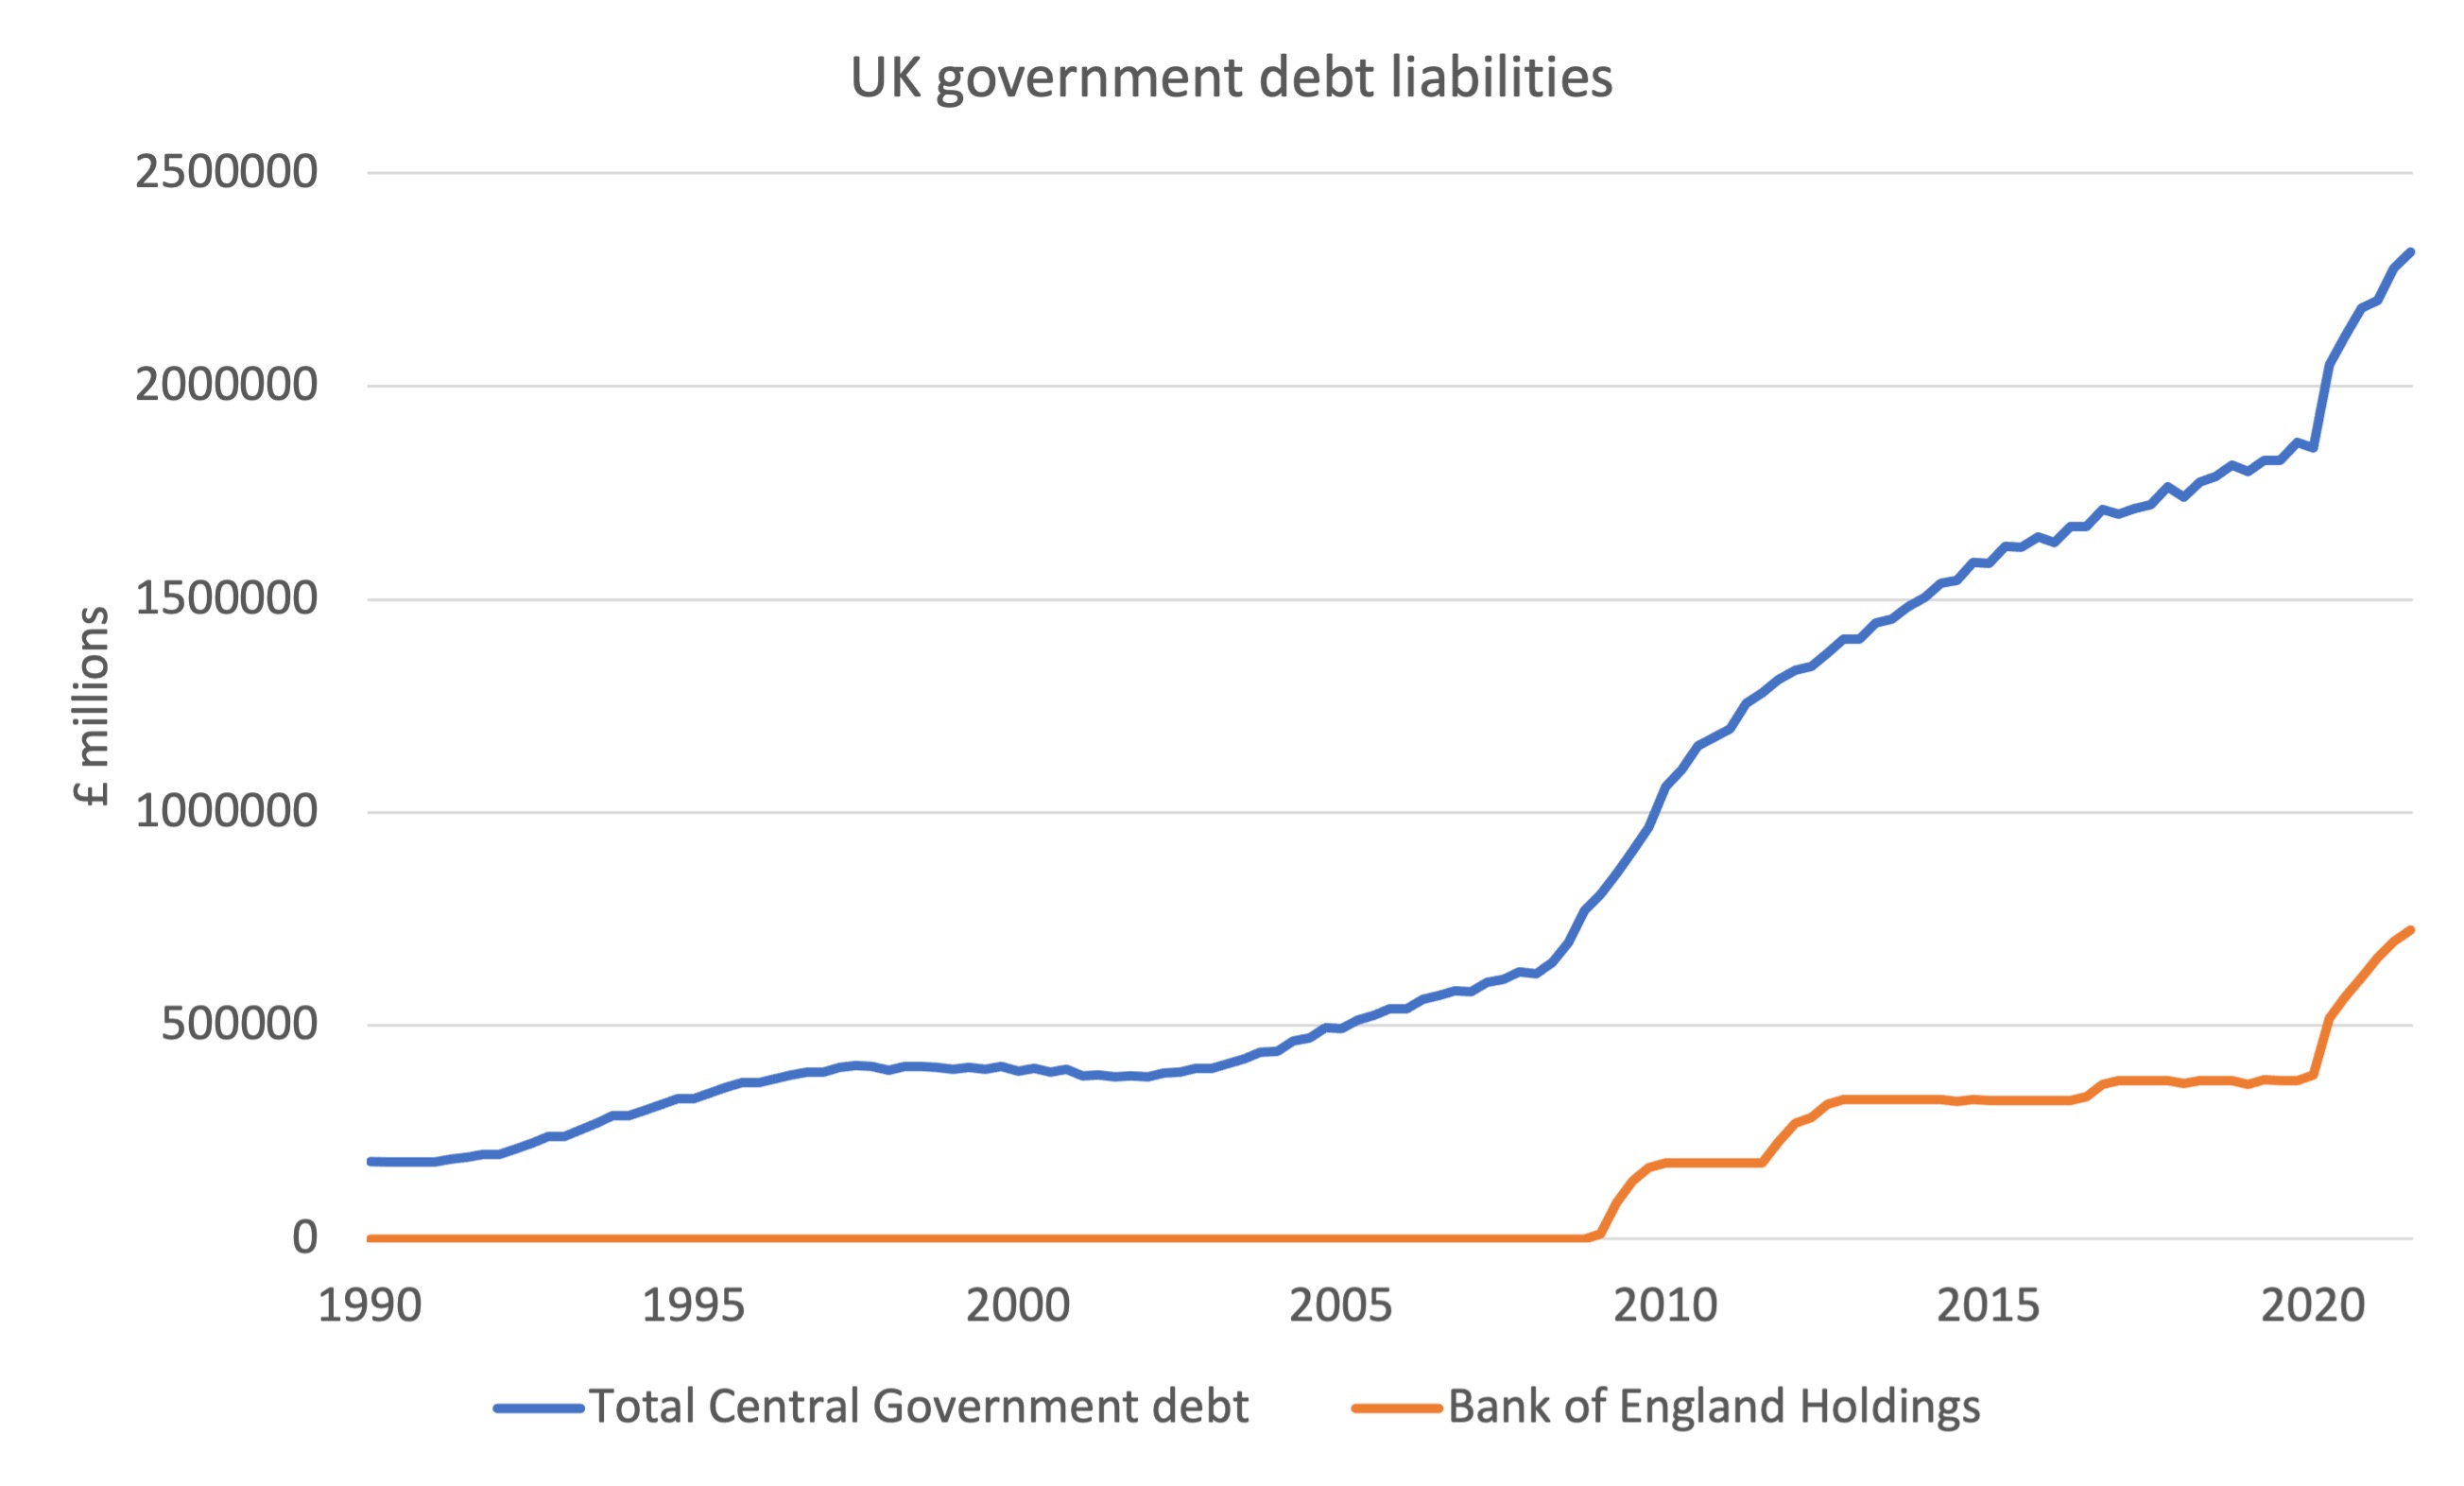
The following graph shows the evolution of British Central government debt since 1990 to the September-quarter 2021 (£ millions) and the Bank of England’s holdings of the same.
In March 2020, the Bank of England held 20.7 per cent of the outstanding government liabilities.
By the September-quarter 2021, that proportion had risen to 31.3 per cent as a consequence of its asset-purchasing program.
Over that period, total central government debt rose by £458,442 million, while the Bank’s holdings rose by £339,821.
That is, the Bank has bought 74 per cent of the debt issued by the central government over the course of the pandemic to date.
So with that capacity and with that practice, it is difficulty to understand the term ‘willingness’ of bond investors as being anything that matters or has bearing on the reality.
The OBR actually rehearse the line that:
Well before that upper limit on borrowing is reached, however, investors are likely to become more concerned about the risk that the Government will fail to meet its obligations, through either outright default, artificial suppression of nominal interest rates via regulatory channels (‘financial repression’), or reducing the real value of its debt obligations through higher inflation (where the country has its own currency in which its debt is denominated).
They admit the “UK Government has never formally defaulted on its marketable debt”, which means that no-one should ever say otherwise.
So then the other options are:
1. The Bank of England engages in “artificial suppression” – that is, buys up the debt as it is doing now, and, as central banks around the world are doing.
The point here is that according to this logic – reality is what the profit-seeking, gamblers dictate and artificial is what the government might do on our behalf.
A very inverted form of standard one would suggest.
2. The Government deliberately invokes inflation to undermine the currency – not likely.
So we are left with just fears really.
And that is what we get.
Stories about governments running out of money and needing “to cut spending and/or raise taxes sharply if they are to meet their debt obligations.”
Seriously.
And then some spurious conclusions from the literature:
Short of these cataclysmic events, higher government debt also appears to be associated with slower GDP growth over the long run. Most of the empirical evidence finds such an inverse relationship between government debt and GDP growth, although the quantitative magnitudes vary.
The literature is awash with causality issues in this context.
It is like saying the fiscal deficits cause unemployment because when they rise so does unemployment.
Of course, when growth falters, deficits rise due to the automatic stabilisers (tax revenue falls and welfare spending rises), and, because governments choose to match that deficit shift with new debt issues, so will the stock of debt rise.
That doesn’t not allow us to conclude that rising debt causes growth to slow.
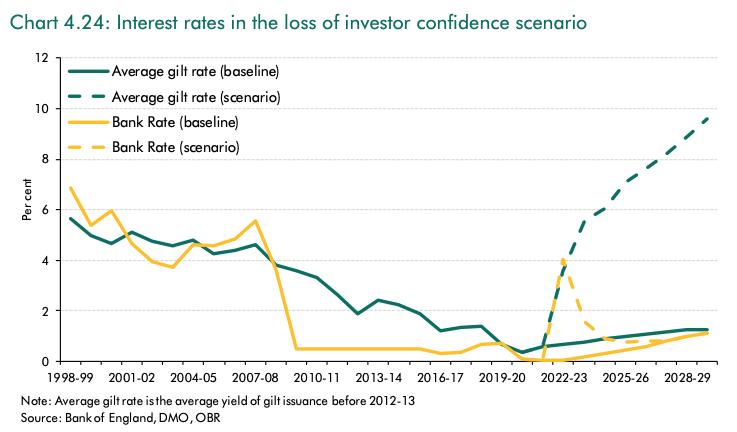
Anyway, the analysis finally took me to – “Chart 4.24: Interest rates in the loss of investor confidence scenario” (page 200).
It was lucky that just before I read all this stuff I had had a haircut – quite short – so there was not much left to pull out! Although for concerned readers, I am so inured these days that all hair – short or otherwise is pretty safe from reprisals such as this.
This is under a heading “Simulating a loss of investor confidence in the UK” which begins on Page 198.
In the preamble to the graph, they admit that while public debt is “markedly higher than before the financial crisis, has not limited the UK’s fiscal space to respond to the pandemic”.
Okay, so all the previous few hundred pages of analysis was a work experience program for some graduate or something to see how scary they could paint the future!
But, getting back on theme they write:
Nevertheless, in the spirit of considering even quite remote tail risks, our final scenario looks at what might happen if, for some reason, there were a loss of investor confidence in the UK Government’s creditworthiness and its macroeconomic policy framework.
Of course.
Always focus on the “quite remote” (read: never to happen) “tail risks”.
So they run some scenarios – aka in this context as GIGO (Garbage In, Garbage Out).
And so:
1. Bond investors get the heebies.
2. They force yields up.
3. A vicious cycle of borrowing and borrowing costs follow.
4. Government has to return to harsh austerity to pay the debts back.
5. Not very good.
Some shocks used to define the scenario include massive collapses of GDP growth, very high inflation, huge rises in Bank of England interest rates etc.
Rule: if you want a shocking outcome then make sure the shock is big enough to get the numbers of the experiment large.
Small numbers don’t scare anyone.
And so we come to Chart 4.24.
It is one of the better versions of this sort of rubbish I have seen – better meaning more creatively stupid.
The baseline is what happens without the shock and you observe low yields on government debt and small increases in the projected Bank of England policy rate out to 2028-29.
Then the scenarios!!
Government gilt yields skyrocket to nearly 10 per cent from close to zero by 2028-29.
Meanwhile, the Bank of England officials are not answering the telephone any more – especially calls from H.M. Treasury about their QE program.
Where do these characters get their model parameters from to conduct their scenarios?
Footnote 73 provides the answer – The Liquidity Channel of Fiscal Policy – which came out of one of those ‘think tanks’ in June 2020.
If you thought economics was bad, then you haven’t read this paper. It is worse.
It is state-of-the-art New Keynesian analysis – the sort that counts the number of angels dancing on a pinhead.
It attempts to study the impact of fiscal deficits on interest rates – and we get the full palaver.
Households transit between being workers and entrepreneurs (bosses) stochastically – that is, randomly.
So tomorrow a labourer can become the boss of a multinational firm seamlessly.
The households that today are workers maximise satisfaction through a combination of income and leisure (the former requiring the ‘bad’, work).
When the ‘disutility of work’ relative to the wage received becomes too high, then workers choose leisure over income.
The paper doesn’t mention ‘unemployment’ or ‘unemployed’ once – that would be redundant because what workers experience when they do not work is optimal leisure – a preference that maximises their satisfaction.
Most significantly, the paper assumes that:
The labor market clears at the competitive wage given …
So there is no unemployment.
Labour supply converges with labour demand and both workers and firms get what they respectively need in terms of work and output that maximises their respective utility and profits.
The real world disappears into vapour!
Which raises the question – if there is full employment, why would the government be increasing its fiscal deficit anyway?
No answer is provided in the paper.
Significantly, this is the paper that the OBR used to come up with Chart 4.24.
Which explains everything really.
Conclusion
It is going to take a long time before we get beyond this sort of reasoning.
There is a huge number of graduates out there who have been indoctrinated with this stuff and know no better.
A generation of mis-educated zombies really.
It’s a great life I have reading this stuff so that you don’t have to!
No sympathy needed – the sun is shining out my window and the jazz is great today.
That is enough for today!
(c) Copyright 2021 William Mitchell. All Rights Reserved.
Bill, very nice.
It points out a few of the false and stupid things that MS Econ. assumes are true.
I would love it if you would someday, off the top of your head make a long list of all such assumptions you can remember that are made by either Neo-liberalism or Neo-Keynesianism.
This seems like something that would fill a Wed. post.
I know a few —
1] The economy consists of 1 person. Silly because this person owns the corps and buys that all they make. So, of course, the market finds the perfect price and every person in the market is happy with all transactions. [This seems to me to be a perfect example of sneaking in a false assumption that what you are trying to prove is true, and then using that sneaky assumption to prove that it is true.]
2] Banks lend their depositors’ money. Gov. bond sales suck up those depositors’ dollars, leaving less for investment. So, interest rates increase.
3] The unemployed choose to be so.
4] The total of job openings plus jobs held is greater than the number of people in the age groups who are the ‘work force’ at all times. Every person who wants to work more can find a job to do so.
5] IIRC, and poorly worded; the market can be simplified by factoring out ‘money’, and so the market is a ‘barter economy’, with no money.
6] The national debt must be paid-off someday. So, it is possible in some way to be paid-off someday.
. . . It seems to me that for the US to suck, eg., $4T out of the economy by having a surplus for 4 years, that pays down the national debt by $4T; will cause a recession, and that if a $1T/yr surplus is continued for the next few years, it will become the worst Depression the world has ever seen. However, the surplus will not be continued because the voters will not allow it.
7] The US, UK, etc. Gov. is like a household. It must get money before it can spend money. It should only get money from tax and fee, etc. revenues or by selling bonds. The Gov. can also get money by printing it, but it should never do this, because hyperinflation *will* result every time this is done.
. . . That is, creating more money will *always* dilute the value of money and cause inflation, which will reduce the value of the money being held by all.
8] Gov. bond buyers set the interest rate at which the bonds are sold. They can demand and will get higher rates if they as a group want/need them.
It seems like there must be more. And, I’m sure I didn’t word them in the way that economists do.
Can anyone confirm this?
On another site an ex-banker asserted that banks may not lend their depositors’ money, but they can invest it in some other way. And, therefore, the ROI by the banks on those investments drops if the Gov. deficit spends while selling an equal amount of bonds.
I think that Bill has implied that the 1st is not so. And so, the 2nd is moot.
“just modernise internal accounting between the central bank and treasury to ensure spending is facilitated through appropriate bank transfers”
As recommended by the Select Committee on the Public Monies … in 1857
Select Committee on Public Monies. ‘Report with Proceedings: 279-Sess. 2’. Reports from Committees: 30 April – 28 August, vol. 9, British Parliamentary Papers, 1857, pp. 495-502, https://www.google.co.uk/books/edition/Reports_from_Committees/ValbAAAAQAAJ
Bankers can’t lend or invest depositor’s money at all. Whoever says that isn’t actually a banker, or is such low level that they can be completely ignored.
When government spends, and people save you get an expansion of a bank’s balance sheet on both sides: government bonds or reserves on the asset side and more deposits on the liability side. The bank earns if the margin on the bonds/reserves is more than that paid on the deposits.
In a bank’s Treasury department the job is to reduce the cost of liabilities and get the most out of the assets. The reason bank’s deposits go up in price is because some other institution tries to pinch the depositors the bank has created with its loans, pop a markup on the top and become the depositor themselves. That’s the ‘retail deposit’ vs. ‘wholesale deposit’ game.
A bank treasurer has to maintain sufficient income on assets, so they can pay sufficient to depositors to avoid them getting pinched by middlemen looking to take a cut.
The reason expanded balance sheet ‘reduce ROI’ is because the small margin bank’s get for hold extra deposited funds is less than the larger margin on riskier assets. So it looks like the return on capital is dropping because that is a ratio, whereas in actual fact the bank is earning more in cash terms because the balance sheet is bigger than it otherwise would be.
“So they run some scenarios”
It’s interesting how they always miss the important one: remove KPI 1.1 at the Debt Management Office.
The horrific consequences of removing that KPI would be the following:
‘DMO Annual Review 2019-2020’. United Kingdom Debt Management Office, 16 Oct. 2020, pp35
If I may go off-topic from today’s blog and go back to add comment related to last Tuesday’s blog on labour conditions and the UPS/FedEx comparison, in the same vein, there was an informative article in the (UK) Observer/Guardian this weekend on the exploitative conditions faced by sub-title translators https://www.theguardian.com/tv-and-radio/2021/nov/14/where-have-all-the-translators-gone Answer seems to be to work elsewhere where a living wage is paid. This quote seemed to sum it up: ‘Los Angeles-based Japanese-to-English audiovisual translator Katrina Leonoudakis wrote: “Like every other industry that requires skilled labour, the problem isn’t that there’s a ‘shortage’. The problem is that companies don’t want to pay for the highly experienced translators that are available. ‘Shortage’ is always capitalist speak for ‘we don’t want to pay’.” And “Knowing that these multibillion-dollar companies refuse to pay a few more dollars to an experienced professional, and instead opt for the lowest bidder with mediocre quality, only speaks to their greed and disrespect not only for the craft of translation, but the art created by the film-makers they employ.”
Thanks Neil for your explanation above. I’m sure you’ve gone through this at least once before.
As for the OBR propaganda, these people should have learnt some critical analysis skills on their way through university, but prefer to live in some middle earth fiction economy instead of the real world.
“It’s a great life I have reading this stuff so that you don’t have to!” Yes, Bill, and thank you for wading through the BS and then explaining to us why it’s precisely that. Yet too many MMTers, I fear, are still operating in primarily defensive mode, trying to fend off the BS thrown at them instead of stating clearly and compellingly their own case. As a (retired) lawyer, I learned that the first rule of advocacy is to tell your own story as powerfully as possible, and only then do you, from that solid vantage point, begin to pick apart the case–or the BS–of the other side.
Bill,
OBR estimates are reliably wrong and have been consistently so for a number of years!
Regards
Bill, you are so right. Here at the Government of Canada, Department of Finance bean-counters insist that our evaluators include a Marginal Cost of Public Funds statement in their evaluations, following Bev Dahlby’s work. Someone should explain to Dahlby and co that no loss is incurred by society, because the Crown does not have to “raise” “additional revenues” to “finance” government spending. The evaluators know that it is all nonsense, but quietly mention, when the Finance dolts are not in the room, that they have no choice, and then strive to demonstrate that social investments ‘are not really costly’. It is infuriating.
A brilliantly acerbic and witty demolition job – a pleasure to read, and very useful ammunition for us non-specialists.
Another recent report which appeared in July this year was from the UK’s House of Lords Economic Committee, entitled “Quantitative Easing: a dangerous addiction?”
https://committees.parliament.uk/publications/6725/documents/71894/default/
Bill has commented already on the evidence stage of this committee (The cat is progressively getting out of the bag – Parts 1 and 2) but I do hope he can find the time now to comment on the Committee’s final report and conclusions, which I am sure would be equally as educational and entertaining.
Love your work, Bill. And your unflappable, implacable commitment to pushing back on the BS, and standing up the truth. I agree it is concerning how pervasive and perpetuating the BS macro machine is, with a stranglehold on public agencies and policy that is straight from the machine. But, persistence will win the day. Eventually!