Today (April 18, 2024), the Australian Bureau of Statistics released the latest - Labour Force,…
Australian labour market rebounds from Omicron (perhaps) – but it is not as good as the media is claiming
The Australian Bureau of Statistics released the latest labour force data today (March 17, 2022) – Labour Force, Australia – for February 2022. Last month the labour market took a dive as workers became increasingly sick from Omicron and the relaxation of the lockdowns and restrictions. This month a rebound. Next month? Floods and a new variant – stay tuned. Employment growth was very strong this month but it won’t last. Unemployment is down to the pre-GFC levels which is good as employers continue to face a restricted labour supply. When they get around to offering higher wages given their booming profits is another question. Participation is at peak levels which is good and underemployment is falling. All these are signs of an improving situation for workers but only within this weird bubble we are in – not much external migration yet and a Covid roller coaster of sickness, new variants, not to mention the floods. The flat population growth as external borders remain largely closed (or there is a slow take-up of international travel opportunities from foreign tourists) has helped keep the unemployment rate low. But it is a temporary reprieve I think. My ‘What-if’ unemployment rate of 6.4 per cent is closer to the mark of where we are at present once things normalise (whatever that means).
The summary ABS Labour Force (seasonally adjusted) estimates for February 2022 are:
- Employment increased by 77,400 (0.6 per cent) – Full-time employment increased by 121,900 and part-time employment decreased by 44,500.
- Unemployment fell by 18,500 to 563,300 persons.
- The official unemployment rate fell to 4 per cent from 4.2 per cent.
- The participation rate increased by 0.2 points to 66.4 per cent.
- The employment-population ratio increased by 0.4 points to 63.8 per cent.
- Aggregate monthly hours worked rose by 149 million hours (8.9 per cent).
- Underemployment decreased by 0.1 points to 6.6 per cent (a fall of 12.4 thousand). Overall there are 915.2 thousand underemployed workers. The total labour underutilisation rate (unemployment plus underemployment) fell by 0.3 points to 10.6 per cent. There were a total of 1478.5 thousand workers either unemployed or underemployed.
In its – Media Release – the ABS note that:
The seasonally adjusted unemployment rate fell to 4.0 per cent in February 2022, the lowest unemployment rate since August 2008 …
The 3.8 per cent unemployment rate for women was the lowest since May 1974. Meanwhile, the unemployment rate for men fell to 4.2 per cent, its second lowest level since November 2008 and just above the rate from December 2021 of 4.1 per cent …
Seasonally adjusted hours worked rebounded in February by 8.9 per cent, following the large fall of 8.6 per cent in January, when an unseasonally high number of people were sick or on leave.
… While hours worked rebounded in February, they were still around 0.5 per cent below December, and also still slightly below (0.2 per cent) the pre-Delta period high of May 2021, reflecting a second month of impacts associated with the Omicron variant …
So as the government restrictions were phased out, the economic recovery accelrated.
But now with major flooding down the East coast and a new Covid wave emerging, who knows when this roller coaster will end.
Employment increased by 77,400 in February 2022
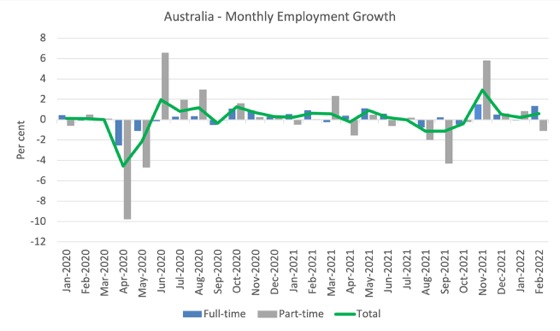
1. Employment growth accelerated (reversing the slump in January) this month to 0.6 per cent.
2. Full-time employment increased by 121,900 and part-time employment decreased by 44,500.
3. Employment in Australia is 376.7 thousand (net) jobs (2.9 per cent) above the pre-pandemic level in February 2020.
The following graph shows the month by month growth in full-time (blue columns), part-time (grey columns) and total employment (green line) for the 24 months to February 2022 using seasonally adjusted data.
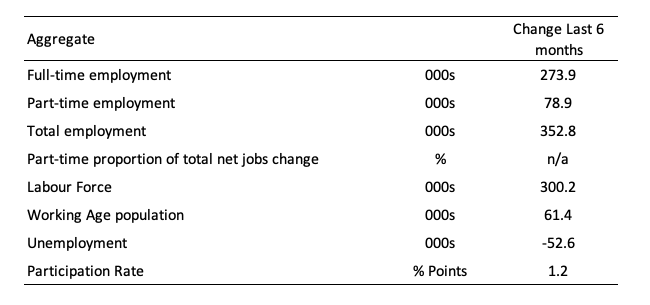
The following table provides an accounting summary of the labour market performance over the last six months to provide a longer perspective that cuts through the monthly variability and provides a better assessment of the trends.
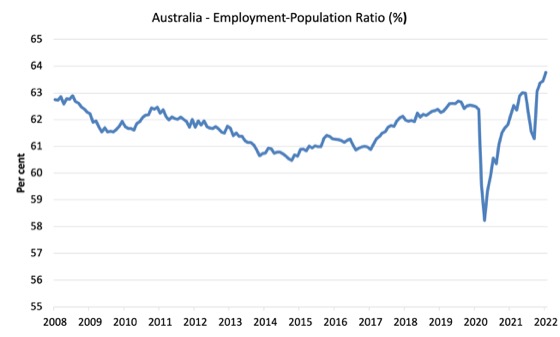
Given the variation in the labour force estimates, it is sometimes useful to examine the Employment-to-Population ratio (%) because the underlying population estimates (denominator) are less cyclical and subject to variation than the labour force estimates. This is an alternative measure of the robustness of activity to the unemployment rate, which is sensitive to those labour force swings.
The following graph shows the Employment-to-Population ratio, since February 2008 (the low-point unemployment rate of the last cycle).
It fell with the onset of the GFC, recovered under the boost provided by the fiscal stimulus packages but then went backwards again as the Federal government imposed fiscal austerity in a hare-brained attempt at achieving a fiscal surplus in 2012.
There are two forces working here – the denominator (population) is clearly providing favourable pressures due to the slower population growth as a result of the lack of immigration arising from the external border closures.
This is forcing employers to search harder for workers already in Australia rather than discriminate against the unemployed.
The numerator (employment) is clearly stronger as the restrictions ease.
The ratio rose by 0.4 points in February 2022.
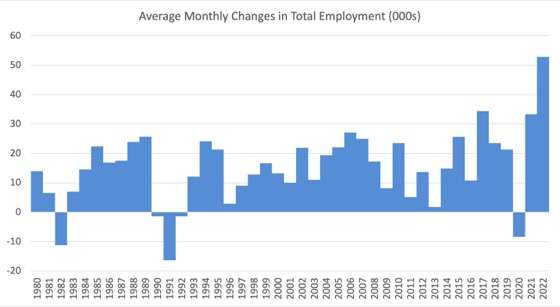
To put the current monthly performance into perspective, the following graph shows the average monthly employment change for the calendar years from 1980 to 2022 (to date).
1. The labour market weakened considerably over 2018 and that situation worsened in 2019.
2. The average employment change over 2020 was -8.4 thousand which rose to 31.3 thousand in 2021 as the lockdowns eased.
3. So far in 2022, the average monthly change is 52.9thousand but that will drop significantly as the year unfolds.
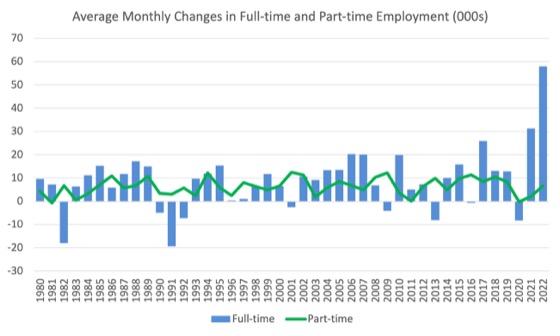
The following graph shows the average monthly changes in Full-time and Part-time employment (lower panel) in thousands since 1980.
The interesting result is that during recessions or slow-downs, it is full-time employment that takes the bulk of the adjustment. Even when full-time employment growth is negative, part-time employment usually continues to grow.
However, this crisis is different because much of the employment losses have been the result of lockdown and enforced business closures in sectors where part-time employment dominates.
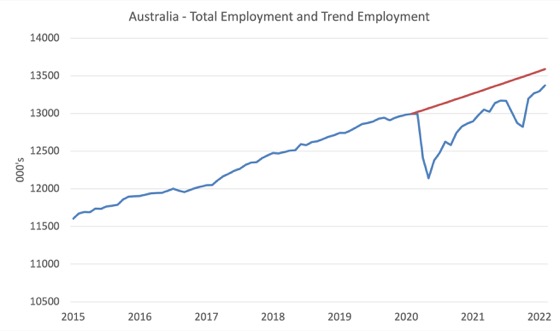
Actual and Trend Employment
The Australian labour market is now larger than it was in February 2020. But it is still a long way from where it would have been if it had have continued to expand at the previous trend.
The following graph shows total employment (blue line) and what employment would have been if it had continued to grow according to the average growth rate between 2015 and February 2020.
The gap as at February 2022 fell by 52.2 thousand to 216.1 thousand jobs.
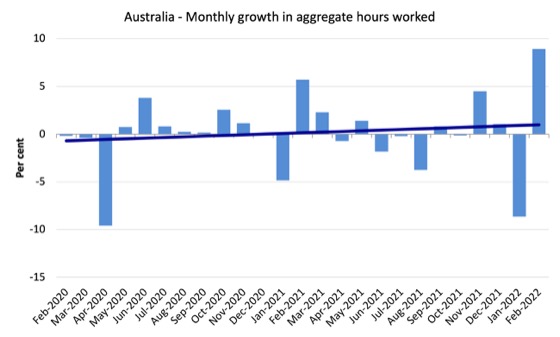
Hours worked rose by 148.7 million hours (8.9 per cent) in February 2022
This was basically just a reversal of a similar size fall last month.
Covid continues to play havoc with the data.
The following graph shows the monthly growth (in per cent) over the last 24 months.
The dark linear line is a simple regression trend of the monthly change (skewed by this month’s result).
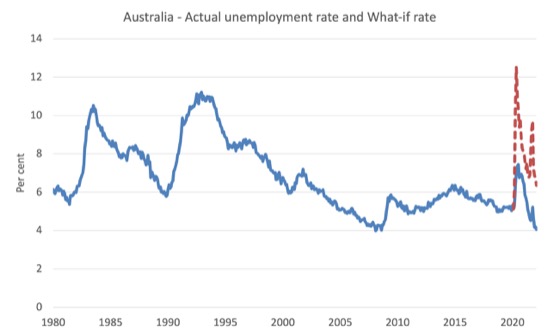
The Population Slowdown – the ‘What-if’ unemployment analysis
The following graph shows Australia’s working age population (Over 15 year olds) from January 2015 to February 2022.
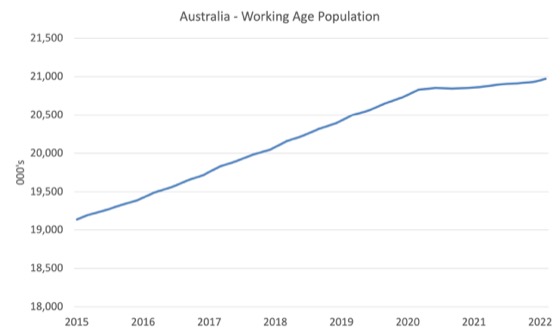
With the external border still largely closed, immigration has shrunk to virtually zero and the impact is very clear.
This flattening out has forced employers to work harder to get workers and is one of the reasons unemployment is falling quite quickly, given the circumstances.
The following graph shows the evolution of the actual unemployment rate since January 1980 to February 2022 and the dotted line is the ‘What-if’ rate, which is calculated by assuming the most recent peak participation rate (recorded at February 2022 = 66.4 per cent), the extrapolated working age population (based on growth rate between 2015 and February 2020) and the actual employment since February 2020.
It shows what the unemployment rate would have been given the actual employment growth had the working age population trajectory followed the past trends.
In this blog post – External border closures in Australia reduced the unemployment rate by around 2.7 points (February 28, 2022), I provided detailed analysis of how I calculated the ‘What-if’ unemployment rate.
So instead of an unemployment rate of 4 per cent, the rate would have been 6.4 per cent in January 2022, given the employment performance since the pandemic.
This finding puts a rather different slant to what has been happening since the onset of the pandemic.
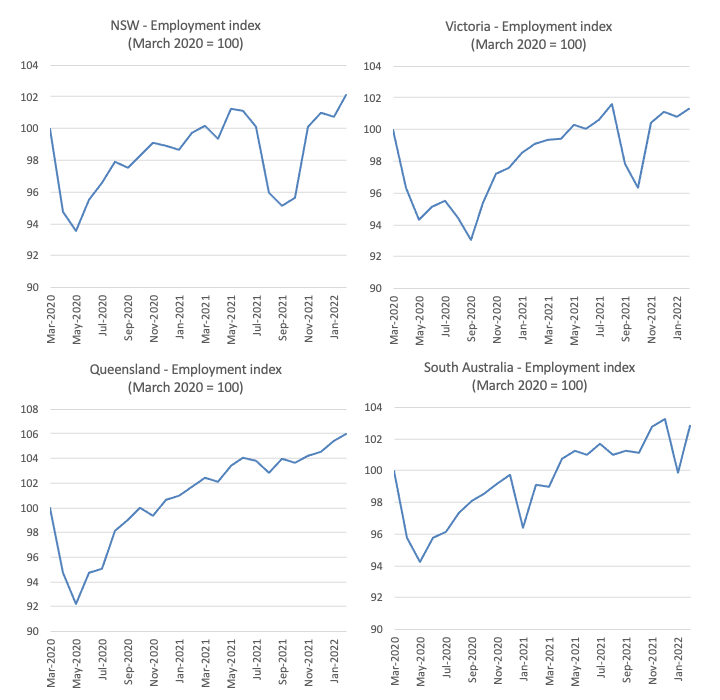
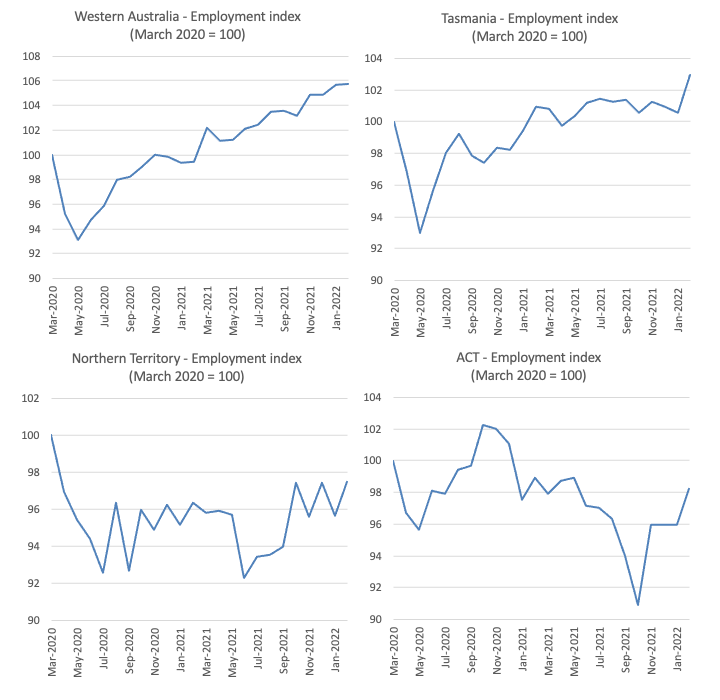
State and Territory Employment Trends
The lockdowns imposed in Sydney, Canberra and Melbourne are now over and while the ‘living with Covid’ politicians and their business pals thought that we would just go back to pre-Covid lifestyles, the situation is somewhat different.
Initially, after the Delta lockdowns lifted, employment rebounded, then Omicron came along and more workers became ill and the employment situation deteriorated.
Then it rebounded. But major floods and a growing wave of the new Omicron variant will reverse that rebound.
The roller coaster.
The following graphs show the employment evolution since March 2020 by state and territory.
NSW (102.1) and Victoria (101.3) are back to their March 2020 employment levels (index of 100).
Queensland (106), South Australia (102.8), Western Australia (105.7), Tasmania (103) are also above the pre-pandemic level.
But the territories – ACT (98.3) and NT (97.5) – are below.
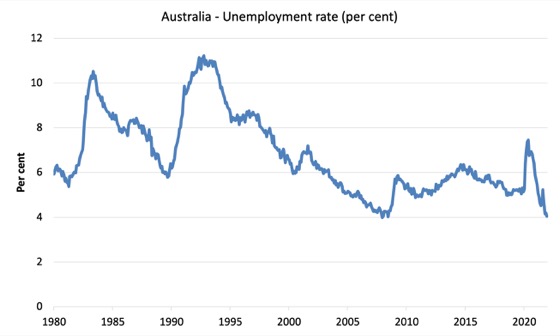
Unemployment fell by 18,500 to 563,300 persons in February 2022
The official unemployment rate fell to 4 per cent from 4.2 per cent (but bear in mind the ‘What-if’ analysis above).
The following graph shows the national unemployment rate from February 1980 to February 2022. The longer time-series helps frame some perspective to what is happening at present.
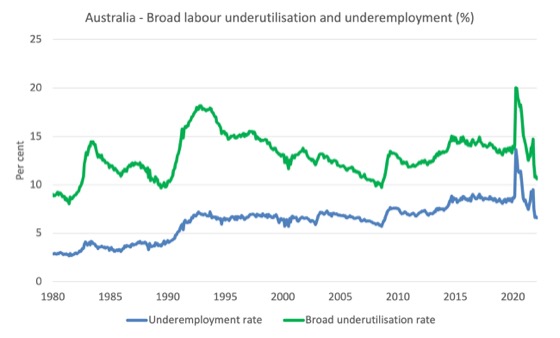
Broad labour underutilisation decreased by 0.3 points to 10.6 per cent in February 2022
The results for February 2022 are (seasonally adjusted):
1. Underemployment decreased by 0.1 points to 6.6 per cent (a fall of 12.4 thousand).
2. Overall there are 915.2 thousand underemployed workers.
3. The total labour underutilisation rate (unemployment plus underemployment) fell by 0.3 points to 10.6 per cent.
4. There were a total of 1478.5 thousand workers either unemployed or underemployed.
The following graph plots the seasonally-adjusted underemployment rate in Australia from February 1980 to the February 2022 (blue line) and the broad underutilisation rate over the same period (green line).
The difference between the two lines is the unemployment rate.
The three cyclical peaks correspond to the 1982, 1991 recessions and the more recent downturn.
The other difference between now and the two earlier cycles is that the recovery triggered by the fiscal stimulus in 2008-09 did not persist and as soon as the ‘fiscal surplus’ fetish kicked in in 2012, things went backwards very quickly.
The two earlier peaks were sharp but steadily declined. The last peak fell away on the back of the stimulus but turned again when the stimulus was withdrawn.
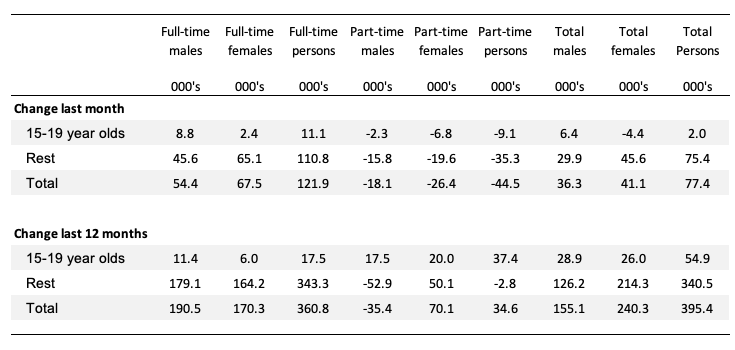
Teenage labour market stationary in February 2022
The following Table shows the distribution of net employment creation in the last month and the last 12 months by full-time/part-time status and age/gender category (15-19 year olds and the rest).
Despite the strong overall employment rebound, teenagers didn’t particularly gain much – although what was lost in the part-time segment of the labour market was offset by more full-time work, which is a good sign.
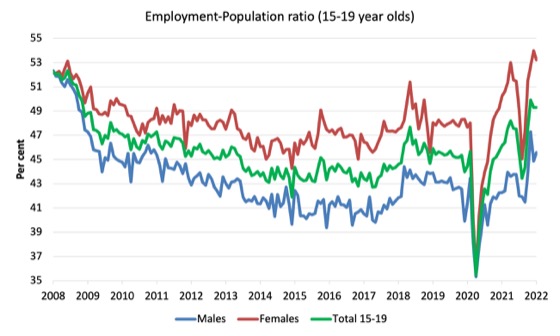
To put the teenage employment situation in a scale context (relative to their size in the population) the following graph shows the Employment-Population ratios for males, females and total 15-19 year olds since June 2008.
You can interpret this graph as depicting the loss of employment relative to the underlying population of each cohort. We would expect (at least) that this ratio should be constant if not rising somewhat (depending on school participation rates).
1. The male ratio has fallen by 6.8 percentage points since February 2008. It fell 0.7 points over the month. It is now 2.1 points above its level in March 2020.
2. The female ratio is 1.1 percentage points above the February 2008 level. It fell by 0.8 points over the month. It is now 5.2 points above its level in March 2020.
3. The overall teenage employment-population ratio has fallen by 2.9 percentage points since February 200. It is now 3.6 points above its level in March 2020. It was unchanged over the month.
Conclusion
My standard monthly warning: we always have to be careful interpreting month to month movements given the way the Labour Force Survey is constructed and implemented.
My overall assessment is:
1. There are still 1.5 million Australian workers without work in one way or another (officially unemployed or underemployed) and several hundred thousand who have left the active labour force due to lack of employment opportunities.
2. We are seeing the impact of flat population growth coming up against growing demand for workers and that is the reason the unemployment rate fell so quickly.
4. The probably underlying unemployment rate now that will reveal itself as conditions normalise is closer to 6.4 per cent rather than the official rate of 4 per cent.
That is enough for today!
(c) Copyright 2022 William Mitchell. All Rights Reserved.
We are nowhere near capacity constraints but the usual suspects are alleging the economy is running red hot and thus needs to be cooled by dampening demand, ie increasing interest rates.
Agree with Barri. Good labour market result also.
In Portugal, faced with labour shortage, after the pandemic lockdowns (left out of work, with no protection, immigrants left the country), employers turned their lonely eyes to Ukranian refugees.
It turns out that only a handful of them are willing to come here and mostly are women and children – eager to go back to Ukraine.
The economic model of global exploitation is dead, but we’ll keep on it until everything falls apart.
Paulo, your employers ought to look the Brazil. There are tons of people there who need a job. And, they speak the language.
I’ve been unemployed from my mechanical engineering profession for over a decade now just getting by as a painter and have reached the scary age of 60 so this is enough to block my re-entry into my preferred profession. No employers give me a chance even when my skills and experience are a good match and I expect that to remain the case even in a full employment economy. A Job Guarantee job would be a way forward but stupid neoliberalism dominates in Australia.
‘Overheated economy’ – bollocks!
For Thailand, the government is planning to cut back on spending and full treatment related to COVID-19 pandemic (even though the number of Omicron cases rise everyday), saying it will become a localized and benign virus soon, which could be taken care by the normal healthcare system and channels.
This mindset is likely to spread to other aspects of life quickly, like education support, job support, income support as well as other social programs that may not have immediate effects but significant long term benefits like scholarships to study aboard, research grants, soft and hard infrastructure in needs of repair or replace, more money for forced displacement and refugees.
These cutbacks will likely be the case as I see balance budget in urgency mentality post COVID is coming thick and fast.
It seems the future will look worst than the pre-COVID, coupled with the conflict that is going on, which in my mind will drag on for sometimes (until “one side” is totally bankrupted financially and socially. That is how long it will take in my view).
So, I see a serious stagnation is coming in many countries, not because of the circumstances but purely because the neoliberal “fantasy mindset”!
I propose that MMT people get together via zoom or others social app and layout plans for the post COVID world.
Let this discussion takes a center stage and leadership in rebuilding nations for the better for all before the top end of town help do it again, as it’s business as usual.
The austerity clock is ticking fast!
Have a nice weekend!
The US Fed has increased interest rates and says it will do it about 5 more times this year.
It will cause more inflation than it stops.
I think MMTers claim that a “soft landing” is not possible. That only a large enough rate increase to cause a full on deep recession will stop runaway inflation. Rate increases less than this just make it worse.
Am I right?
.