Today (April 18, 2024), the Australian Bureau of Statistics released the latest - Labour Force,…
Australian labour market – deteriorates in April – employment growth zero and rising hidden unemployment
I saw an Australian Broadcasting Commission (ABC) economics commentator today headlining “The unemployment rate has fallen to 3.9%”. That implied something good had happened. In fact, not only did the Australian Bureau of Statistics (ABS) say the rate was unchanged (rounded) but the participation also fell, which means the underlying unemployment situation deteriorated. Two days out from a federal election, the ABC should be doing better than that. His Tweet was pure misrepresentation. All this followed the ABS release of the latest labour force data today (May 19, 2022) – Labour Force, Australia – for April 2022. The labour market deteriorated somewhat in April as employment growth was virtually zero and the participation rate fell by 0.1 points. While the official unemployment rate was unchanged when rounding to one decimal place on 3.9 per cent, it would have been higher (4 per cent) had the participation rate remained constant. In other words, hidden unemployment rose by 19.9 thousand. There are still 1.389 million Australian workers without work in one way or another (officially unemployed or underemployed). The only reason the unemployment rate is so low is because the underlying population growth remains low after the border closures over the last two years. My underlying (‘What-if’) unemployment rate is closer to 6.4 per cent rather than the official rate of 3.9 per cent. Finally, with real wages falling so sharply and employment growth virtually zero, one realises that the mainstream claim that lower real wages are good for employment is bunk!
The summary ABS Labour Force (seasonally adjusted) estimates for April 2022 are:
- Employment increased by 4,000 (0.03 per cent) – Full-time employment increased by 92,400 and part-time employment decreased by 88,400.
- Unemployment fell by 11,100 to 537,100 persons.
- The official unemployment rate remained steady at 3.9 per cent.
- The participation rate decreased 0.1 points to 66.3 per cent.
- The employment-population ratio was steady at 63.8 per cent.
- Aggregate monthly hours rose by 23 million hours (1.3 per cent).
- Underemployment decreased by 0.2 points to 6.1 per cent (a fall of 32.6 thousand). Overall there are 852.5 thousand underemployed workers. The total labour underutilisation rate (unemployment plus underemployment) fell by 0.3 points to 10.0 per cent. There were a total of 1,389.5 thousand workers either unemployed or underemployed.
In its – Media Release – the ABS note that:
3.9 per cent is the lowest the unemployment rate has been in the monthly survey. The last time the unemployment rate was lower than this was in August 1974, when the survey was quarterly.
In line with rising numbers of COVID-19 cases in April, the number of people working reduced hours due to illness continued to be high, reflecting ongoing disruption associated with the Omicron variant …
Around 740,000 people worked reduced hours in April because of illness, almost double what we usually saw in April before the pandemic.
But note that some people are claiming the unemployment rate has fallen to 3.9 per cent based on last month’s estimate of 4.0 per cent.
However, as the ABS point out “the unemployment rate … remained level, in rounded terms, with the revised March rate of 3.9 per cent.”
Data is always revised backwards, so one has to be careful in making comparisons on a month-to-month basis.
Further, the use of the term ‘falling’ implies an improvement, when in fact, had the participation rate not fallen the official unemployment rate would have risen – so no improvement at all given employment growth was virtually zero and more people left the active labour force.
Employment increased by 4,000 in April 2022
1. Employment growth was very modest for the second successive month rising by just 4000 (0.03) per cent.
2. But that aggregate figure disguised substantial shift to full-time work away from part-time work.
2. Full-time employment increased by 92,400 and part-time employment decreased by 88,400.
3. Employment in Australia is 400 thousand (net) jobs (3.1 per cent) above the pre-pandemic level in February 2020.
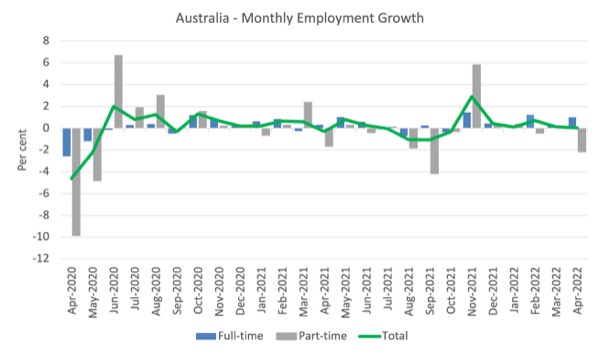
The following graph shows the month by month growth in full-time (blue columns), part-time (grey columns) and total employment (green line) for the 24 months to April 2022 using seasonally adjusted data.
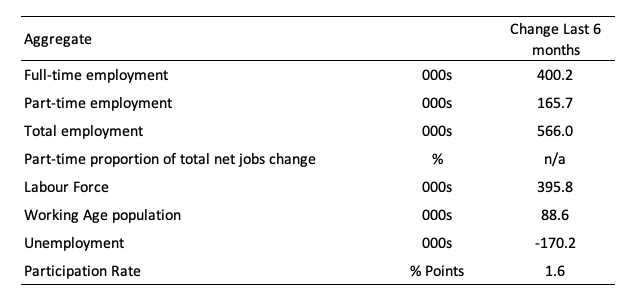
The following table provides an accounting summary of the labour market performance over the last six months to provide a longer perspective that cuts through the monthly variability and provides a better assessment of the trends.
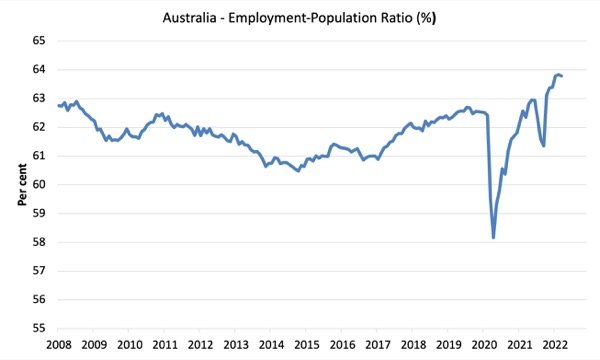
Given the variation in the labour force estimates, it is sometimes useful to examine the Employment-to-Population ratio (%) because the underlying population estimates (denominator) are less cyclical and subject to variation than the labour force estimates. This is an alternative measure of the robustness of activity to the unemployment rate, which is sensitive to those labour force swings.
The following graph shows the Employment-to-Population ratio, since April 2008 (the low-point unemployment rate of the last cycle).
It fell with the onset of the GFC, recovered under the boost provided by the fiscal stimulus packages but then went backwards again as the Federal government imposed fiscal austerity in a hare-brained attempt at achieving a fiscal surplus in 2012.
There are two forces working here – the denominator (population) is clearly providing favourable pressures due to the slower population growth as a result of the lack of immigration arising from the external border closures.
This is forcing employers to search harder for workers already in Australia rather than discriminate against the unemployed.
The numerator (employment) is clearly stronger as the restrictions ease.
The ratio was steady in April 2022.
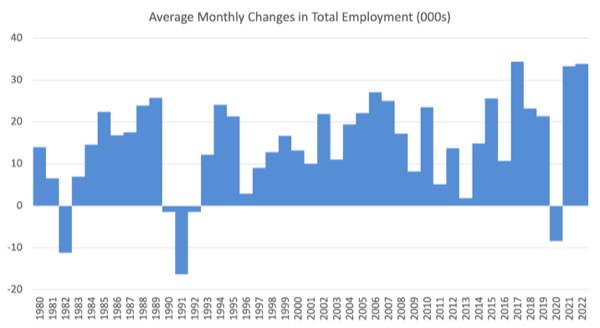
To put the current monthly performance into perspective, the following graph shows the average monthly employment change for the calendar years from 1980 to 2022 (to date).
1. The labour market weakened considerably over 2018 and that situation worsened in 2019.
2. The average employment change over 2020 was -8.4 thousand which rose to 33.3 thousand in 2021 as the lockdowns eased.
3. So far in 2022, the average monthly change is 33.9 thousand about the same as last year. I expect that to fall further as the impact of the abnormally high February observation is diluted.
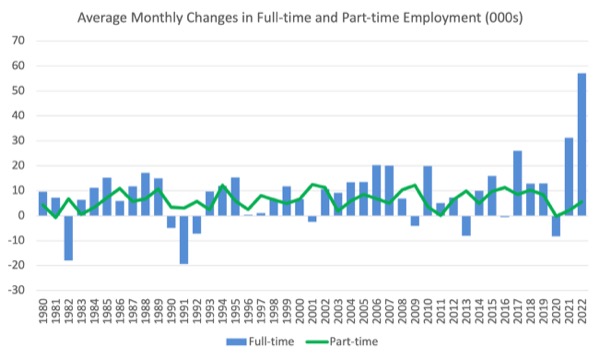
The following graph shows the average monthly changes in Full-time and Part-time employment (lower panel) in thousands since 1980.
The interesting result is that during recessions or slow-downs, it is full-time employment that takes the bulk of the adjustment. Even when full-time employment growth is negative, part-time employment usually continues to grow.
Actual and Trend Employment
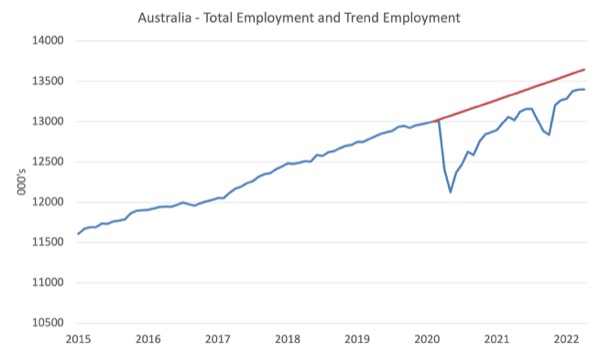
The Australian labour market is now larger than it was in April 2020. But it is still a long way from where it would have been if it had have continued to expand at the previous trend.
The following graph shows total employment (blue line) and what employment would have been if it had continued to grow according to the average growth rate between 2015 and April 2020.
In April 2022, the gap increased by 21.4 thousand to 244 thousand jobs as a result of the slow employment growth.
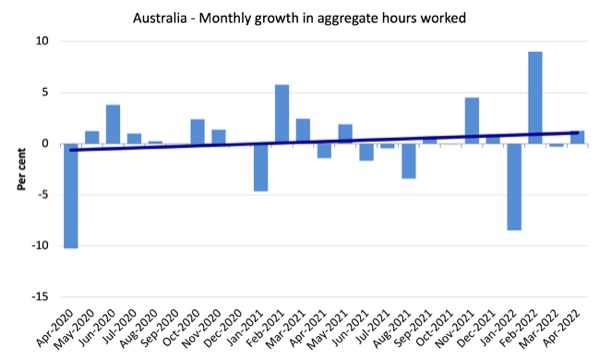
Hours worked rose by 23 million hours (1.3 per cent) in April 2022
The rise in hours worked partially reverses the decline last month due to the floods in Queensland and NSW. There are still tens of thousands of workers who are unable to work as a result of Covid sickness.
The following graph shows the monthly growth (in per cent) over the last 24 months.
The dark linear line is a simple regression trend of the monthly change (skewed by the couple of outlier result).
The Population Slowdown – the ‘What-if’ unemployment analysis
The following graph shows Australia’s working age population (Over 15 year olds) from January 2015 to April 2022. The dotted line is the projected growth had the pre-pandemic trend continued.
The difference between the lines is the decline in the working age population due to the Covid restrictions.
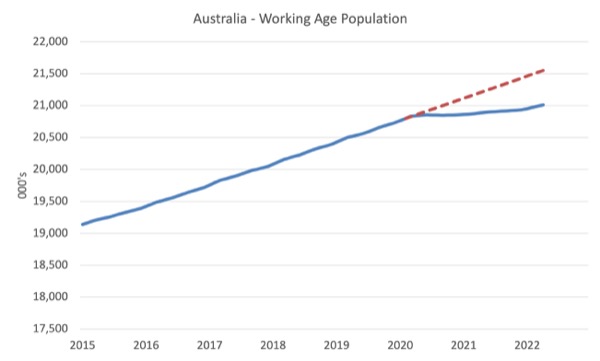
With the external border only just starting to open, net immigration is still very low.
This flattening out has forced employers to work harder to get workers and is one of the reasons unemployment has fallen quickly, given the circumstances.
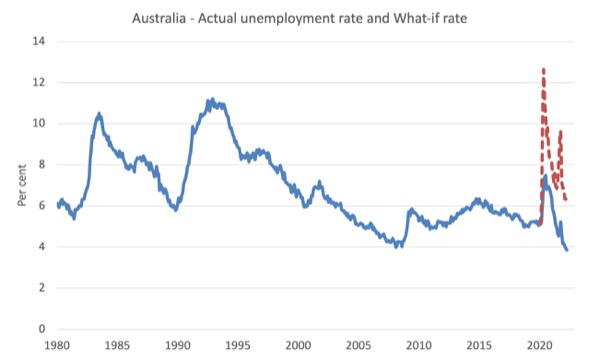
The following graph shows the evolution of the actual unemployment rate since January 1980 to April 2022 and the dotted line is the ‘What-if’ rate, which is calculated by assuming the most recent peak participation rate (recorded at February 2022 = 66.5 per cent), the extrapolated working age population (based on growth rate between 2015 and April 2020) and the actual employment since April 2020.
It shows what the unemployment rate would have been given the actual employment growth had the working age population trajectory followed the past trends.
In this blog post – External border closures in Australia reduced the unemployment rate by around 2.7 points (April 28, 2022), I provided detailed analysis of how I calculated the ‘What-if’ unemployment rate.
So instead of an unemployment rate of 3.9 per cent, the rate would have been 6.4 per cent in April 2022, given the employment performance since the pandemic.
This finding puts a rather different slant to what has been happening since the onset of the pandemic.
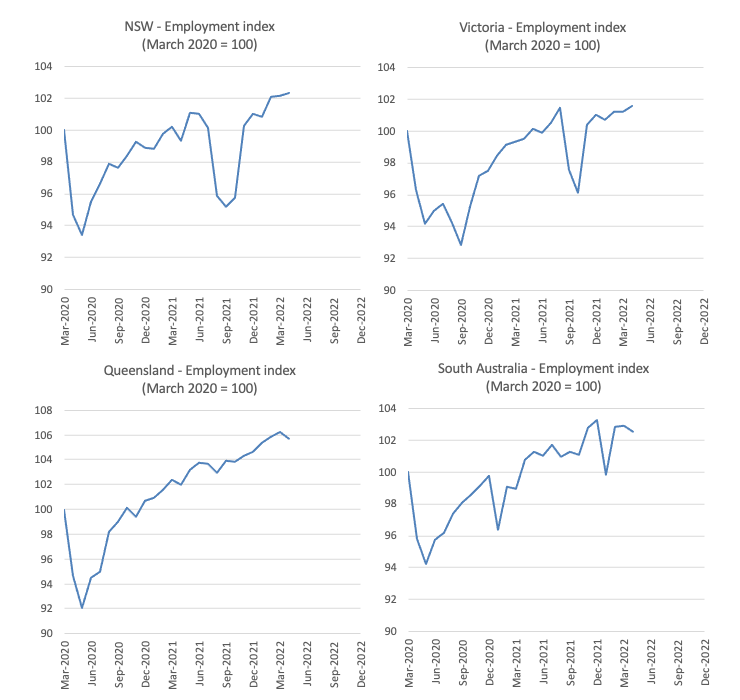
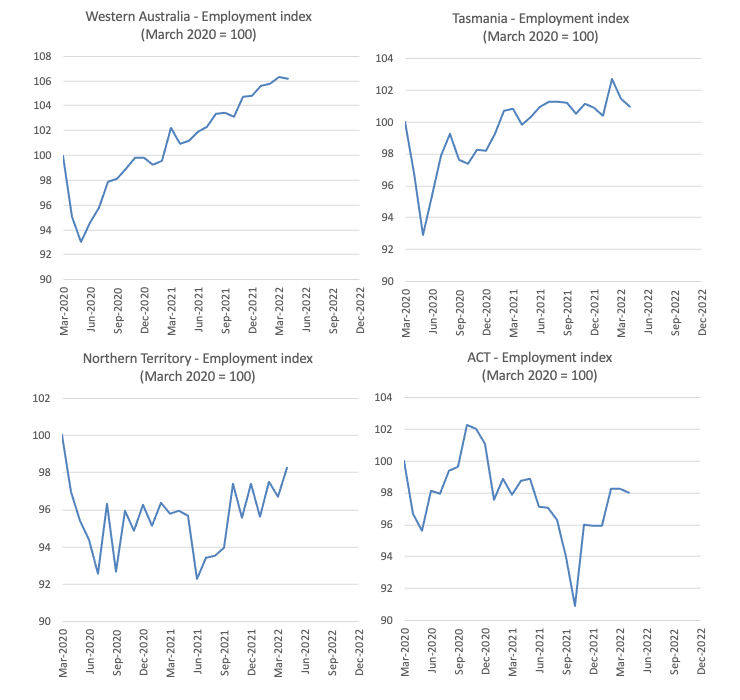
State and Territory Employment Trends
After lockdowns were lifted, the major floods on the East Coast and a growing wave of the new Omicron variant have combined to mute the labour market rebound.
The following graphs show the employment evolution since April 2020 by state and territory.
All the states have regained their April 2020 levels (index of 100).
But the territories – ACT (98.0) and NT (98.3) – are below.
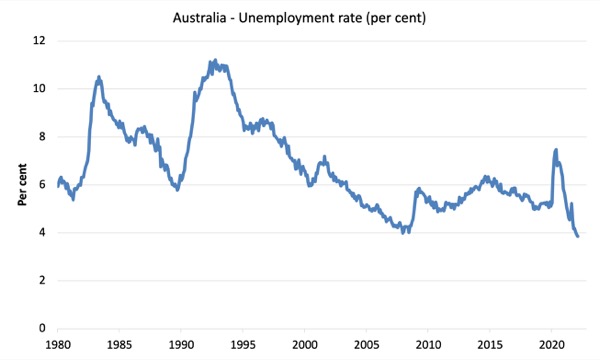
Unemployment fell by 11,100 to 537,100 persons in April 2022
The official unemployment rate was 3.9 per cent and the ABS noted it had revised the March figure down to 3.9 per cent.
Also bear in mind the ‘What-if’ analysis above and the fall in participation (see below).
The following graph shows the national unemployment rate from April 1980 to April 2022. The longer time-series helps frame some perspective to what is happening at present.
Broad labour underutilisation decreased by 0.3 points to 10.0 per cent in April 2022
The results for April 2022 are (seasonally adjusted):
1. Underemployment decreased by 0.1 points to 6.1 per cent (a fall of 32.6 thousand) – this is the result of a rise in full-time work.
2. Overall there are 852.5 thousand underemployed workers.
3. The total labour underutilisation rate (unemployment plus underemployment) fell by 0.3 points to 10.0 per cent.
4. There were a total of 1,389.5 thousand workers either unemployed or underemployed.
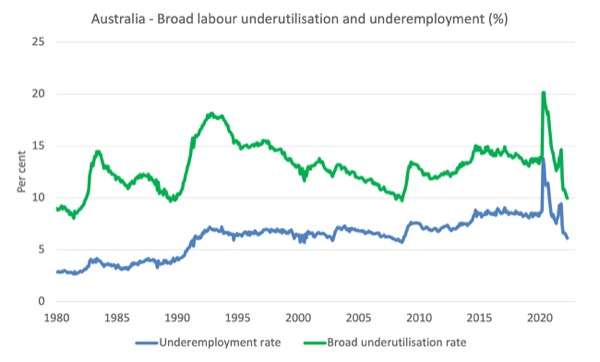
The following graph plots the seasonally-adjusted underemployment rate in Australia from April 1980 to the April 2022 (blue line) and the broad underutilisation rate over the same period (green line).
The difference between the two lines is the unemployment rate.
The three cyclical peaks correspond to the 1982, 1991 recessions and the more recent downturn.
The other difference between now and the two earlier cycles is that the recovery triggered by the fiscal stimulus in 2008-09 did not persist and as soon as the ‘fiscal surplus’ fetish kicked in in 2012, things went backwards very quickly.
The two earlier peaks were sharp but steadily declined. The last peak fell away on the back of the stimulus but turned again when the stimulus was withdrawn.
Aggregate participation rate decreased by 0.1 points to 66.3 per cent
As noted above, the official unemployment rate would have risen had the participation rate not fallen.
What would have been the case if the participation rate had not fallen?
The labour force is a subset of the working-age population (those above 15 years old). The proportion of the working-age population that constitutes the labour force is called the labour force participation rate. Thus changes in the labour force can impact on the official unemployment rate, and, as a result, movements in the latter need to be interpreted carefully. A rising unemployment rate may not indicate a recessing economy.
The labour force can expand as a result of general population growth and/or increases in the labour force participation rates.
The following Table shows the breakdown in the changes to the main aggregates (Labour Force, Employment and Unemployment) and the impact of the fall in the participation rate.
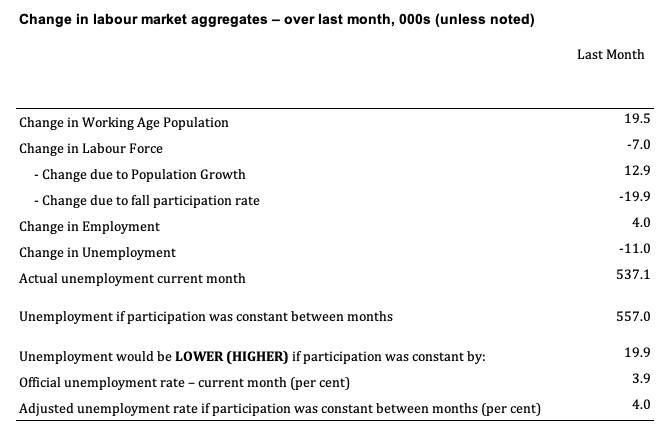
The change in the labour force in April 2022 was the outcome of two separate factors:
- The underlying population growth added 12.9 thousand persons to the labour force. The population growth impact on the labour force aggregate is relatively steady from month to month but has slowed over the last year due to the external border restrictions which have drastically reduced migration rates; and
- The fall in the participation rate meant that there were 19.9 thousand workers exiting the labour force (relative to what would have occurred had the participation rate remained unchanged).
- The net result was that the labour force fell by 7.0 thousand.
Assessment:
1. If the participation rate had not have fallen in April 2022, total unemployment, given the current employment level, would have been 557.0 thousand rather than the official count of 537.1 thousand as recorded by the ABS – a difference of 19.9 thousand workers (the ‘participation effect’).
2. Without the fall in the participation rate, the official unemployment rate would have been 4 per cent (rounded) rather than its current value of 3.9 per cent).
3. In other words, the rise in labour underutilisation is being hidden outside the official labour force.
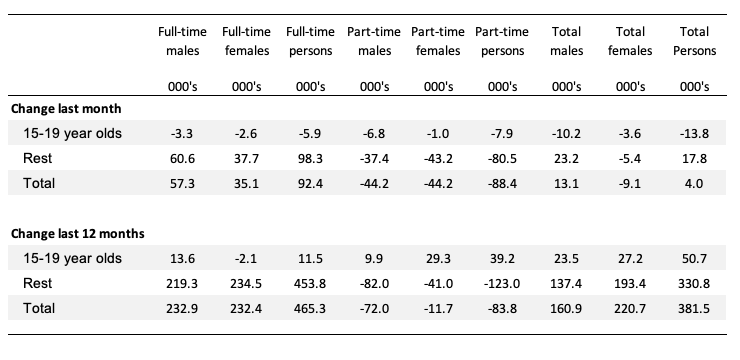
Teenage labour market deteriorates in April 2022
While teenagers have fare well in the labour market over the last 12 months, their fortunes were reversed in April losing out in both full-time and part-time employment.
The following Table shows the distribution of net employment creation in the last month and the last 12 months by full-time/part-time status and age/gender category (15-19 year olds and the rest).
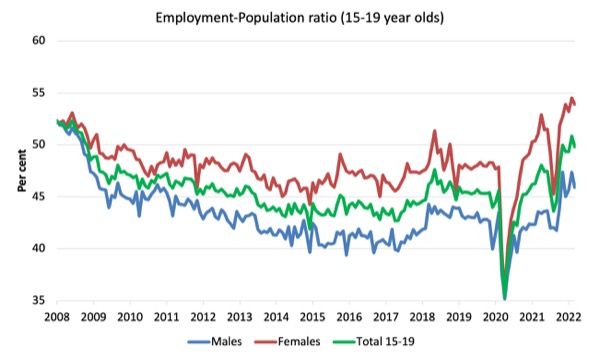
To put the teenage employment situation in a scale context (relative to their size in the population) the following graph shows the Employment-Population ratios for males, females and total 15-19 year olds since June 2008.
You can interpret this graph as depicting the loss of employment relative to the underlying population of each cohort. We would expect (at least) that this ratio should be constant if not rising somewhat (depending on school participation rates).
1. The male ratio has fallen by 6.4 percentage points since April 2008. It fell 1.4 points over the month. It is now 2.4 points above its level in April 2020.
2. The female ratio is 1.8 percentage points above the April 2008 level. It fell 0.6 points over the month. It is now 6.0 points above its level in April 2020.
3. The overall teenage employment-population ratio has fallen by 2.4 percentage points since April 2008. It fell by 1 point over the month. It is now 4.2 points above its level in April 2020.
Conclusion
My standard monthly warning: we always have to be careful interpreting month to month movements given the way the Labour Force Survey is constructed and implemented.
My overall assessment is:
1. The labour market deteriorated somewhat in April as employment growth was virtually zero and the participation rate fell by 0.1 points.
2. While the official unemployment rate was unchanged when rounding to one decimal place on 3.9 per cent, it would have been higher (4 per cent) had the participation rate remained constant. In other words, hidden unemployment rose by 19.9 thousand.
3. There are still 1.389 million Australian workers without work in one way or another (officially unemployed or underemployed). The only reason the unemployment rate is so low is because the underlying population growth remains low after the border closures over the last two years.
4. The underlying (‘What-if’) unemployment rate is closer to 6.4 per cent rather than the official rate of 3.9 per cent.
That is enough for today!
(c) Copyright 2022 William Mitchell. All Rights Reserved.
Dear Bill,
I hope you don’t mind a (slightly) off-topic comment, but I was wondering whether you were thinking of blogging about the discrepancy between the high level of corporate profits that you mentioned in your recent post here with news about stock market jitters due to apparently falling profits at corporations such as Walmart and Target?
Presumably, both views cannot be correct?
Falling stocks in the US are partly due to falling share prices of ‘tech’ companies who never made money in the last decade, and are now being dumped, as central banks lift interest rates from near zero.
Falling company profits in the real economy (eg Walmart and Target) are much more recent, as supply and covid complications depress real economic activity. So the apparent discrepancy is more nuanced; and if company sales and profits keep falling, then not only labour, but capital will also suffer, the former more than the latter as always.
@Neil Halliday
Fair points, but the narrative being built up is that stocks are falling because profits are being being cut, and this could easily become a new justification for increasing interest rates.
Profits are falling because of inflation.
When you only have a certain amount of disposable income every month and hardly any savings when prices rise you buy less.
I got my first energy Bill through after the removal of the cap and it is normally £80 it was £150. So nearly double.
Inflation is always good for someone as it is a redistribution of income. Some sectors earn more some sectors earn less.
If energy was renationalised and the government never needs the revenue from the nationalised energy company. Then the charge for using energy after it has been nationalised just becomes another tax.
The government could set the price of energy to whatever it wants or needs to in order to help control inflation.
No longer would the privatised energy companies be able to threaten investment strikes to hold governments to ransom or scare governments with job losses. Or go running to Nanny to ask for cheap labour from abroad as soon as local workers get a bit of pricing power as their wages increase.
Why public broadcasting has always been good value for money. They never needed to recoup the cost. If the licence fee money collected ran out as they ran over budget. The money could always be found and just became part of the government budget.
Compare that with how much you pay to watch TV today. You can pay as much in one month to get all the channels you like what you used to pay in a year.
Consider if broadband was nationalised and was free ?
Privatisations all add up – rent, energy, utilities, travel, education, communications and media, your pension etc, etc, etc.
People who believe their taxes pay for everything just can’t put two and two together and figure out where the real theft takes place. Think that taxes are the real theft and ignore the rent seeking that takes place everywhere else.
After 101 privatisations take place their taxes remain the same, pay more than ever out of their disposable income every month. They can’t figure out why from the starting point of believing a myth.
Whenever a politician announces tax cuts the rent seekers are licking their lips. When they cut taxes on the lowest paid it is just a direct transfer to the rent seekers. To allow the lowest paid to pay their bills as the rent seekers increase their prices. Why they had no qualms to introduce furlough payments during the pandemic. The rent seekers their political donars had to be paid.
It used to be 40% of your wage covered your basic needs and why one wage earner could raise a family. Now in some cases 70% of your wage is needed to cover your basic needs why 2 wage earners in a household can struggle if they are on the minimum wage.
A lot of families will really struggle as energy prices double.
Considering the min wage gives you roughly after tax £1,300 month The average asking rent in Glasgow is now £992 per month.
Both views can be correct.
Inflation is a redistribution of wealth that creates winners and losers. Some do very well out of it.
Walmart and Target are they winning or losing ?
As a rent seeker if you price gouge on basic needs like water and energy and a roof over people’s heads these become a priority and are paid first by the wage earner. As they don’t really have an alternative as smaller energy companies have gone bust and big 3 or 4 manipulate the prices between themselves. Like the 2 ice cream sellers on the beach.
If Wal-Mart and Target price gouge the wage earner will look for alternatives or in many cases do without.
Why in the winter you hear of the retired and less well off having to make a choice between heat or eat.
AFAIK, I’ve been told that Adam Smith in the “Wealth of Nations”, 1776, wrote about the free market, but he meant a market free from rent seekers who can demand and get higher profits. I think that the main reason economic students are not forced to read him is that Neo-liberalism and Neo-Keynesianism both want to let the rent seekers have their way with the economy.
Right?
If we listened to Smith, then the Gov. would smash the rent seekers, instead of giving them everything they ask for.
Steve,
Not just Adam Smith most of them at the time because they were fighting against neo feudalism and Land rent.
https://michael-hudson.com/2010/12/adam-smith-critiques-the-deficit-reduction-commission/
Just imagine if energy was renationalised and the government said nobody will lose their jobs and in fact to encourage people to stay they would pay them a little bit extra than what they were getting.
So the exact same people are running Energy who were running it before.
What does that do to the arguments that the private sector is more efficient than the public sector ?
When absolutely nothing has changed apart from the government doesn’t need to use the revenue collected from energy the way the private sector did. They use it in a completely different way entirely.
When it comes to healthcare the debate should be why is private healthcare allowed to steal both the skills and real resources from the NHS just so rich people can jump the Q.
Again private healthcare could be renationalised and absorbed by the NHS with the exact same people running it . Which is more efficient ?
Ideological fairy tales have been used by bankers and the leisure class and capital to create more opportunities from which to create monopolies from which to extract rent. On the myth competition will make the public sector cheaper to use. I’d like to see them make it cheaper than free to use lol.
Millions of people over the years sacrificed so much to try and protect our disposable income as they fought against feudalism. The last couple of generations threw it all away after being conditioned in education camps from the age of 5. Eating TV dinners in front of a propaganda box in their living rooms.
Our disposable income should be protected as much as possible when we use the public sector and when we use the private sector we should be faced with a wall of fierce competition. Neoliberalism and globalism and Monetarism has ensured this is never the case and we have been drowned in ideological drivel.
When we shop in the private sector we are faced with a number of Arcadia Groups Ltd.
https://en.m.wikipedia.org/wiki/Arcadia_Group
Because of the paradox of productivity and that the monopolies and mergers and competition authority is corrupt and run by a bunch of gangsters.
As Neil has already pointed out…
” The neoclassical Keynsian, monetarist and Austrian view still believes that the economy tends to fix itself. If we just sit back economic growth will go back to its maximum. Unemployment will drop to 2% what we consider full employment but it might need some help now and then. The Paul Krugman mainstream view. That There are no business cycles. However, you could have the purist free market economy in the world but still have big unemployment numbers because the system tends to move towards breakdown.
Why can’t it be that higher wages force firms to invest in better management techniques and the most advanced technologies in order to get the most out of their higher cost labour?
That’s known as the paradox of productivity. Productivity improvements just lead to falling prices, so firms try to avoid doing productivity improvements and prefer to try and obtain monopoly power instead. That’s what a ‘market niche’ is. Higher wages will lead to some firms failing, which releases people onto the labour market, driving down wages. If you try to hold those jobs up, and force losses onto the other side you end up with an investment strike and the whole house of cards collapses into stagflation.
Failing to match higher wages with higher product *must* result in *both* investment capital and the demanding wage earners taking a cold bath. The economic system is a referee. It must not favour either side in the football match.
And why would firms in a competitive capitalistic system ever try to avoid productivity improvements?
Compare the cost of a concert violinist to a loaf of bread in the 19th century vs today. That’s what productivity increases do over time – because it takes less human time to produce an item, and time is really what everything ends up being priced in. That’s the paradox of productivity. Productivity improvements ultimately leads to cheaper prices not increased profits. Because that’s what competition is there to do. The profits can go further – in that they can buy more stuff. But capitalists like to accumulate units of account.
In essence the dynamics of pure competition leads to an oversupply in the market which brings prices down until firms start to go bust to eliminate the oversupply. Therefore market players try to stop competition happening by constantly seeking a monopoly perch on which to extract rent. The myths of free market beliefs say it all sorts itself out. It doesn’t. The system has to force competition onto essentially reluctant players, and eliminating the clarion call of “what about the jobs” is one way of doing that – let bad firms go bust.
A company that can produce more with the same inputs (costs) is going to do that if there is a market for their product ?
That’s the problem, there isn’t. Because the costs is the income that is used to buy the product (in aggregate). If you expand output then you are selling to the same income which implies the price must go down to shift the increased amount of stuff.
Theoretically their competition will eventually learn how to do the same and the excess profit will disappear ?
Not theoretically. That is exactly what happens. The dynamics of market share maintenance then kick in and prices go down. You get a short uplift and then a nosedive. When you’ve been in business long enough you know that getting into a niche is better than constantly trying to run up the down escalator. Because items are ultimately priced in person time used to create them.
We all make plans but when it boils down to it actual demand must match actual supply at the point of effective demand – whatever the plans were. “