Regular readers will know I have been assessing the evolving data concerning the longer-run impacts…
Australian labour market – strong full-time employment growth
The Australian Bureau of Statistics (ABS) released of the latest labour force data today (June 18, 2022) – Labour Force, Australia – for May 2022. The labour market improved markedly in May after several months of weakness. The robust full-time employment growth was a good sign as was the increasing participation rate. That particularly favoured the younger workers. The official unemployment rate was unchanged but the underlying (‘What-if’) unemployment rate is closer to 6.1 per cent rather than the official rate of 3.9 per cent. There are still 1,355.5 thousand Australian workers without work in one way or another (officially unemployed or underemployed). The only reason the unemployment rate is so low is because the underlying population growth remains low after the border closures over the last two years.
The summary ABS Labour Force (seasonally adjusted) estimates for May 2022 are:
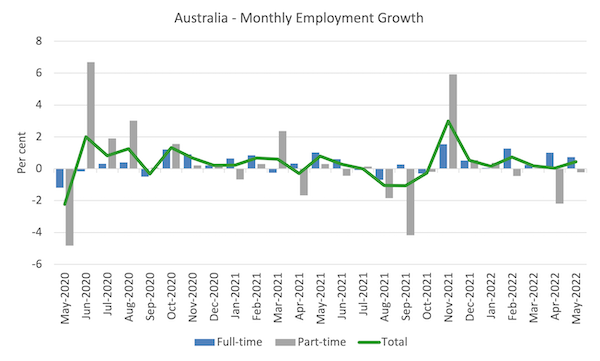
- Employment increased by 60,600 (0.5 per cent) – Full-time employment increased by 69.4 thousand and part-time employment decreased by 8.7 thousand.
- Unemployment rose by 7,800 to 544,100 persons.
- The official unemployment rate remained steady at 3.9 per cent.
- The participation rate increased 0.3 points to 66.7 per cent.
- The employment-population ratio increased by 0.3 points to 64.1 per cent.
- Aggregate monthly hours rose by 17 million hours (0.9 per cent).
- Underemployment decreased by 0.4 points to 5.7 per cent (a fall of 50.1 thousand). Overall there are 807.3 thousand underemployed workers. The total labour underutilisation rate (unemployment plus underemployment) fell by 0.3 points to 9.6 per cent. There were a total of 1355.5 thousand workers either unemployed or underemployed.
In its – Media Release – the ABS noted that:
The 61,000 increase in the number of employed people in May followed a smaller increase of 4,000 people in April, which coincided with Easter, school holidays, impacts from floods and ongoing disruptions associated with the Omicron variant …
The increase in May 2022 was the seventh consecutive increase in employment, following the easing of lockdown restrictions in late 2021 …
In line with rising numbers of COVID-19 cases in May, the number of people working reduced hours due to illness continued to be high. This reflected ongoing disruption associated with the Omicron variant and also an increasing number of cases of influenza …
The number of people working fewer hours than usual due to own illness increased in May to around 781,000 people, almost double the usual number for this month.
Employment increased by 60,600 in May 2022
1. Employment growth was stronger after 2 weak months – rising by just 60,600 (0.45) per cent.
2. But that aggregate figure disguised substantial shift to full-time work away from part-time work (with attendant consequences for underemployment – see below).
2. Full-time employment increased by 69.4 thousand and part-time employment decreased by 8.7 thousand.
3. Employment in Australia is 510 thousand (net) jobs (3.9 per cent) above the pre-pandemic level in February 2020.
The following graph shows the month by month growth in full-time (blue columns), part-time (grey columns) and total employment (green line) for the 24 months to May 2022 using seasonally adjusted data.
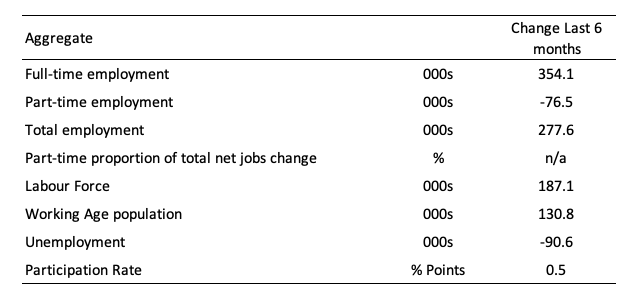
The following table provides an accounting summary of the labour market performance over the last six months to provide a longer perspective that cuts through the monthly variability and provides a better assessment of the trends.
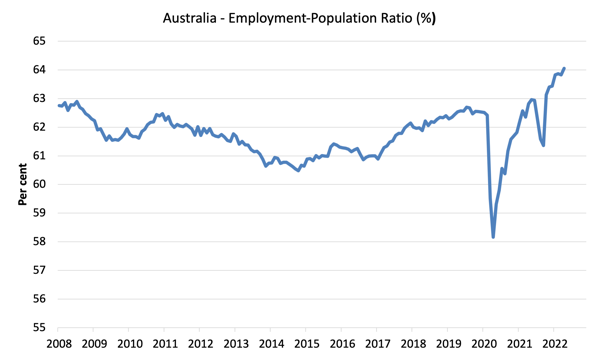
Given the variation in the labour force estimates, it is sometimes useful to examine the Employment-to-Population ratio (%) because the underlying population estimates (denominator) are less cyclical and subject to variation than the labour force estimates. This is an alternative measure of the robustness of activity to the unemployment rate, which is sensitive to those labour force swings.
The following graph shows the Employment-to-Population ratio, since April 2008 (that is, since the GFC).
There are two forces working here – the denominator (population) is clearly pushing the ratio down due to the slower population growth as the external border openings take a while to impact on inflow.
This is forcing employers to search harder for workers already in Australia rather than discriminate against the unemployed.
The numerator (employment) is clearly positive.
The ratio increased by 0.3 points to 64.1 per cent in May 2022 – a strong result.
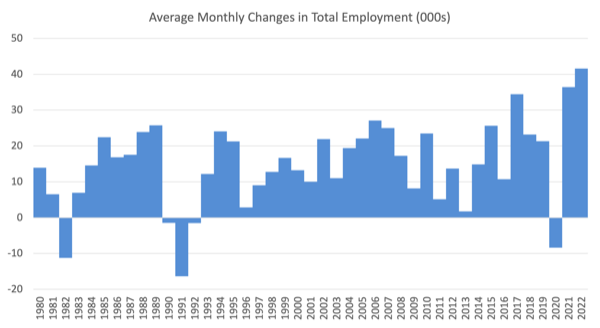
For perspective, the following graph shows the average monthly employment change for the calendar years from 1980 to 2022 (to date).
1. The average employment change over 2020 was -8.4 thousand which rose to 33.3 thousand in 2021 as the lockdowns eased.
3. So far in 2022, the average monthly change is 41.6 thousand.
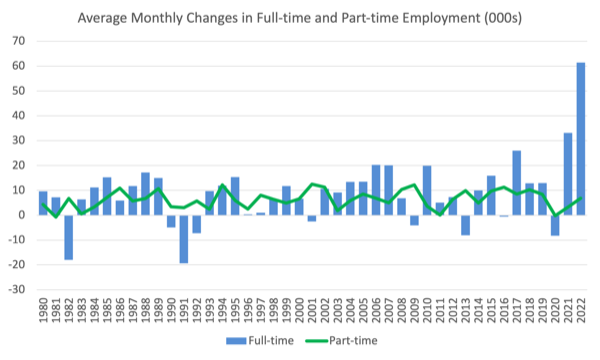
The following graph shows the average monthly changes in Full-time and Part-time employment (lower panel) in thousands since 1980.
The interesting result is that during recessions or slow-downs, it is full-time employment that takes the bulk of the adjustment. Even when full-time employment growth is negative, part-time employment usually continues to grow.
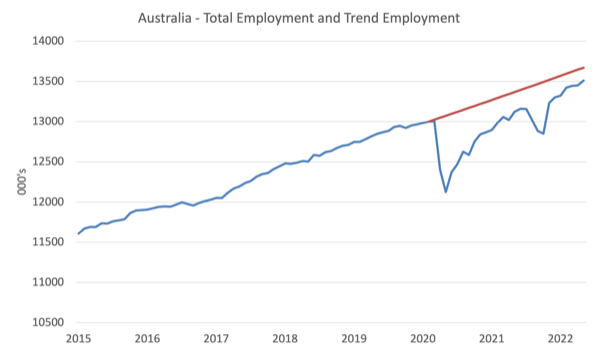
Actual and Trend Employment
The Australian labour market is now larger than it was in April 2020. But it is still a long way from where it would have been if it had have continued to expand at the previous trend.
The following graph shows total employment (blue line) and what employment would have been if it had continued to grow according to the average growth rate between 2015 and April 2020.
In May 2022, the gap fell by 35.2 thousand to 160 thousand jobs as a result of the stronger than usual employment growth.
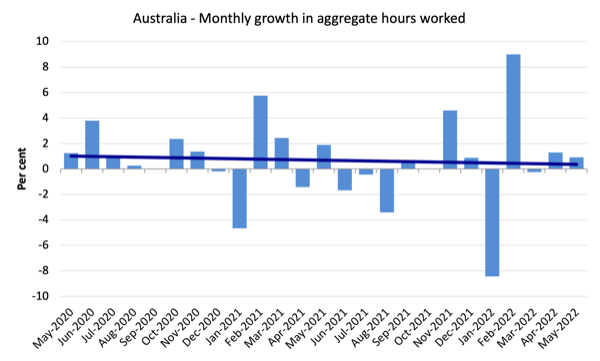
Hours worked rose by 17 million hours (0.9 per cent) in May 2022
The following graph shows the monthly growth (in per cent) over the last 24 months.
The dark linear line is a simple regression trend of the monthly change (skewed by the couple of outlier result).
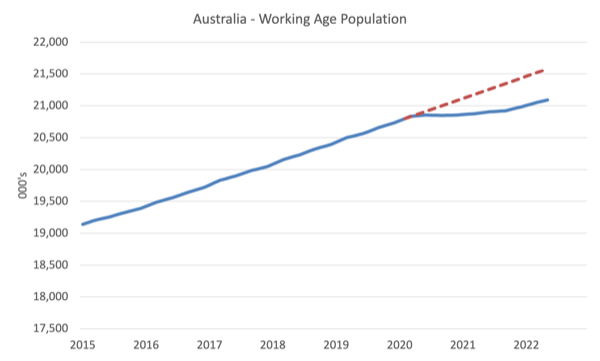
The Population Slowdown – the ‘What-if’ unemployment analysis
The following graph shows Australia’s working age population (Over 15 year olds) from January 2015 to May 2022. The dotted line is the projected growth had the pre-pandemic trend continued.
The difference between the lines is the decline in the working age population due to the Covid restrictions.
The civilian population is 487.7 thousand less in May 2022 than it would have been had pre-Covid trends continued.
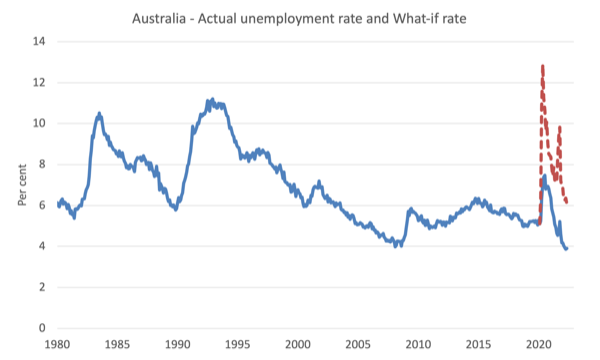
The following graph shows the evolution of the actual unemployment rate since January 1980 to May 2022 and the dotted line is the ‘What-if’ rate, which is calculated by assuming the most recent peak participation rate (recorded at February 2022 = 66.5 per cent), the extrapolated working age population (based on growth rate between 2015 and April 2020) and the actual employment since April 2020.
It shows what the unemployment rate would have been given the actual employment growth had the working age population trajectory followed the past trends.
In this blog post – External border closures in Australia reduced the unemployment rate by around 2.7 points (April 28, 2022), I provided detailed analysis of how I calculated the ‘What-if’ unemployment rate.
So instead of an unemployment rate of 3.9 per cent, the rate would have been 6.1 per cent in May 2022, given the employment performance since the pandemic.
This finding puts a rather different slant to what has been happening since the onset of the pandemic.
Unemployment rose by 7,800 to 544,100 persons in May 2022
Unemployment rose this month despite the strong employment growth because the participation rate pushed to a new peak bringing more workers into the labour force.
The official unemployment rate was 3.9 per cent. Also bear in mind the ‘What-if’ analysis above and the fall in participation (see below).
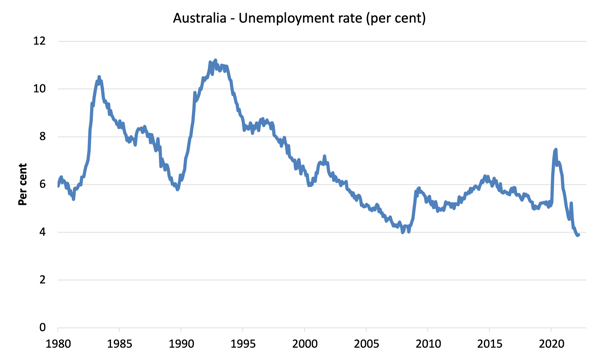
The following graph shows the national unemployment rate from April 1980 to May 2022. The longer time-series helps frame some perspective to what is happening at present.
Broad labour underutilisation decreased by 0.3 points to 9.6 per cent in May 2022
The results for May 2022 are (seasonally adjusted):
1. Underemployment decreased by 0.4 points to 5.7 per cent (a fall of 50.1 thousand) – this is the result of a rise in full-time work.
2. Overall there are 807.3 thousand underemployed workers.
3. The total labour underutilisation rate (unemployment plus underemployment) fell by 0.3 points to 9.6 per cent.
4. There were a total of 1355.5 thousand workers either unemployed or underemployed.
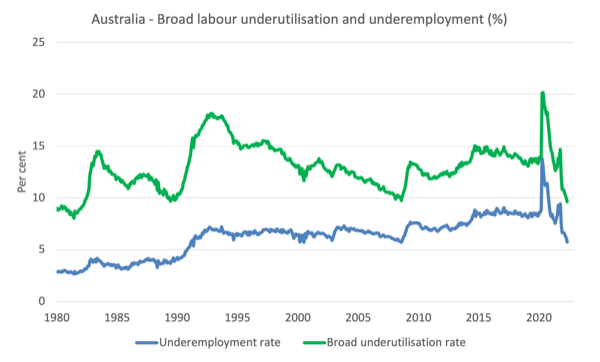
The following graph plots the seasonally-adjusted underemployment rate in Australia from April 1980 to the May 2022 (blue line) and the broad underutilisation rate over the same period (green line).
The difference between the two lines is the unemployment rate.
The three cyclical peaks correspond to the 1982, 1991 recessions and the more recent downturn.
The other difference between now and the two earlier cycles is that the recovery triggered by the fiscal stimulus in 2008-09 did not persist and as soon as the ‘fiscal surplus’ fetish kicked in in 2012, things went backwards very quickly.
The two earlier peaks were sharp but steadily declined. The last peak fell away on the back of the stimulus but turned again when the stimulus was withdrawn.
Teenage labour market much stronger in May 2022
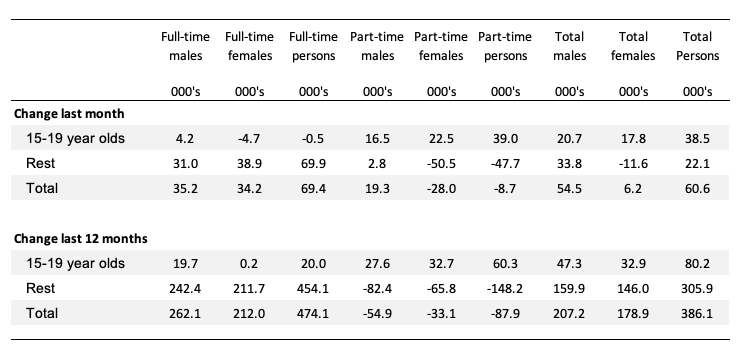
The following Table shows the distribution of net employment creation in the last month and the last 12 months by full-time/part-time status and age/gender category (15-19 year olds and the rest).
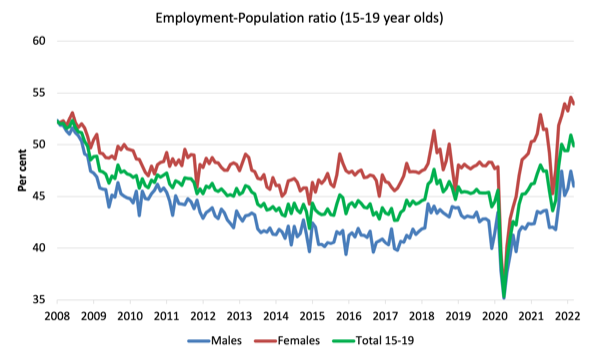
To put the teenage employment situation in a scale context (relative to their size in the population) the following graph shows the Employment-Population ratios for males, females and total 15-19 year olds since June 2008.
You can interpret this graph as depicting the loss of employment relative to the underlying population of each cohort.
1. The male ratio has fallen by 3.8 percentage points since April 2008. It rose 2.6 points over the month. It is now 5.1 points above its level in April 2020.
2. The female ratio is 4.1 percentage points above the April 2008 level. It rose 2.3 points over the month. It is now 8.4 points above its level in April 2020.
3. The overall teenage employment-population ratio has fallen by 0.1 percentage points since April 2008. It rose by 2.4 points over the month. It is now 6.7 points above its level in April 2020.
Conclusion
My standard monthly warning: we always have to be careful interpreting month to month movements given the way the Labour Force Survey is constructed and implemented.
My overall assessment is:
1. The labour market improved markedly in May after several months of weakness.
2. The robust full-time employment growth was a good sign as was the increasing participation rate. That particularly favoured the younger workers.
3. The official unemployment rate was unchanged but the underlying (‘What-if’) unemployment rate is closer to 6.1 per cent rather than the official rate of 3.9 per cent.
4. There are still 1,355.5 thousand Australian workers without work in one way or another (officially unemployed or underemployed). The only reason the unemployment rate is so low is because the underlying population growth remains low after the border closures over the last two years.
That is enough for today!
(c) Copyright 2022 William Mitchell. All Rights Reserved.
Hi Bill – does fiscal “tightening” i.e. raising taxes work to dampen inflation? After all, it means people have less disposable income.
Regards
Cue the next RBA rate rise to “stop wage growth from getting out of hand”.