The Australian Bureau of Statistics (ABS) released the latest labour force data today (June 19,…
US labour market showing further signs of slowdown
Last Friday (September 3, 2022), the US Bureau of Labor Statistics (BLS) released their latest labour market data – Employment Situation Summary – September 2022 – which reported a total payroll employment rise of only 315,000 jobs (a major slowdown) and an official unemployment rate rose 0.2 points to 3.7 per cent. The participation rate also rose (somewhat reversing last month’s decline) and the broad labour underutilisation rate (U6) rose by 0.3 points, largely due to the rise in unemployment. The other interesting aspect of this data is that real wages continued to decline in all industry sectors – they have systematically fallen each month since March 2022. I note some commentators are trying to claim that wage pressures are now pushing inflation. That conclusion is untenable given the data. The US labour market is still producing employment but it is hardly booming. Further, most of the net jobs created since the pandemic have gone to workers in occupatinos that pay above-median earnings.
Overview for August 2022 (seasonally adjusted):
- Payroll employment increased by 315,000.
- Total labour force survey employment rose by 442 thousand net (0.28 per cent).
- The labour force rose by 786 thousand net (0.48 per cent).
- The employment-population ratio rose by 0.1 points to 60 per cent on the back of a slowing working age population (still lower than the May 2020 peak of 61.2).
- Total measured unemployment rose by 344 thousand to 6,014 thousand.
- Official unemployment rate rose 0.2 points to 3.7 per cent.
- The participation rate rose by 0.3 points to 62.4 per cent.
- The broad labour underutilisation measure (U6) rose 0.3 points to 7 per cent.
For those who are confused about the difference between the payroll (establishment) data and the household survey data you should read this blog post – US labour market is in a deplorable state – where I explain the differences in detail.
Some months the difference is small, while other months, the difference is larger.
The differences were quite large this month.
Payroll employment trends
The BLS noted that:
Total nonfarm payroll employment increased by 315,000 in August. Nonfarm employment has risen by 5.8 million over the past 12 months, as the labor market continued to recover from the job losses of the pandemic-induced recession. This growth brings total nonfarm employment 240,000 higher than its pre-pandemic level in February 2020 …
Professional and business services added 68,000 jobs in August … Over the past 12 months, professional and business
services has added 1.1 million jobs.In August, health care employment rose by 48,000 … is below its February 2020 level by 37,000, or 0.2 percent.
Retail trade added 44,000 jobs in August and 422,000 jobs over the past 12 months …
Manufacturing employment continued to trend up in August (+22,000) … has added 461,000 jobs over the year.
Employment in financial activities rose by 17,000 in August and by 200,000 over the year.
Employment in wholesale trade increased by 15,000 in August, returning to its February 2020 level. This industry has added 197,000 jobs over the year.
Mining employment rose by 6,000 in August … Over the year, mining has added 68,000 jobs.
Employment in leisure and hospitality changed little in August … is below its February 2020 level by 1.2 million, or 7.2 percent.
In August, employment showed little change in other major industries, including construction, transportation and warehousing, information, other services, and government.
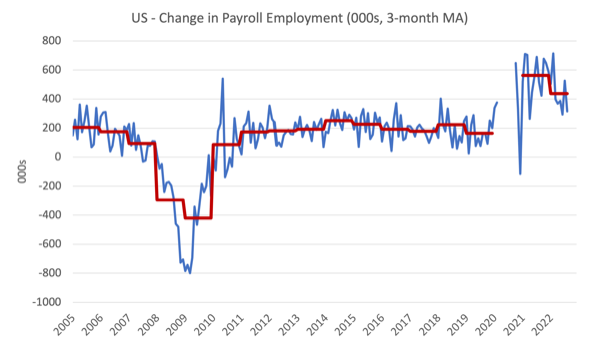
The first graph shows the monthly change in payroll employment (in thousands, expressed as a 3-month moving average to take out the monthly noise). The red lines are the annual averages. I left out the observations between January 2020 and September 2020, which were so extreme that they make it harder to compare the current period with the pre-pandemic history.
The US labour market has now exceeded the pre-pandemic level by 240 thousand jobs although the gains are not even across the sectors as detailed above.
See also the occupational analysis at the end of this post.
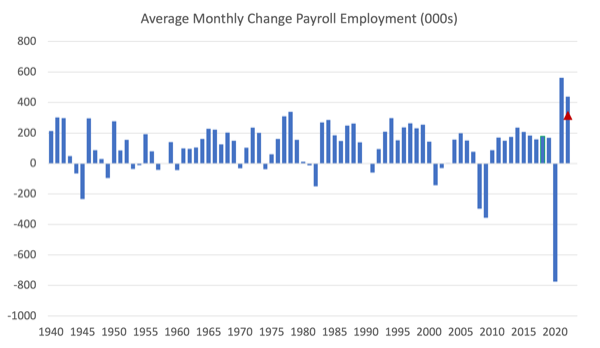
The next graph shows the same data in a different way – in this case the graph shows the average net monthly change in payroll employment (actual) for the calendar years from 2005 to 2021.
The red marker on the column is the current month’s result.
The final average for 2019 was 164 thousand.
The final average for 2020 was -774 thousand.
The final average for 2021 was 562 thousand.
The average so far in 2022 is 438 thousand and falling fast.
Labour Force Survey – employment growth declines
The seasonally-adjusted data for August 2022 reveals:
1. Total labour force survey employment rose by 442 thousand net (0.28 per cent).
2. The labour force rose by 786 thousand net (0.48 per cent).
3. The participation rate rose by 0.3 points to 62.4 per cent.
4. As a result (in accounting terms), total measured unemployment rose by 344 thousand to 6,014 thousand and the official unemployment rate rose by 0.2 points to 3.7 per cent.
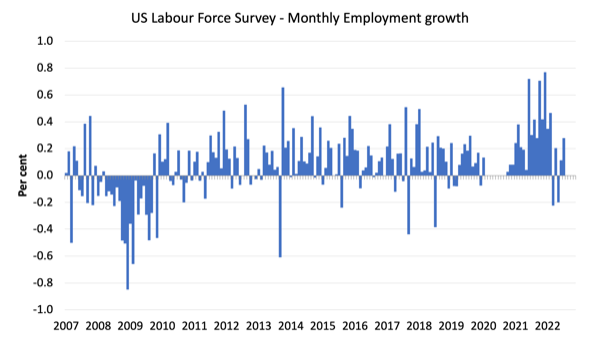
The following graph shows the monthly employment growth since January 2008 and excludes the extreme observations (outliers) between May 2020 and October 2020, which distort the current period relative to the pre-pandemic period.
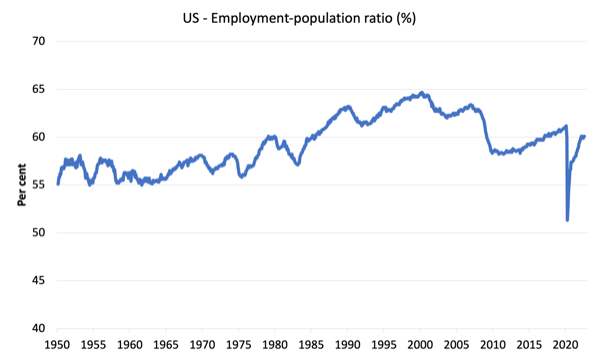
The Employment-Population ratio is a good measure of the strength of the labour market because the movements are relatively unambiguous because the denominator population is not particularly sensitive to the cycle (unlike the labour force).
The following graph shows the US Employment-Population from January 1950 to August 2022.
While the ratio fluctuates a little, the May 2020 ratio fell by 8.6 points to 51.3 per cent, which is the largest monthly fall since the sample began in January 1948.
In August 2022, the ratio rose by 0.1 points to 60.1 per cent on the back of a slowing working age population.
The peak level in May 2020 before the pandemic was 61.1 per cent.
Unemployment and underutilisation trends
The BLS note that:
In August, the unemployment rate rose by 0.2 percentage point to 3.7 percent, and the number of unemployed persons increased by 344,000 to 6.0 million. In July, these measures had returned to their levels in February 2020, prior to the coronavirus (COVID-19) pandemic. ….
The number of long-term unemployed (those jobless for 27 weeks or more) was little changed at 1.1 million in August. The long-term unemployed accounted for 18.8 percent of all unemployed persons …
The number of persons employed part time for economic reasons was little changed at 4.1 million in August. These individuals, who would have preferred full-time employment, were working part time because their hours had been reduced or they were unable to find full-time jobs …
The reasons the unemployment rate rose in August were:
1. The change in the labour force outstripped the rise in employment.
2. The former was, in part, due to the rise in the participation rate (reversing some of last month’s decline)
The first graph shows the official unemployment rate since January 1994.
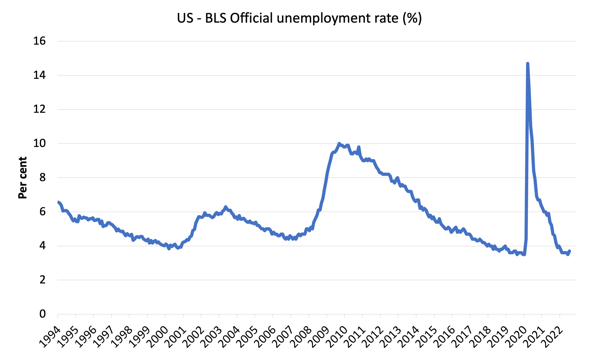
The official unemployment rate is a narrow measure of labour wastage, which means that a strict comparison with the 1960s, for example, in terms of how tight the labour market, has to take into account broader measures of labour underutilisation.
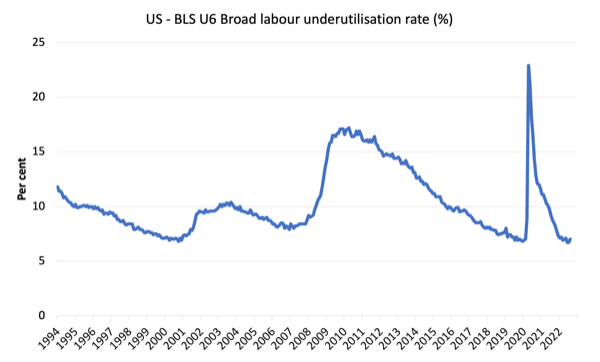
The next graph shows the BLS measure U6, which is defined as:
Total unemployed, plus all marginally attached workers plus total employed part time for economic reasons, as a percent of all civilian labor force plus all marginally attached workers.
It is thus the broadest quantitative measure of labour underutilisation that the BLS publish.
Pre-COVID, U6 was at 6.8 per cent (December 2019).
In August 2022 the U6 measure was 7 per cent, an increase of 0.3 points.
While workers forced to work part-time for economic reasons – which is the US indicator of underemployment – was stable, the rise in U6 was down to the rise in official unemployment.
What are wages doing in the US?
With inflation rising sharply at present and the Federal Reserve pretending there is a major wage problem that needs to be disciplined with rising mass unemployment, one would expect to see strong nominal wages growth pushing the price level along.
The BLS reported that:
In August, average hourly earnings for all employees on private nonfarm payrolls rose by 10 cents, or 0.3 percent, to $32.36. Over the past 12 months, average hourly earnings have increased by 5.2 percent. In August, average hourly earnings of private-sector production and nonsupervisory employees rose by 10 cents, or 0.4 percent, to $27.68.
However, the latest – BLS Real Earnings Summary (published August 10, 2022) – tells us that:
Real average hourly earnings for all employees increased 0.5 percent from June to July, seasonally adjusted … This result stems from an increase of 0.5 percent in average hourly earnings combined with no change in the Consumer Price Index for All Urban Consumers (CPI-U).
Real average weekly earnings increased 0.5 percent over the month due to the change in real average hourly earnings combined with no change in the average workweek.
Real average hourly earnings decreased 3.0 percent, seasonally adjusted, from July 2021 to July 2022. The change in real average hourly earnings combined with a decrease of 0.6 percent in the average workweek resulted in a 3.6-percent decrease in real average weekly earnings over this period.
Facts:
1. Since March 2022, the growth rate in average hourly earnings has been systematically declining.
2. The declining growth rate is well below the inflation rate.
3. Wages growth is not driving the supply-side inflation acceleration.
4. Workers are not catching up with the price level rises and can hardly be said to be pressuring inflation.
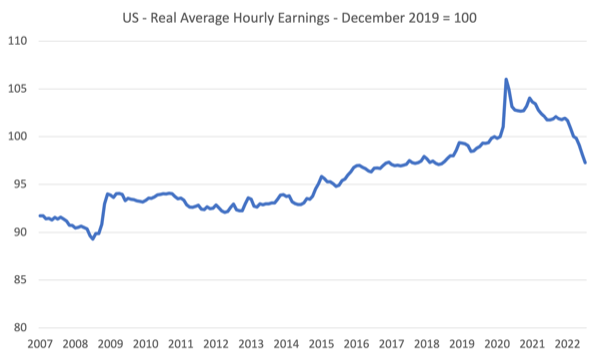
The following graph shows movements in real average hourly earnings (indexed at 100 at December 2019) up to August 2022 tells the story.
The spike in the early period of the pandemic was the result of hours adjustments rather than earnings growth.
And, from the latest – Productivity and Costs, Second Quarter 2022, Revised (published September 1, 2022) – report, we find that:
Nonfarm business sector labor productivity decreased 4.1 percent in the second quarter of 2022 … as output decreased 1.4 percent and hours worked increased 2.7 percent … From the same quarter a year ago, nonfarm business sector labor productivity decreased 2.4 percent. This is the largest decline in the series, which begins in the first quarter of 1948.
Even though productivity growth slumped in the first two quarters of 2022, real hourly earnings growth continues to lag behind productivity growth over a longer period.
Workers have gained hardly any real wages growth since 1970 (rising by just 5.7 per cent) whereas productivity growth has risen by 162 per cent.
There has been a massive redistribution of national income away from workers towards profits over this long period.
US capitalism is badly broken.
Special analysis this month – Occupational employment and earnings growth
Inflation mania is loose now and the economic media can’t stop comparing this period to the 1970s.
Two things happened in that decade relevant to the issue: (a) trade unions were able to push wages up very quickly; (b) OPEC was able to push up oil prices dramatically.
The second is happening at present.
But the first?
Is there any evidence that wages growth was breaking out, which might propagate an inflationary spiral on the back of the supply-side pressures at the moment?
I decided to update my understanding of what is happening at the occupational level, given we now have data for the fourth-quarter 2022. There is detailed data for full-time, wage and salary earners.
Using this data, we find considerable diversity in outcomes both within the occupational categories (the sub-aggregates) and between the categories.
Note that:
1. Management, professional and related occupations encompasses Management, business, and financial operations occupations and Professional and related occupations.
2. Sales and office occupations encompasses Sales and related occupations and Office and administrative support occupations.
3. Natural resources, construction, and maintenance occupations encompasses Farming, fishing, and forestry occupations and Construction and extraction occupations and Installation, maintenance, and repair occupations
4. Production, transportation, and material moving occupations encompasses Production occupations and Transportation and material moving occupations.
Within each of these aggregates there is occupational diversity in terms of median weekly earnings.
For example, within aggregate (3), the Farming, fishing, and forestry occupations are classified as low-pay, while the Installation, maintenance, and repair occupations are above-average.
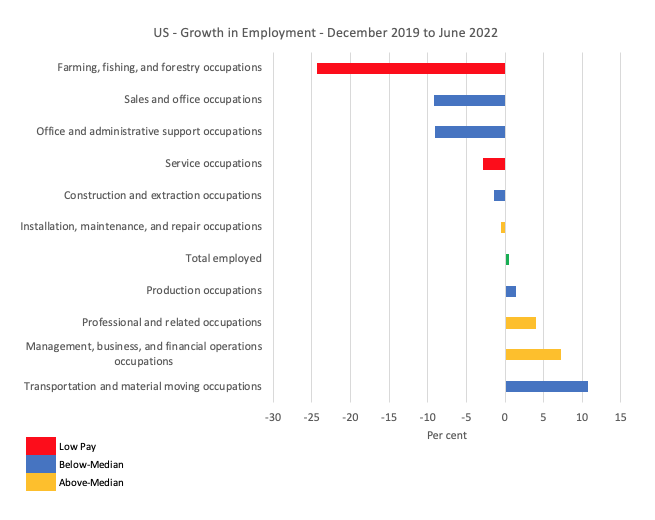
The first graph shows the growth in employment between December 2019 (the peak before the pandemic) and June 2022 by the sub-occupational categories.
The colour codes denote above-median (gold), below-median (blue) and within the latter category, low-pay (red), which is below 75 per cent of the Median weekly earnings. The green bar is the Economy-wide median weekly earnings.
Overall, as at June 2022, the labour market is now 601 thousand full-time, wage and salary earner jobs above of where it was in December 2019 (up 0.5 per cent).
Some occupations have fared well over this period in terms of employment growth, while others have endured devastating employment losses.
Overall the employment losses have been concentrated at the low-pay end of the labour market.
1. Total net jobs gained – 601 thousand.
2. Above-Median earnings – gained 2,696 thousand (net) jobs.
3. Below-Median earnings – lost 1,411 thousand (net) jobs.
3. Low-pay – lost 685 thousand (net) jobs (48.5 per cent of the Below-Median job losses).
The next graph captures how the occupational composition of the labour market has shifted during the pandemic to date.
It helps us to understand relative scales (importance of each occupational category in total jobs)
The blue bars show the actual employment change for each occupational category between December 2019 and June 2022, while the red bars show what the employment change would have been if the categories had have shared in the total employment change over this period according to their December 2019 shares in total employment.
The difference between the bars tells you the extent to which their has been a shift in the composition.
The real issue relates to the relative damage done to the low-pay service workers and the gains made by the high-paid workers in management, business and financial occupations.
The other lower occupational groups at the lower-end of the Below-Median group also lost more jobs that their 2019 shares would have indicated.

The next graph shows the growth in nominal and real Median weekly earnings between December 2019 and June 2022 for the occupational categories.
Overall, there was a 11.2 per cent growth in nominal Median weekly earnings over this period and a reduction in real earnings by 4.1 per cent, although there has been considerable diversity across the occupational distribution with no clear pattern.
The CPI grew by 15.3 per cent over the period.
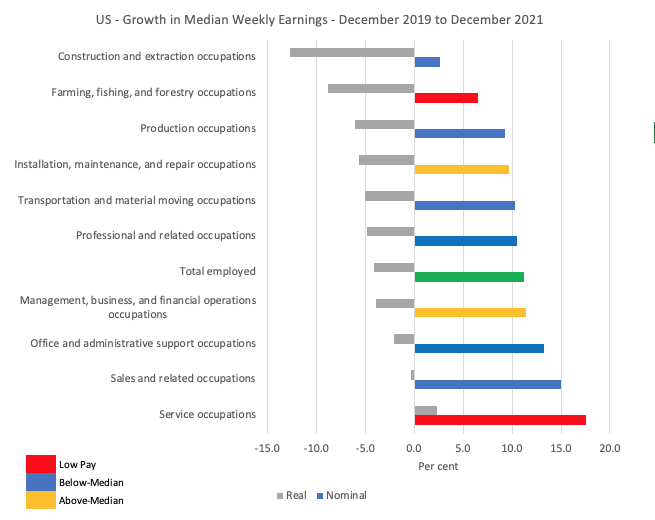
If we compare the two series (employment and earnings) the situation is far from straightforward.
For example, even though the ‘Transportation and Material Moving’ workers have done very well in terms of full-time employmen growth, they have not translated that into real wages growth, whereas the ‘Sales and Service occupations’ (generally) have lost jobs but secured some real wages growth.
It is clear that overall, real wages are falling.
But I cannot yet see the consistent emergence of the propagating mechanisms that will turn the supply shocks into a persistent wage-price spiral (like what happened in the 1970s).
Conclusion
In August 2022, the US labour market showed signs of slowing further, with payroll employment growing by just 315,000 net jobs and being outstripped by labour force growth.
This pushed up official unemployment and the unemployment rate rose by 0.2 points to 3.7 per cent.
There are no fundamental wage pressures emerging at present despite the spikes in inflation arising from supply chain constraints.
Real wages fell for the fifth consecutive month.
And most of the net jobs created since the pandemic have gone to workers in occupations that pay above-median earnings.
That is enough for today!
(c) Copyright 2022 William Mitchell. All Rights Reserved.
Wouldn’t it be a good thing if people previously employed in low paid sectors are now working in higher paid employment? Or are you saying that just isn’t the case? I just don’t understand why you point this out as if it is a bad thing.
This is clearly a key sentence: ‘The real issue relates to the relative damage done to the low-pay service workers and the gains made by the high-paid workers in management, business and financial occupations.’ We need more service workers, but an alteration in their low pay and status ranking. If some of them move into employment currently much higher paid, then fine, but we don’t need the growth in jobs and wages to come in already highly paid management, business and particularly finance, or growth in the share of income extracted by shareholders and banks.
Re: ‘workers in occupatinos’, I confess my first thought was that this was a new word to me specific to US employment.
Lending by the banks is inflationary. Lending by the nonbanks is noninflationary (other things equal).
Rather than bottling up existing savings, the monetary authorities should pursue every possible means for promoting the orderly and continuous flow of monetary savings into real investment.
@Jerry Brown – have you read much of Bill’s stuff? It’s about the ongoing drift of wealth, from the greater numbers of productive workers, to the smaller numbers of generally less productive employees.
It would be fair to say that I have read quite a bit of what Bill has published. And I would say that very little of what I have read is about higher paid employees being less productive. Which is good because it is probably not true that higher paid employees are less productive than lower paid employees in general. Mostly Bill advocates for higher wages for workers. The usual observation is that ‘Capital’ (not other employees) has increased its share of income (profit) and that workers have not benefitted from increases in labor productivity as a result.
My question was about the statement “And most of the net jobs created since the pandemic have gone to workers in occupations that pay above-median earnings” and whether that was in actuality a good thing. Because it certainly seems to be a good thing as far as I can tell. Higher paying jobs are better than lower paying jobs. Especially for the workers doing them.
I’ve come to believe that the real reason the Fed is engineering a recession is to crush budding labor activism. After all, I don’t know if you’ve seen this, but the powers that be are trying to create an idea of “quiet quitting.” As far as I can tell, this phrase means “doing what you’re expected to do, and no more.” Point being, it seems that US elites are actually concerned about increasing chatter about unions and workers’ rights.