Today (March 6, 2024), the Australian Bureau of Statistics released the latest - Australian National…
Australia National Accounts – growth continues at a moderating pace
The Australian Bureau of Statistics released the latest – Australian National Accounts: National Income, Expenditure and Product, September 2022 – today (December 7, 2022), which shows that the Australian economy grew by 0.6 per cent in the September-quarter 2022 and by 5.9 per cent over the 12 months to the end of September 2022. Growth is being driven largely by continued growth in household spending (which has not yet succumbed to the cost of living squeeze exacerbated by the interest rate rises). There was a modest contribution from private capital formation. The terms of trade declined sharply signalling a negative contribution from net exports and declining real net national living standards. There was growth in employee compensation (the wage measure from the national accounts) of 3.2 per cent but that was largely due to administrative decisions (for example, minimum wage increases) that impacted in this quarter rather than being the result of market pressures.
The main features of the National Accounts release for the September-quarter 2022 were (seasonally adjusted):
- Real GDP increased by 0.6 per cent for the quarter (down from 0.9 per cent last quarter). The annual growth rate was 5.9 per cent
- Australia’s Terms of Trade (seasonally adjusted) fell by 6.6 per cent (down from +4.8 per cent in the quarter and by -0.3 per cent over the 12 month period.
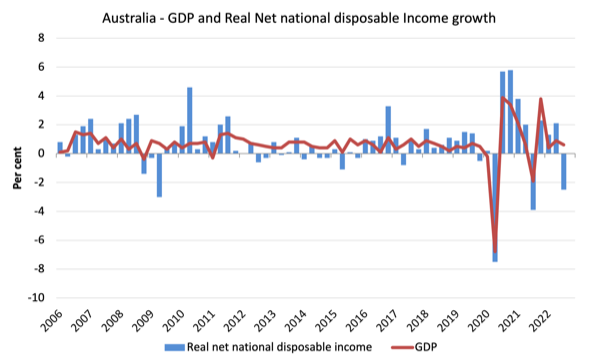
- Real net national disposable income, which is a broader measure of change in national economic well-being, fell by 2.5 per cent for the quarter but rose by 3.2 over the 12 months, which means that Australians are better off (on average) than they were at that point 12 months ago but worse off than they were 3 months ago.
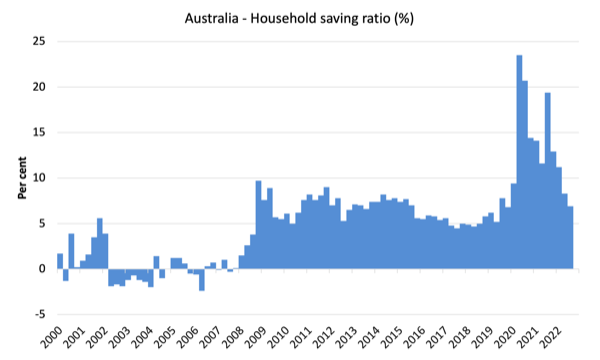
- The Household saving ratio (from disposable income) fell from 8.3 per cent to 6.9 per cent.
Overall growth picture – growth continues at slower rate
The ABS – Media Release – said that:
The September quarter was the fourth consecutive quarter of economic growth, following a contraction in the September quarter 2021, which was impacted by the COVID-19 Delta outbreak …
Household spending rose 1.1 per cent for the quarter, contributing 0.6 percentage points to GDP. Growth was driven by spending on Hotels, cafes and restaurants (up 5.5 per cent), Transport services (up 13.9 per cent) and Purchase of vehicles (up 10.1 per cent). …
Households continued to increase spending on domestic and international travel as COVID-19 travel restrictions continued to ease …
The household saving to income ratio fell for the fourth consecutive quarter (from 8.3 per cent to 6.9 per cent) as increases in household spending outpaced household income growth …
Net trade detracted 0.2 percentage points from GDP, with a 2.7 per cent increase in exports offset by a 3.9 per cent rise in imports …
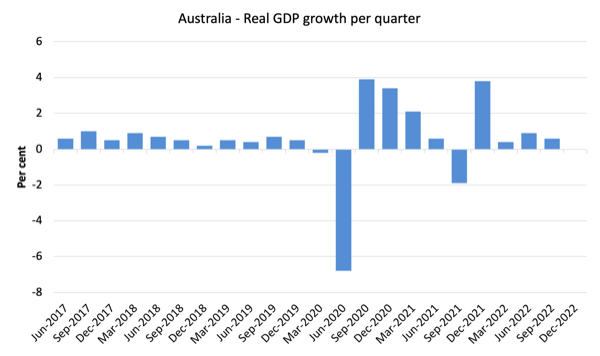
The first graph shows the quarterly growth over the last five years.
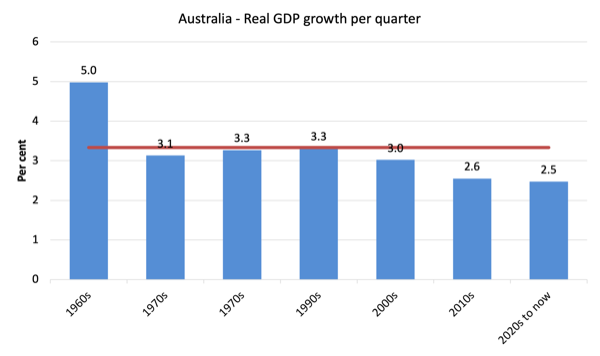
To put this into historical context, the next graph shows the decade average annual real GDP growth rate since the 1960s (the horizontal red line is the average for the entire period (3.3 per cent) from the September-quarter 1960 to the September-quarter 2022).
The 2020-to-now average has been dominated by the pandemic.
But, it is also obvious how far below historical trends the growth performance of the last 2 decades have been as the fiscal surplus obsession has intensified on both sides of politics.
Even with a massive household credit binge and a once-in-a-hundred-years mining boom that was pushed by stratospheric movements in our terms of trade, our real GDP growth has declined substantially below the long-term performance.
The 1960s was the last decade where government maintained true full employment.
Analysis of Expenditure Components – Consumption and Exports
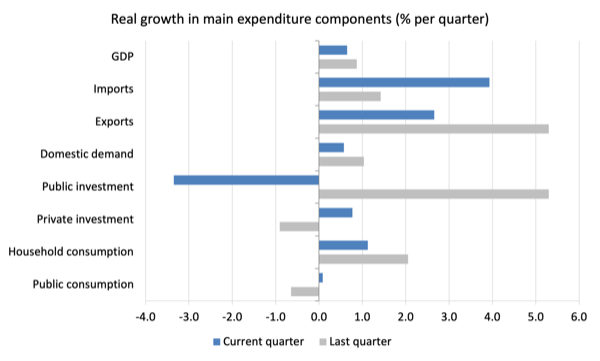
The following graph shows the quarterly percentage growth for the major expenditure components in real terms for June-quarter 2022 (grey bars) and the September-quarter 2022 (blue bars).
Points to note for the September-quarter:
1. Household Consumption expenditure rose by 1.1 per cent (down from 2.1 per cent).
2. General government consumption expenditure rose by 0.1 per cent (up from -0.65 per cent) but was 3.3 per cent higher over the 12 months.
3. Private investment expenditure growth rose by 0.8 per cent (ip from -0.9 per cent). Over the year, it fell by 0.3 per cent.
4. Public investment fell by 3.35 per cent (down from 5.3 per cent).
5. Export expenditure rose by 2.6 per cent (down from 5.3 per cent). Imports growth was just 3.93 per cent (up from 1.4 per cent) – lots of international travel.
Contributions to growth
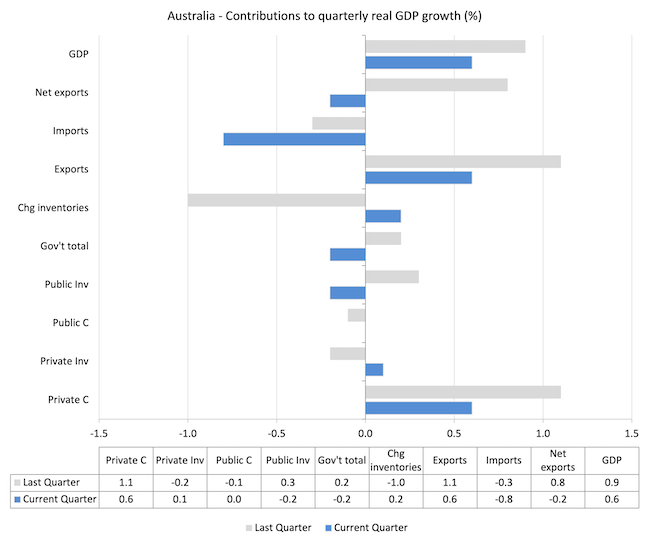
What components of expenditure added to and subtracted from the 0.8 per cent rise in real GDP growth in the September-quarter 2022?
The following bar graph shows the contributions to real GDP growth (in percentage points) for the main expenditure categories. It compares the September-quarter 2022 contributions (blue bars) with the December-quarter 2021 (gray bars).
In no order:
1. Household consumption expenditure added 0.6 points to the overall growth rate of 0.6 per cent (down from 1.1 points).
2. Public Investment subtracted 0.2 points (after adding 0.3 points last quarter).
3. Growth in inventories added 0.2 points (after subtracting 1 point last quarter).
4. Private investment expenditure added 0.1 points (after subtracting 0.2 points last quarter).
5. Public consumption added nothing this quarter after subtracting 0.1 points last quarter. Overall, the government sector reduced growth by 0.2 points (after adding 0.2 points last quarter).
5. Net exports reduced growth by 0.2 points with exports (0.6 points) being more than offset by imports (-0.8 points) – remember imports are a drain on expenditure.
Material living standards fell in September-quarter
The ABS tell us that:
A broader measure of change in national economic well-being is Real net national disposable income. This measure adjusts the volume measure of GDP for the Terms of trade effect, Real net incomes from overseas and Consumption of fixed capital.
While real GDP growth (that is, total output produced in volume terms) rose by 0.6 per cent in the September-quarter, real net national disposable income growth fell by 2.5 per cent.
How do we explain that?
Answer: The terms of trade fell by 6.6 per cent for the quarter, which according to the ABS is the “largest fall since June quarter 2009, as import prices increased and export prices fell.”
Export prices fell because of declining demand for iron ore and other mineral commodities.
The following graph shows the evolution of the quarterly growth rates for the two series since the September-quarter 2006.
Household saving ratio fell by 1.4 points to 6.9 per cent
The ABS noted that:
The household savings ratio continued to decline this quarter, moving towards pre COVID-19 pandemic levels. Higher levels of spending and increases in interest payable on dwellings detracted from household saving compared to the June quarter …
So households are maintaining growth in consumption expenditure by reducing their saving rate.
The following graph shows the household saving ratio (% of disposable income) from the September-quarter 2000 to the current period. It shows the period leading up to the GFC, where the credit binge was in full swing and the saving ratio was negative to the rise during the GFC and then the most recent rise.
The current position is that households are being squeezed by a combination of rising living costs and interest rates and flat wages growth, which is driving a gap between income and expenditure.
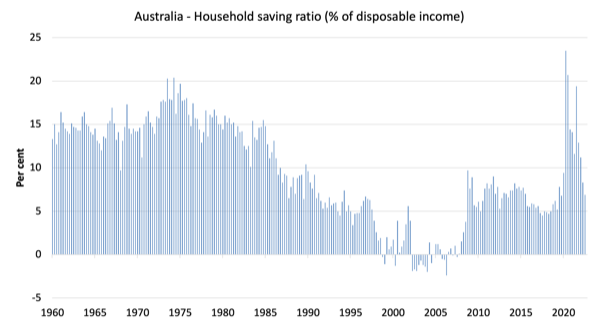
While the saving ratio might appear to be still very high, if we take a longer term view of it, the behaviour is less ‘historic’ than we might think.
The next graph shows the household saving ratio (% of disposable income) from the September-quarter 1960 to the current period.
Back in the full employment days, when governments supported the economy and jobs with continuous fiscal deficits (mostly), households saved significant proportions of their income.
In the neoliberal period, as credit has been rammed down their throats, the saving rate dropped (to negative levels in the lead-up to the GFC).
Hopefully, households are paying off the record levels of debt they are now carrying and improving their financial viability.
div style=”clear:both;”>
The following table shows the impact of the neoliberal era on household saving. These patterns are replicated around the world and expose our economies to the threat of financial crises much more than in pre-neoliberal decades.
The result for the current decade (2020-) is the average from March 2020.
| Decade | Average Household Saving Ratio (% of disposable income) |
| 1960s | 14.4 |
| 1970s | 16.2 |
| 1980s | 12.0 |
| 1990s | 5.1 |
| 2000s | 1.4 |
| 2010s | 6.4 |
| 2020- | 13.9 |
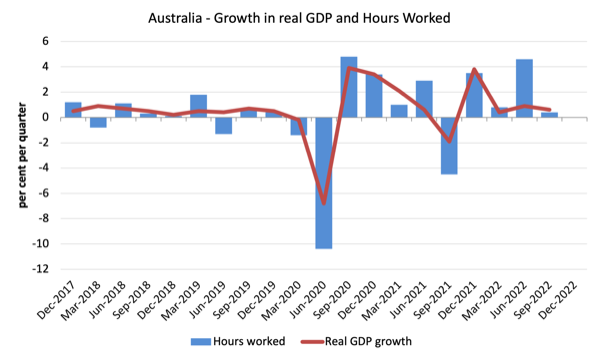
Real GDP growth rose by more than working hours – resulting in a rise in labour productivity growth
The following graph presents quarterly growth rates in real GDP and hours worked using the National Accounts data for the last five years to the September-quarter 2021.
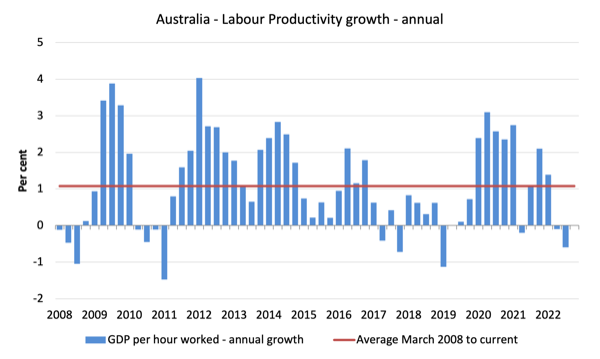
To see the above graph from a different perspective, the next graph shows the annual growth in GDP per hour worked (labour productivity) from the September-quarter 2008 quarter to the September-quarter 2022. The horizontal red line is the average annual growth since September-quarter 2008 (1.1 per cent), which itself is an understated measure of the long-term trend growth of around 1.5 per cent per annum.
The relatively strong growth in labour productivity in 2012 and the mostly above average growth in 2013 and 2014 helps explain why employment growth was lagging given the real GDP growth. Growth in labour productivity means that for each output level less labour is required.
The data shows that real output rose by 0.6 per cent, while hours worked rose by 0.4 per cent during the September-quarter.
The result is that GDP per hours worked rose by 0.6 per cent for the quarter but fell 0.6 per cent over the 12 months.
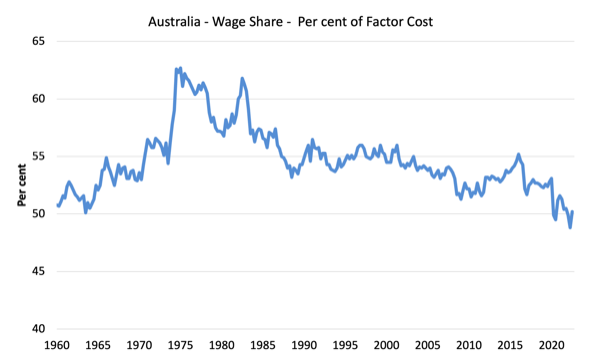
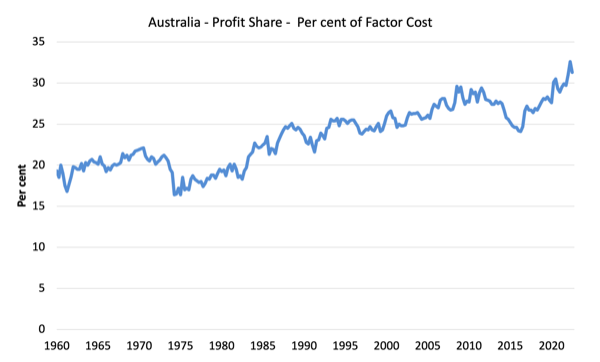
The distribution of national income – minor shift towards wages as mining profits fall
The wage share in national income rose by 1.4 points to 50.2 per cent while the profit share fell by 0.9 points largely as a result of declining terms of trade (mining profits are down on the fall in primary commodity prices).
But as the following graphs show, this shift is minor in the face of the recent trends.
The first graph shows the wage share in national income while the second shows the profit share.
The declining share of wages historically is a product of neoliberalism and will ultimately have to be reversed if Australia is to enjoy sustainable rises in standards of living without record levels of household debt being relied on for consumption growth.
Conclusion
Remember that the National Accounts data is three months old – a rear-vision view – of what has passed and to use it to predict future trends is not straightforward.
The data tells us that after the initial rebound from the lockdowns, growth continued to be moderate in the September-quarter and was driven by domestic demand – largely household consumption expenditure.
Over the last three months, material living standards overall fell as the booming terms of trade went into reverse.
Households are now saving less relative to their disposable income in an effort to maintain consumption growth in the face of rising interest rates and temporary inflationary pressures.
There is little in this data that to suggest the RBA interest rate hikes are stifling demand – as yet. The only sign is that there were “declining house sales and auction clearance rates” in the September-quarter.
That is enough for today!
(c) Copyright 2022 William Mitchell. All Rights Reserved.
Hi Bill
A technical question if you have time or a blog link:
as wage share and profit share do not add up to 100%, what are the other element(s) of the “factor cost”?
Anthony
Saving.
When you compare the decades and how people save has changed over time, does this need to be captured ?
The different products banks have introduced over time include a mixture of stocks and bonds savings portfolios. The bond part will be captured in the national debt figures but what about the stocks part.
There must be trillions sitting in these vehicles world wide that is not captured by any sectoral balances chart. It must surely be the case nowadays that portfolio managers who look after this type of saving move stock markets around the world as they balance risk between stocks and bonds.
My guess is over the last 2 years national debt figures increased across the board as stocks plummeted. As portfolio managers moved out of stocks and into bonds. So is the sectoral balances chart still as useful as it was before these saving products were introduced ?
Dear Derek Henry (at 2022/12/07 at 6:43 pm)
When you talk about the “trillions sitting in these vehicles” you are referring to stocks of wealth.
They are not captured by the sectoral balances framework because that is an analytical representations of flows.
A correct stock-flow consistent analysis however would allow us to link the two different perspectives.
But the point is that you cannot compare oranges with apples.
best wishes
bill
Thanks Bill
Not really comparing just capturing. Using A correct stock-flow consistent analysis allowing us to link the two different perspectives would be very useful to complete the bigger picture.
Don’t know how factual it was but I read somewhere recently that there is between 50 – 70 trillion sitting in these types of saving portfolios. It made me think about the mainstream view of how they explain the best way to reduce the national debt. I wondered if they actually took any of this into account, as when the economy is healthy and humming along and risk attitudes change out of bonds and into stocks. The debt would naturally reduce as the economy grows as risk attitudes change.
Just how big a part do portfolio managers actually play in the scheme of things nowadays. Especially when they all suffer from the same GROUPTHINK and all act in a very similar way when balancing risk for their customers.