Today (April 18, 2024), the Australian Bureau of Statistics released the latest - Labour Force,…
Australian labour force – stronger employment growth defying RBA interest rate hikes
The Australian Bureau of Statistics (ABS) released of the latest labour force data today (December 15, 2022) – Labour Force, Australia – for November 2022. The labour market continued to improve in November 2022 with employment rising relatively strongly by 64,000 (0.5 per cent) on the back of strong full-time and part-time employment growth. The participation rate also rose by 0.2 points, which meant the change in the labour force was larger than the change in employment, and as a consequence, official unemployment rose. There is some evidence that more people are taking on extra work to cope with the cost-of-living pressures. While all this suggests a fairly tight labour market, the underlying (‘What-if’) unemployment rate is closer to 5.1 per cent rather than the official rate of 3.4 per cent. There are still 1,325.5 thousand Australian workers without work in one way or another (officially unemployed or underemployed). The only reason the unemployment rate is so low is because the underlying population growth remains low after the border closures over the last two years. But that is changing as immigration increases.
The summary ABS Labour Force (seasonally adjusted) estimates for November 2022 are:
- Employment increased by 64,000 (0.5 per cent) – full-time employment increased by 34,200 and part-time employment increased by 29,800.
- Unemployment rose 7.4 thousand to 491.7 thousand persons.
- The official unemployment rate was largely unchanged at 3.4 per cent.
- The participation rate rose 0.2 points to 66.8 per cent – back to the record high level.
- The employment-population ratio rose 0.1 point to 64.3 per cent.
- Aggregate monthly hours fell by 8.5 million hours (-0.45 per cent).
- Underemployment fell by 0.2 points to 5.8 per cent (a fall of 15.7 thousand). Overall there are 829.8 thousand underemployed workers. The total labour underutilisation rate (unemployment plus underemployment) fell 0.1 points 9.3 per cent. There were a total of 1321.5 thousand workers either unemployed or underemployed.
In its – Media Release – the ABS noted that:
The participation rate increased by 0.2 percentage points to 66.8 per cent in November, returning to the record high we saw in June 2022. It was 1.0 percentage point higher than before the pandemic …
The employment growth in November is consistent with other labour market indicators showing continuing growth through 2022, such as payroll jobs data. Along with the continued strength in employment, hours worked are also well above pre-pandemic levels …
Despite the relatively strong growth in hours worked during 2022, there continued to be a higher than usual number of people working reduced hours due to illness …
In November, we saw the number of people working reduced hours due to illness increasing by 50,000, back over half a million people (520,000), which is still around a third higher than we usually see at this time of the year …
Conclusion: strengthening employment growth and rising participation are defying the RBA’s interest rate hikes.
However, there is some evidence that people are taking on multiple jobs to deal with the cost-of-living pressures.
Employment increased by 64,000 (0.5 per cent) in November 2022
1. Full-time employment increased by 34,200 and part-time employment increased by 29,800.
2. The employment-population ratio rose 0.2 points to 64.5 per cent.
3. Employment in Australia is 782.6 thousand (net) jobs (6 per cent) above the pre-pandemic level in February 2020.
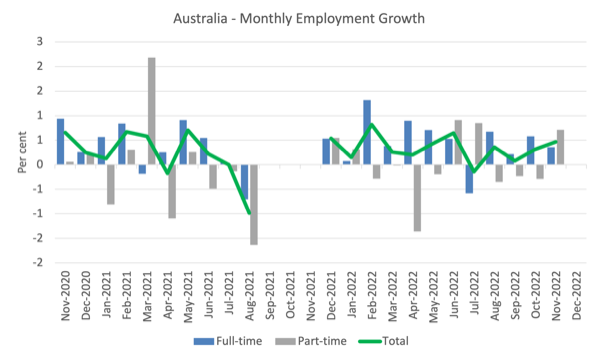
The following graph shows the month by month growth in full-time (blue columns), part-time (grey columns) and total employment (green line) for the 24 months to November 2022 using seasonally adjusted data.
I took out the observations from September to December 2021 – they were outliers due to the Covid wave at that time.
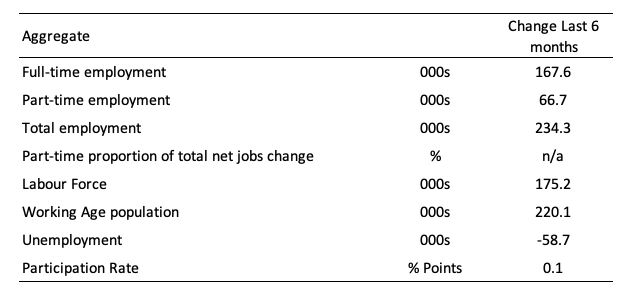
The following table provides an accounting summary of the labour market performance over the last six months to provide a longer perspective that cuts through the monthly variability and provides a better assessment of the trends.
Given the variation in the labour force estimates, it is sometimes useful to examine the Employment-to-Population ratio (%) because the underlying population estimates (denominator) are less cyclical and subject to variation than the labour force estimates. This is an alternative measure of the robustness of activity to the unemployment rate, which is sensitive to those labour force swings.
The following graph shows the Employment-to-Population ratio, since January 2008 (that is, since the GFC).
The ratio ratio rose 0.2 points to 64.5 per cent in November 2022 – a new record high.

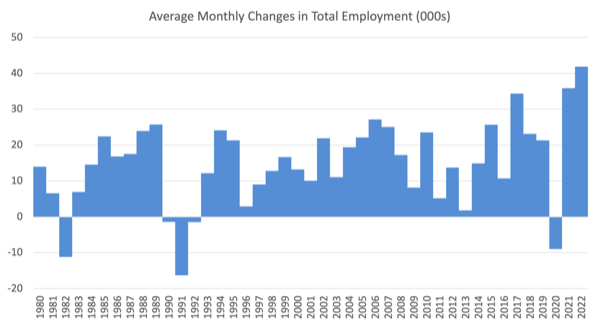
For perspective, the following graph shows the average monthly employment change for the calendar years from 1980 to 2022 (to date).
1. The average employment change over 2020 was -9 thousand which rose to 35.9 thousand in 2021 as the lockdowns eased.
3. So far in 2022, the average monthly change is 41.8 thousand.
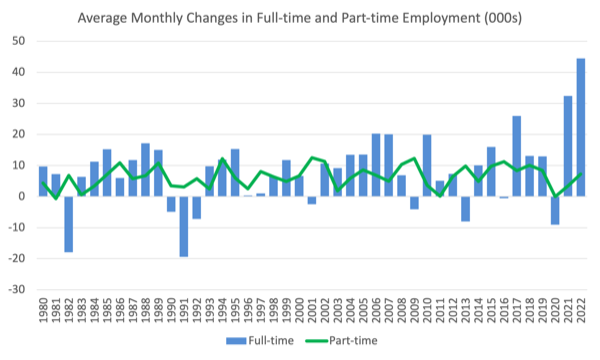
The following graph shows the average monthly changes in Full-time and Part-time employment (lower panel) in thousands since 1980.
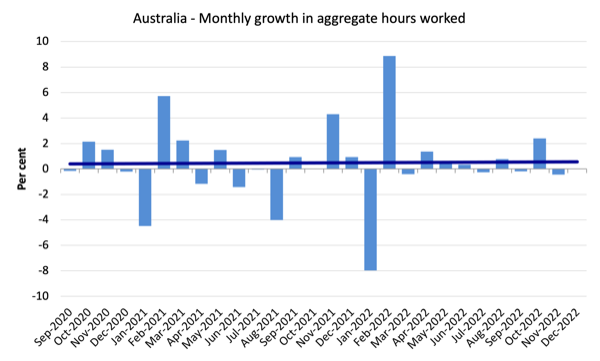
Hours worked fell by 8.5 million hours (-0.45 per cent) in November 2022
The following graph shows the monthly growth (in per cent) over the last 24 months.
The dark linear line is a simple regression trend of the monthly change (skewed by the couple of outlier results).
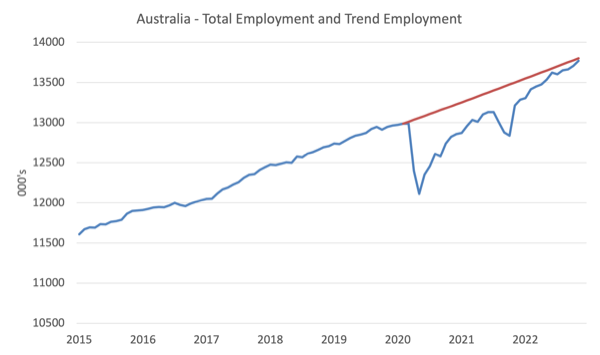
Actual and Trend Employment
The Australian labour market is now larger than it was in February 2020 and employment is now close to returning to the pre-pandemic trend
The following graph shows total employment (blue line) and what employment would have been if it had continued to grow according to the average growth rate between 2015 and April 2020.
In November 2022, the gap fell by 38.6 thousand to just 32.1 thousand jobs.
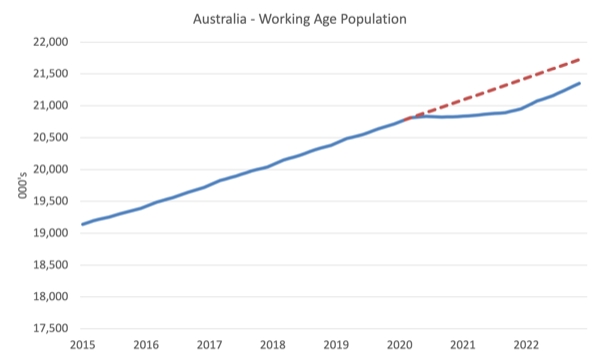
The Population Slowdown – the ‘What-if’ unemployment analysis
The following graph shows Australia’s working age population (Over 15 year olds) from January 2015 to November 2022. The dotted line is the projected growth had the pre-pandemic trend continued.
The difference between the lines is the decline in the working age population that followed the Covid restrictions on immigration.
The civilian population is 378.1 thousand less in November 2022 than it would have been had pre-Covid trends continued.
But the gap is closing as the border restrictions are gone.
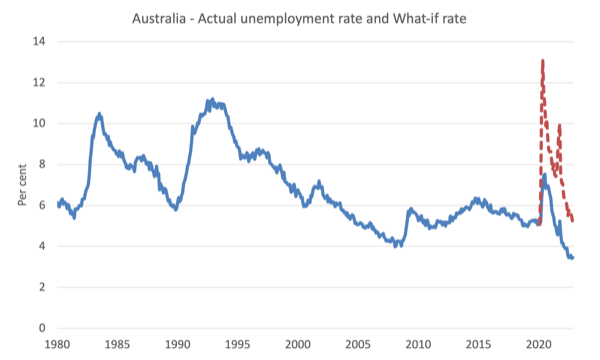
The following graph shows the evolution of the actual unemployment rate since January 1980 to November 2022 and the dotted line is the ‘What-if’ rate, which is calculated by assuming the most recent peak participation rate (recorded at November 2022 = 66.8 per cent), the extrapolated working age population (based on growth rate between 2015 and February 2020) and the actual employment since February 2020.
It shows what the unemployment rate would have been given the actual employment growth had the working age population trajectory followed the past trends.
In this blog post – External border closures in Australia reduced the unemployment rate by around 2.7 points (April 28, 2022), I provided detailed analysis of how I calculated the ‘What-if’ unemployment rate.
So instead of an unemployment rate of 3.4 per cent, the rate would have been 5.1 per cent in November 2022, given the employment performance since the pandemic.
This finding puts a rather different slant to what has been happening since the onset of the pandemic.
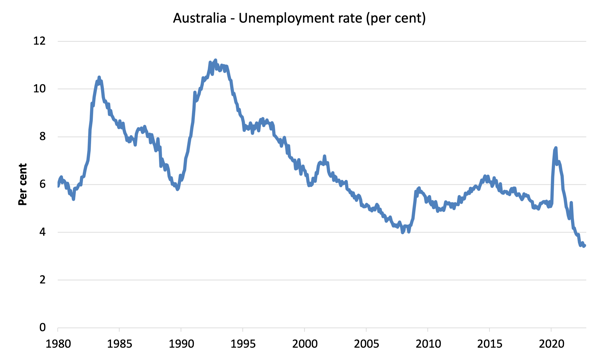
Unemployment rose by 7.4 thousand to 491.7 thousand persons in November 2022
Unemployment rose because the net rise in employment (64 thousand) was outstripped the rise in the labour force (71.3 thousand) with participation rising 0.2 points.
This is a good sign – both net jobs growth and more people coming back into the workforce – although there is some evidence that some people are taking on extra work to deal with the rising cost of living pressures.
Also so bear in mind the ‘What-if’ analysis above and see the impact of the fall in participation below.
The following graph shows the national unemployment rate from January 1980 to November 2022. The longer time-series helps frame some perspective to what is happening at present.
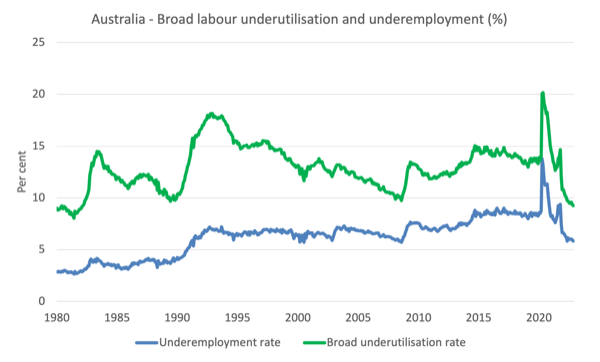
Broad labour underutilisation fell 0.1 point to 9.3 per cent in November 2022
1. Underemployment fell by 0.2 points to 5.8 per cent (a fall of 15.7 thousand).
2. Overall there are 829.8 thousand underemployed workers.
3. The total labour underutilisation rate (unemployment plus underemployment) fell 0.1 points 9.3 per cent.
4. There were a total of 1321.5 thousand workers either unemployed or underemployed.
The following graph plots the seasonally-adjusted underemployment rate in Australia from April 1980 to the November 2022 (blue line) and the broad underutilisation rate over the same period (green line).
The difference between the two lines is the unemployment rate.
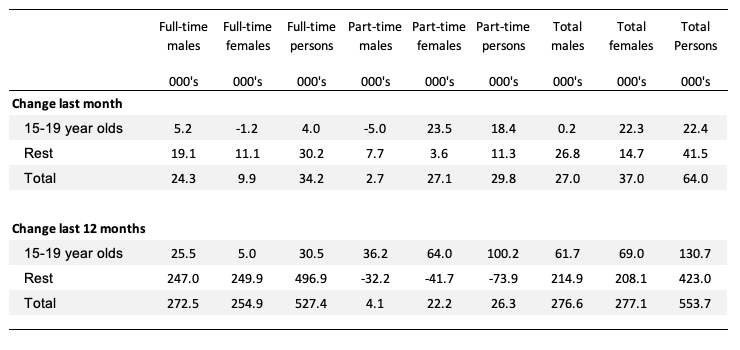
Teenage labour market improved in November 2022
The following Table shows the distribution of net employment creation in the last month and the last 12 months by full-time/part-time status and age/gender category (15-19 year olds and the rest).
\
To put the teenage employment situation in a scale context (relative to their size in the population) the following graph shows the Employment-Population ratios for males, females and total 15-19 year olds since June 2008.
You can interpret this graph as depicting the change in employment relative to the underlying population of each cohort.
In terms of the recent dynamics:
1. The male ratio fell by 0.1 point over the month.
2. The female ratio was rose by 2.8 points.
3. The overall teenage employment-population ratio rose by 1.3 points over the month.
4. Female teenagers have been doing better in relative terms than male teenagers.

Conclusion
My standard monthly warning: we always have to be careful interpreting month to month movements given the way the Labour Force Survey is constructed and implemented.
My overall assessment is:
1. The labour market continued to improve in November 2022 with employment rising relatively strongly by 64,000 (0.5 per cent) on the back of strong full-time and part-time employment growth.
2. The participation rate also rose by 0.2 points, which meant the change in the labour force was larger than the change in employment, and as a consequence, official unemployment rose.
3. There is some evidence that more people are taking on extra work to cope with the cost-of-living pressures.
4. While all this suggests a fairly tight labour market, the underlying (‘What-if’) unemployment rate is closer to 5.1 per cent rather than the official rate of 3.4 per cent.
5. There are still 1,325.5 thousand Australian workers without work in one way or another (officially unemployed or underemployed).
6. The only reason the unemployment rate is so low is because the underlying population growth remains low after the border closures over the last two years. But that is changing as immigration increases.
That is enough for today!
(c) Copyright 2022 William Mitchell. All Rights Reserved.
The 3 books to ask as presents for Xmas to get a an historical perspective of what is actually going on here in my world view are the following .
Christine Desan, Leo Goettlieb professor of law at Harvard Law School in her excellent book, Making Money: Coin, Currency, and the Coming of Capitalism. Desan argues that money is a constitutional project, countering the dubious “commodity” theory common to contemporary economic and legal orthodoxies.
https://moneyontheleft.org/2021/01/01/money-as-a-constitutional-project-with-christine-desan-2/
Jakob Feinig, new book Moral economies of money an assistant professor of human development at Binghamton University, discuss the history of political organizing and activism around money in the United States, from the pre-Revolutionary period to the New Deal era. Characterized alternately by periods of widespread ” monetary silencing” and mass mobilization, the history of money politics that Feinig documents in his research has much to tell us about the present and future of the modern money movement.
https://moneyontheleft.org/2019/09/13/money-politics-before-the-new-deal-with-jakob-feinig/
Bills very own book Full employment abandoned: shifting sands and policy failures.
There will be very little you don’t know about the history of money and employment after reading those 3 books. All of which are excellent.