The IMF and the World Bank are in Washington this week for their 6 monthly…
Australia – quarterly inflation rate declining
Today (January 25, 2023), the Australian Bureau of Statistics released the latest – Consumer Price Index, Australia – for the December-quarter 2022. It showed that the CPI rose 1.8 per cent in the quarter (down 0.1 point) and over the 12 months by 7.8 per cent (up 0.5 points). So, the annual inflation rate in Australia was higher in the December-quarter, but, the quarterly rate was lower, suggesting that the current episode is losing steam. The major sources of price increases are temporary – overshoots on pre-pandemic travel and holidays, anti-competitive cartel behaviour and the War in Ukraine. These influences are supplemented by shortages of building materials due to bushfires and food price inflation due to the major floods. The correct policy response should be to provide fiscal support for lower-income households to help them cope with the cost of living rises at present. Increasing interest rates again will not solve the problem that is already abating.
The summary, seasonally-adjusted Consumer Price Index results for the December-quarter 2022 are as follows:
- The All Groups CPI rose by 1.8 per cent for the quarter – 0.1 points down from the last quarter.
- The All Groups CPI rose by 7.8 per cent over the 12 months.
- The major determinants were Domestic holiday travel and accommodation (+13.3 per cent) as airlines gouge profits, Electricity (+8.6 per cent) as the privatised market gouges profits, International holiday travel and accommodation (+7.6 per cent) and New dwelling purchase by owner occupiers (+1.7 per cent).
- The Trimmed mean series rose by 1.7 per cent for the quarter (down 0.1 point) and 6.9 per cent over the previous year.
- The Weighted median series rose by 1.6 per cent (up 0.2 points) for the quarter and 5.8 per cent over the previous year.
The ABS Media Release notes that:
The increase for the quarter was slightly higher than the quarterly movements for the September and June quarters last year (both 1.8 per cent) …
Strong demand, particularly over the Christmas holiday period, contributed to price rises for domestic holiday travel and international airfares …
The main factor influencing the rise in electricity prices was the unwinding of the $400 electricity credit offered by the Western Australian Government to all households last quarter …
Short assessment: The inflation rate is slightly higher but continues to be driven by a relatively narrow set of circumstances related to the supply disruptions from the global pandemic and shortages of building materials largely the result of natural disasters (bushfires) and the Ukraine conflict.
Trends in inflation
The headline inflation rate increased by 1.8 per cent in the December-quarter 2022 a 0.1 point fall over the quarter.
Over the 12 months to December the inflation rate was 7.8 per cent (up 0.5 points).
The rise is transitory – mostly an adjustment in once-off factors – travel exuberance coupled with airline gouging, energy, building materials etc.
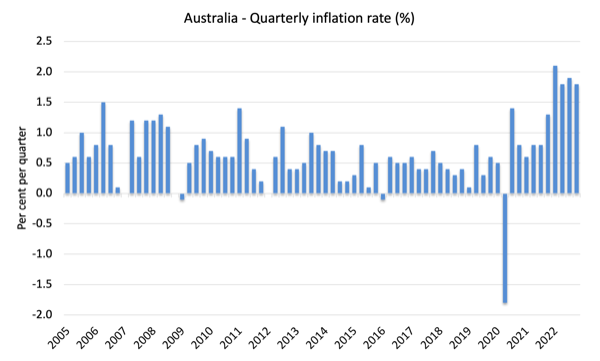
The following graph shows the quarterly inflation rate since the December-quarter 2005.
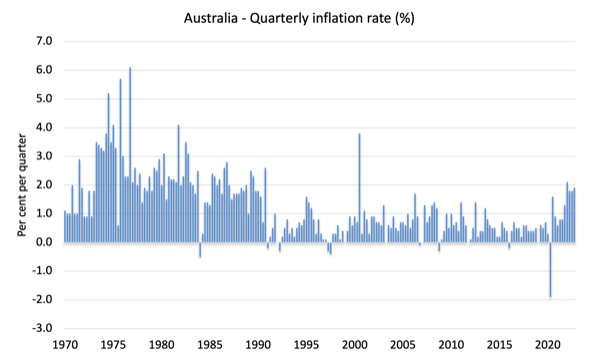
To put that into historical perspective, here is the series since the December-quarter 1970. We are nowhere near the inflationary pressures that followed the OPEC price rises in 1973.
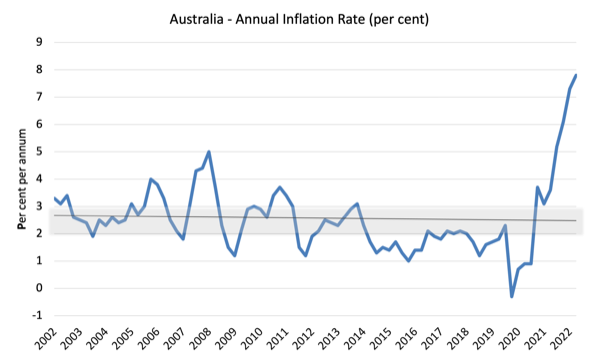
The next graph shows the annual headline inflation rate since the first-quarter 2002. The black line is a simple regression trend line depicting the general tendency. The shaded area is the RBA’s so-called targetting range (but read below for an interpretation).
The trend inflation rate which reflects labour costs and productivity growth and which will reassert itself once the temporary drivers abate is downwards.
What is driving inflation in Australia?
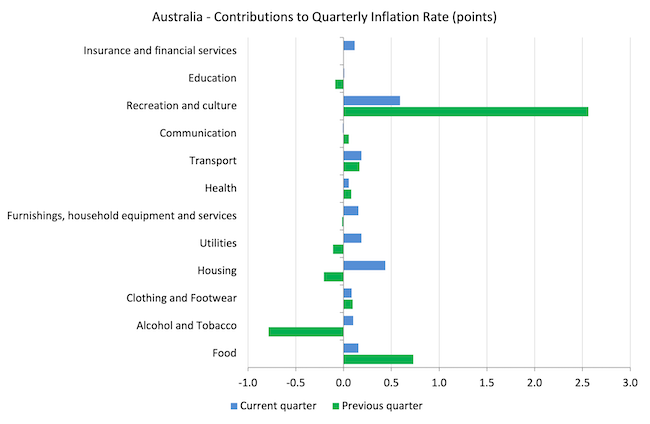
The following bar chart compares the contributions to the quarterly change in the CPI for the December-quarter 2022 (blue bars) compared to the September-quarter 2022 (green bars).
Note that Utilities is a sub-group of Housing.
The Recreation and culture inflation represents a bounce-back from the restricted movement in the last two years as borders open and nations relax travel requirements.
That will normalise over the coming months.
The construction costs for housing are starting to moderate again as more materials are back in supply and that category is being influenced mainly by energy prices as our privatised electricity market records booming profits under the very lax regulation imposed by government.
The impacts of the bad floods on food prices is now abating as supply chains are restored.
Most of the inflationary pressures continue to be driven by supply-side factors and/or reflecting non-competitive and unregulated cartel-type behaviour.
The next graph provides shows the contributions in points to the annual inflation rate by the various components.

Inflation and Expected Inflation
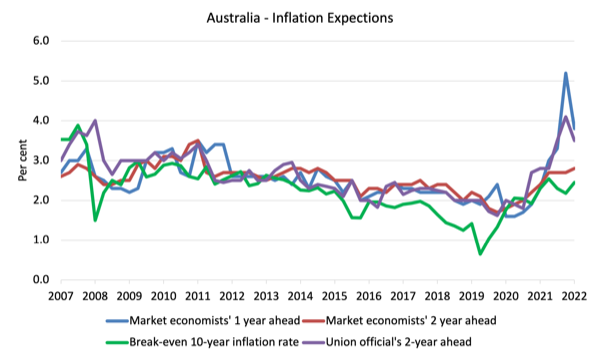
The following graph shows four measures of expected inflation expectations produced by the RBA – Inflation Expectations – G3 – from the December-quarter 2005 to the December-quarter 2021.
The four measures are:
1. Market economists’ inflation expectations – 1-year ahead.
2. Market economists’ inflation expectations – 2-year ahead – so what they think inflation will be in 2 years time.
3. Break-even 10-year inflation rate – The average annual inflation rate implied by the difference between 10-year nominal bond yield and 10-year inflation indexed bond yield. This is a measure of the market sentiment to inflation risk.
4. Union officials’ inflation expectations – 2-year ahead.
Notwithstanding the systematic errors in the forecasts, the price expectations (as measured by these series) have risen over the last year, which is hardly surprising.
However, in the case of the Union and 1-year ahead market outlook, expected inflation has declined substantially.
There is some thinking that as China gets over the current Covid wave and production and spending increases there might be some further transient inflation impulses felt in world markets.
We will wait and see whether that transpires.
The other expectations measures are only slightly up.
Implications for monetary policy
What does this all mean for monetary policy?
Most commentators – looking at the annual headline figure of 7.8 per cent – claim the RBA has no option but to hike rates even further when it meets in February.
I would consider the RBA to be grossly negligent if it did that.
They will not quell the current inflationary pressures with interest rate hikes and will only badly hurt low-income families with housing mortgages, many of whom overextended themselves on the back of statements by the RBA governor that they would not raise rates until 2024.
Further, many home owners are approaching the point where previous fixed rate arrangements with banks are expiring and they will have to negotiate new loans at much higher variable or fixed rates.
The RBA has no idea of the damage that will cause.
The Consumer Price Index (CPI) is designed to reflect a broad basket of goods and services (the ‘regimen’) which are representative of the cost of living. You can learn more about the CPI regimen HERE.
The RBA’s formal inflation targeting rule aims to keep annual inflation rate (measured by the consumer price index) between 2 and 3 per cent over the medium term.
However, the RBA uses a range of measures to ascertain whether they believe there are persistent inflation threats.
Please read my blog post – Australian inflation trending down – lower oil prices and subdued economy – for a detailed discussion about the use of the headline rate of inflation and other analytical inflation measures.
The RBA does not rely on the ‘headline’ inflation rate. Instead, they use two measures of underlying inflation which attempt to net out the most volatile price movements.
The concept of underlying inflation is an attempt to separate the trend (“the persistent component of inflation) from the short-term fluctuations in prices. The main source of short-term ‘noise’ comes from “fluctuations in commodity markets and agricultural conditions, policy changes, or seasonal or infrequent price resetting”.
The RBA uses several different measures of underlying inflation which are generally categorised as ‘exclusion-based measures’ and ‘trimmed-mean measures’.
So, you can exclude “a particular set of volatile items – namely fruit, vegetables and automotive fuel” to get a better picture of the “persistent inflation pressures in the economy”. The main weaknesses with this method is that there can be “large temporary movements in components of the CPI that are not excluded” and volatile components can still be trending up (as in energy prices) or down.
The alternative trimmed-mean measures are popular among central bankers.
The authors say:
The trimmed-mean rate of inflation is defined as the average rate of inflation after “trimming” away a certain percentage of the distribution of price changes at both ends of that distribution. These measures are calculated by ordering the seasonally adjusted price changes for all CPI components in any period from lowest to highest, trimming away those that lie at the two outer edges of the distribution of price changes for that period, and then calculating an average inflation rate from the remaining set of price changes.
So you get some measure of central tendency not by exclusion but by giving lower weighting to volatile elements. Two trimmed measures are used by the RBA: (a) “the 15 per cent trimmed mean (which trims away the 15 per cent of items with both the smallest and largest price changes)”; and (b) “the weighted median (which is the price change at the 50th percentile by weight of the distribution of price changes)”.
So what has been happening with these different measures?
The following graph shows the three main inflation series published by the ABS since the December-quarter 2009 – the annual percentage change in the All items CPI (blue line); the annual changes in the weighted median (green line) and the trimmed mean (red line).
The RBAs inflation targetting band is 2 to 3 per cent (shaded area). The data is seasonally-adjusted.
The three measures are in annual terms:
1. CPI measure of inflation rose by 7.8 per cent (up from 7.3 per cent last quarter). For the quarter it fell by 0.1 point.
2. The Trimmed Mean rose 6.9 per cent (up from 4.9 per cent last quarter). For the quarter it fell by 0.2 points.
3. The Weighted Median rose 5.8 per cent (up from 4.3 per cent last quarter). For the quarter it rose by 0.2 points.

How to we assess these results?
1. The RBA’s preferred measures are now outside the targetting range and would normally trigger an interest rate rise.
2. However,there is no evidence that inflationary expectations are accelerating.
3. While all series rose over the quarter on an annual basis, two of the three measures showed a decline in the growth for the quarter.
3. One of the major drivers of the inflation – housing – is mostly driven by factors that the RBA cannot address through interest rate rises – energy prices, floods, and bushfires.
4. There is no wages pressure.
5. The other major contributors to the current situation are also not sensitive to interest rate rises.
6. There is no major structural bias towards persistently higher inflation rates.
Conclusion
The annual inflation rate in Australia was higher in the December-quarter, but, the quarterly rate was lower, suggesting that the current episode is losing steam.
The major sources of price increases are temporary – overshoots on pre-pandemic travel and holidays, anti-competitive cartel behaviour and the War in Ukraine.
In Australia’s case, these influences are supplemented by shortages of building materials due to bushfires and food price inflation due to the major floods.
The correct policy response should be to provide fiscal support for lower-income households to help them cope with the cost of living rises at present.
Helsinki Public Lecture – The global challenges in the face of an on-going pandemic, climate change and rising inflation – January 25, 2023
Tonight (Australian East Coast Summer Time), I will present my annual public lecture at the University of Helsinki.
The topic this year is – The global challenges in the face of an on-going pandemic, climate change and rising inflation.
You can tune in at 19:00 EAST.
Here is the recording of the stream (note YouTube sometimes mismatches voice and image)
Times:
1. 19:00 East Coast Australian Time.
2. 10:00 Helsinki time.
3. 17:00 Kyoto time.
4. 08:00 London time.
5. 03:00 New York time
That is enough for today!
(c) Copyright 2023 William Mitchell. All Rights Reserved.
The greedflation episode is different from what we ever experienced before.
We are told that inflation is going next to 10%/year, yet some products had risen well above 100%, since this bout of infation began in earnest last year.
Even if many non-essential products had not seen dramatic price hikes, the essentials did have gone through the roof.
A pack of rice that costed around 1€ a year ago, now costs 2,60€.
That’s 160%.
Even if the average value didn’t rise that much, the lower classes are hit the hardest by this biased inflation.
The same with all things that we can’t live without.
It’s not an economic issue. It’s a political issue.
The monopolization of the economy is the problem.
Which is the same as saying that Davos is the problem, not the solution.
One thing I dont understand is why Aust interest rates must follow US interest rates. Cant we keep ours down, if we are sovereign?