Today (April 18, 2024), the Australian Bureau of Statistics released the latest - Labour Force,…
Strong US labour market results – further evidence that mainstream monetary theory is flawed
Well, things are getting interesting in the US. The Federal Reserve started hiking interest rates in April 2022 and its decisions are underpinned by an theoretical framework that suggests the unemployment rate is above what it thinks is the natural rate (the rate where inflation is stable). So the rate hikes are meant to slow spending and increase the unemployment rate and cause price setters to stop accelerating prices up. Except the data isn’t obeying the theory and inflation is falling despite the rate hikes rather than because of them. This is another demonstration of how flawed the dominant mainstream economics has become. Last Friday (February 3, 2023), the US Bureau of Labor Statistics (BLS) released their latest labour market data – Employment Situation Summary – January 2023 – which revealed on-going and very robust employment growth, rising participation and falling unemployment. These are good signs for American workers. Further, as inflation is now in decline, most sectors recorded both modest nominal wages growth is some real wages growth – another virtuous sign. The latest data is certainly not consistent with the Federal Reserve type narratives. The point is that the labour market is not behaving at all like the assumed model deployed by the Federal Reserve.
Overview for January 2023 (seasonally adjusted):
- Payroll employment increased by 517,000 – booming.
- Total labour force survey employment rose by 894 thousand net (0.56 per cent) – robust.
- The labour force rose by 866 thousand net (0.52 per cent).
- The participation rate rose by 0.1 point to 62.4 per cent.
- Total measured unemployment fell by 28 thousand to 5,694 thousand.
- The official unemployment rate fell by 0.1 point to 3.4 per cent.
- The broad labour underutilisation measure (U6) rose by 0.1 point to 6.6 per cent.
- The employment-population ratio rose by 0.1 points to 60.2 per cent (still well below the May 2020 peak of 61.2).
For those who are confused about the difference between the payroll (establishment) data and the household survey data you should read this blog post – US labour market is in a deplorable state – where I explain the differences in detail.
Some months the difference is small, while other months, the difference is larger.
This month, the differences were somewhat large.
Payroll employment trends
The BLS noted that:
Total nonfarm payroll employment rose by 517,000 in January, compared with an average monthly gain of 401,000 in 2022. Job growth was widespread in January, led by gains in leisure and hospitality, professional and business services, and health care …
Leisure and hospitality added 128,000 jobs in January compared with an average of 89,000 jobs per month in 2022 … remains below its pre-pandemic February 2020 level by 495,000, or 2.9 percent.
In January, employment in professional and business services rose by 82,000 … averaged 63,000 per month in 2022.
Government employment increased by 74,000 in January. Employment in state government education increased by 35,000, reflecting the return of university workers after a strike.
Health care added 58,000 jobs in January … In 2022, health care added an average of 47,000 jobs per month.
Employment in retail trade rose by 30,000 in January, following little net growth in 2022 (an average of +7,000 per month) …
Construction added 25,000 jobs in January … grew by an average of 22,000 per month in 2022.
In January, transportation and warehousing added 23,000 jobs, the same as the industry’s average monthly gain in 2022 …
Employment in social assistance increased by 21,000 in January, little different from the 2022 average gain of 19,000 per month.
Manufacturing employment continued to trend up in January (+19,000). In 2022, manufacturing added an average of 33,000 jobs per month.
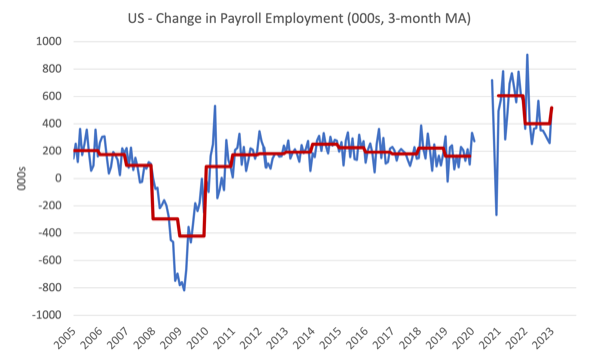
The first graph shows the monthly change in payroll employment (in thousands, expressed as a 3-month moving average to take out the monthly noise). The red lines are the annual averages. Observations between January 2020 and January 2020 were excluded as outliers.
The labour market boomed in January and there is no sign of collapse or a significant slowdown.
Some sectors, however, have still not regained the employment they lost in 2020-21.
The next graph shows the same data in a different way – in this case the graph shows the average net monthly change in payroll employment (actual) for the calendar years from 2005 to 2023.
The red marker on the column is the current month’s result.

Average monthly change – 2019-2023 (000s)
| Year | Average Monthly Employment Change (000s) |
| 2019 | 164 |
| 2020 | -774 |
| 2021 | 606 |
| 2022 | 401 |
| 2023 (so far) | 517 |
Labour Force Survey data – employment rises and more working age people in jobs
The seasonally-adjusted data for January 2022 reveals:
1. Total labour force survey employment rose by 894 thousand net (0.56 per cent) – robust.
2. The labour force rose by 866 thousand net (0.52 per cent) – robust.
3. The participation rate rose by 0.1 point to 62.4 per cent.
4. As a result (in accounting terms), total measured unemployment fell by 28 thousand to 5,694 thousand and the official unemployment rate fell by 0.1 point to 3.4 per cent.
These numbers show a very strong labour market in quantity terms.
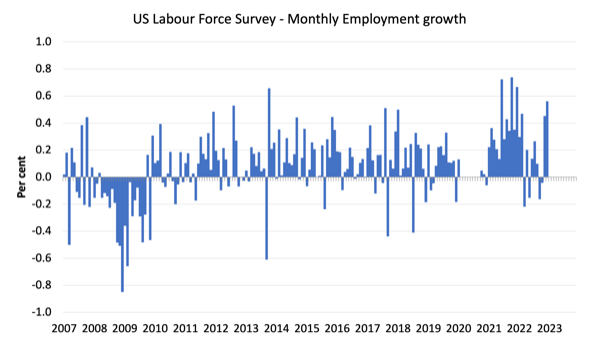
The following graph shows the monthly employment growth since January 2008 and excludes the extreme observations (outliers) between May 2020 and January 2020, which distort the current period relative to the pre-pandemic period.
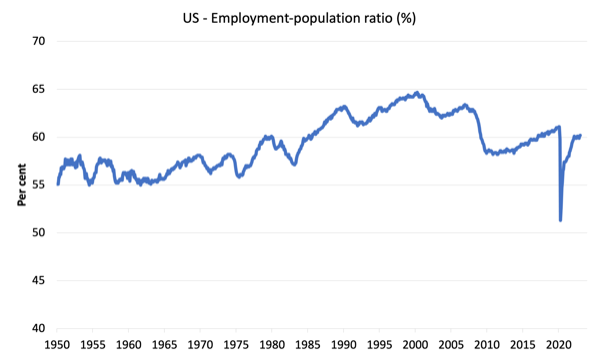
The Employment-Population ratio is a good measure of the strength of the labour market because the movements are relatively unambiguous because the denominator population is not particularly sensitive to the cycle (unlike the labour force).
The following graph shows the US Employment-Population from January 1950 to January 2023.
In January 2023, the ratio rose by 0.1 points to 60.2 per cent.
The peak level in May 2020 before the pandemic was 61.1 per cent.
But this is the highest level since February 2019.
Unemployment and underutilisation trends
The BLS note that:
Both the unemployment rate, at 3.4 percent, and the number of unemployed persons, at 5.7 million, changed little in January. The unemployment rate has shown little net movement since early 2022 …
The number of persons jobless less than 5 weeks decreased to 1.9 million in January. The number of long-term unemployed (those jobless for 27 weeks or more) was essentially unchanged at 1.1 million. The long-term unemployed accounted for 19.4 percent of the total unemployed in January …
The number of persons not in the labor force who currently want a job was 5.3 million in January, little changed from the prior month …
Unemployment fell slightly in January because employment growth was stronger than the growth in the labour force (given the participation rate increase).
So the demand-side of the labour market just exceeded the growth in supply with the other aggregates largely unchanged.
The first graph shows the official unemployment rate since January 1994.
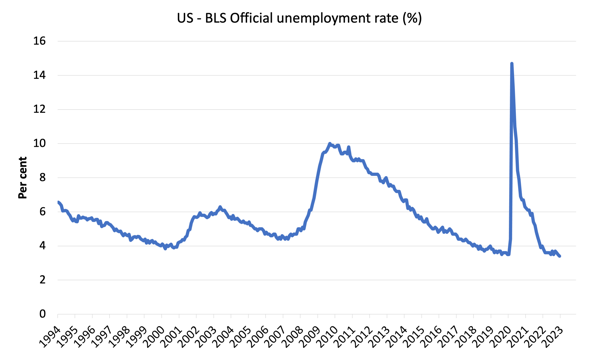
The official unemployment rate is a narrow measure of labour wastage, which means that a strict comparison with the 1960s, for example, in terms of how tight the labour market, has to take into account broader measures of labour underutilisation.
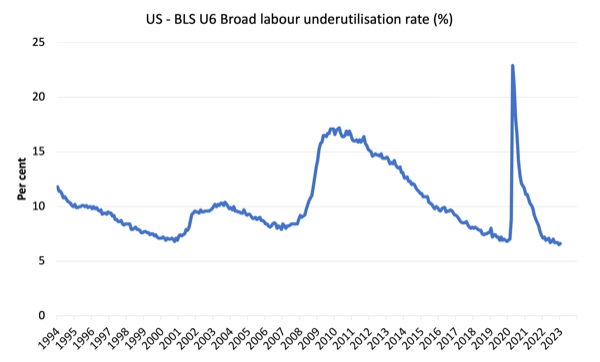
The next graph shows the BLS measure U6, which is defined as:
Total unemployed, plus all marginally attached workers plus total employed part time for economic reasons, as a percent of all civilian labor force plus all marginally attached workers.
It is thus the broadest quantitative measure of labour underutilisation that the BLS publish.
Pre-COVID, U6 was at 6.8 per cent (January 2019).
In January 2023 the U6 measure was 6.6 per cent, up by 0.1 points largely because the underemployment number increased slightly.
What are wages doing in the US?
So the employment data doesn’t suggest that the interest rate hikes have damaged job creation in the US.
What about wages growth?
The BLS reported that:
In January, average hourly earnings for all employees on private nonfarm payrolls rose by 10 cents, or 0.3 percent, to $33.03. Over the past 12 months, average hourly earnings have increased by 4.4 percent. In January, average hourly earnings of private-sector production and nonsupervisory employees rose by 7 cents, or 0.2 percent, to $28.26.
These are modest increases.
However, the latest – BLS Real Earnings Summary (published January 12, 2023) – tells us that:
Real average hourly earnings for all employees increased 0.4 percent from November to December, seasonally adjusted … This result stems from an
increase of 0.3 percent in average hourly earnings combined with a decrease of 0.1 percent in the Consumer Price Index for All Urban Consumers (CPI-U).Real average hourly earnings decreased 1.7 percent, seasonally adjusted, from December 2021 to December 2022.
Overall, over the 12 month period while inflationary pressures were rising, wages growth failed to catch up and real wages fell. But as inflation has started to fall, the modest wages growth has led to modest real wage increases.
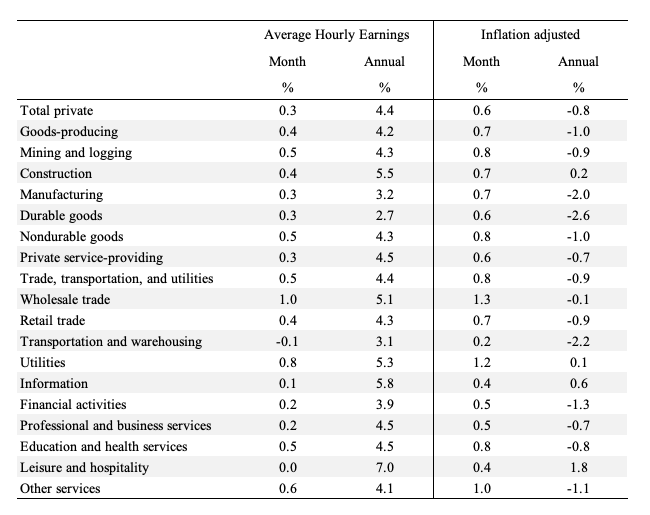
The following table shows the movements in nominal Average Hourly Earnings (AHE) by sector and the inflation-adjusted AHE by sector for January 2023 (note we are adjusting using the December CPI – the latest available).
There is considerable disparity across the sectors, with most now seeing improving real wage outcomes (bar Transportation and Warehousing).
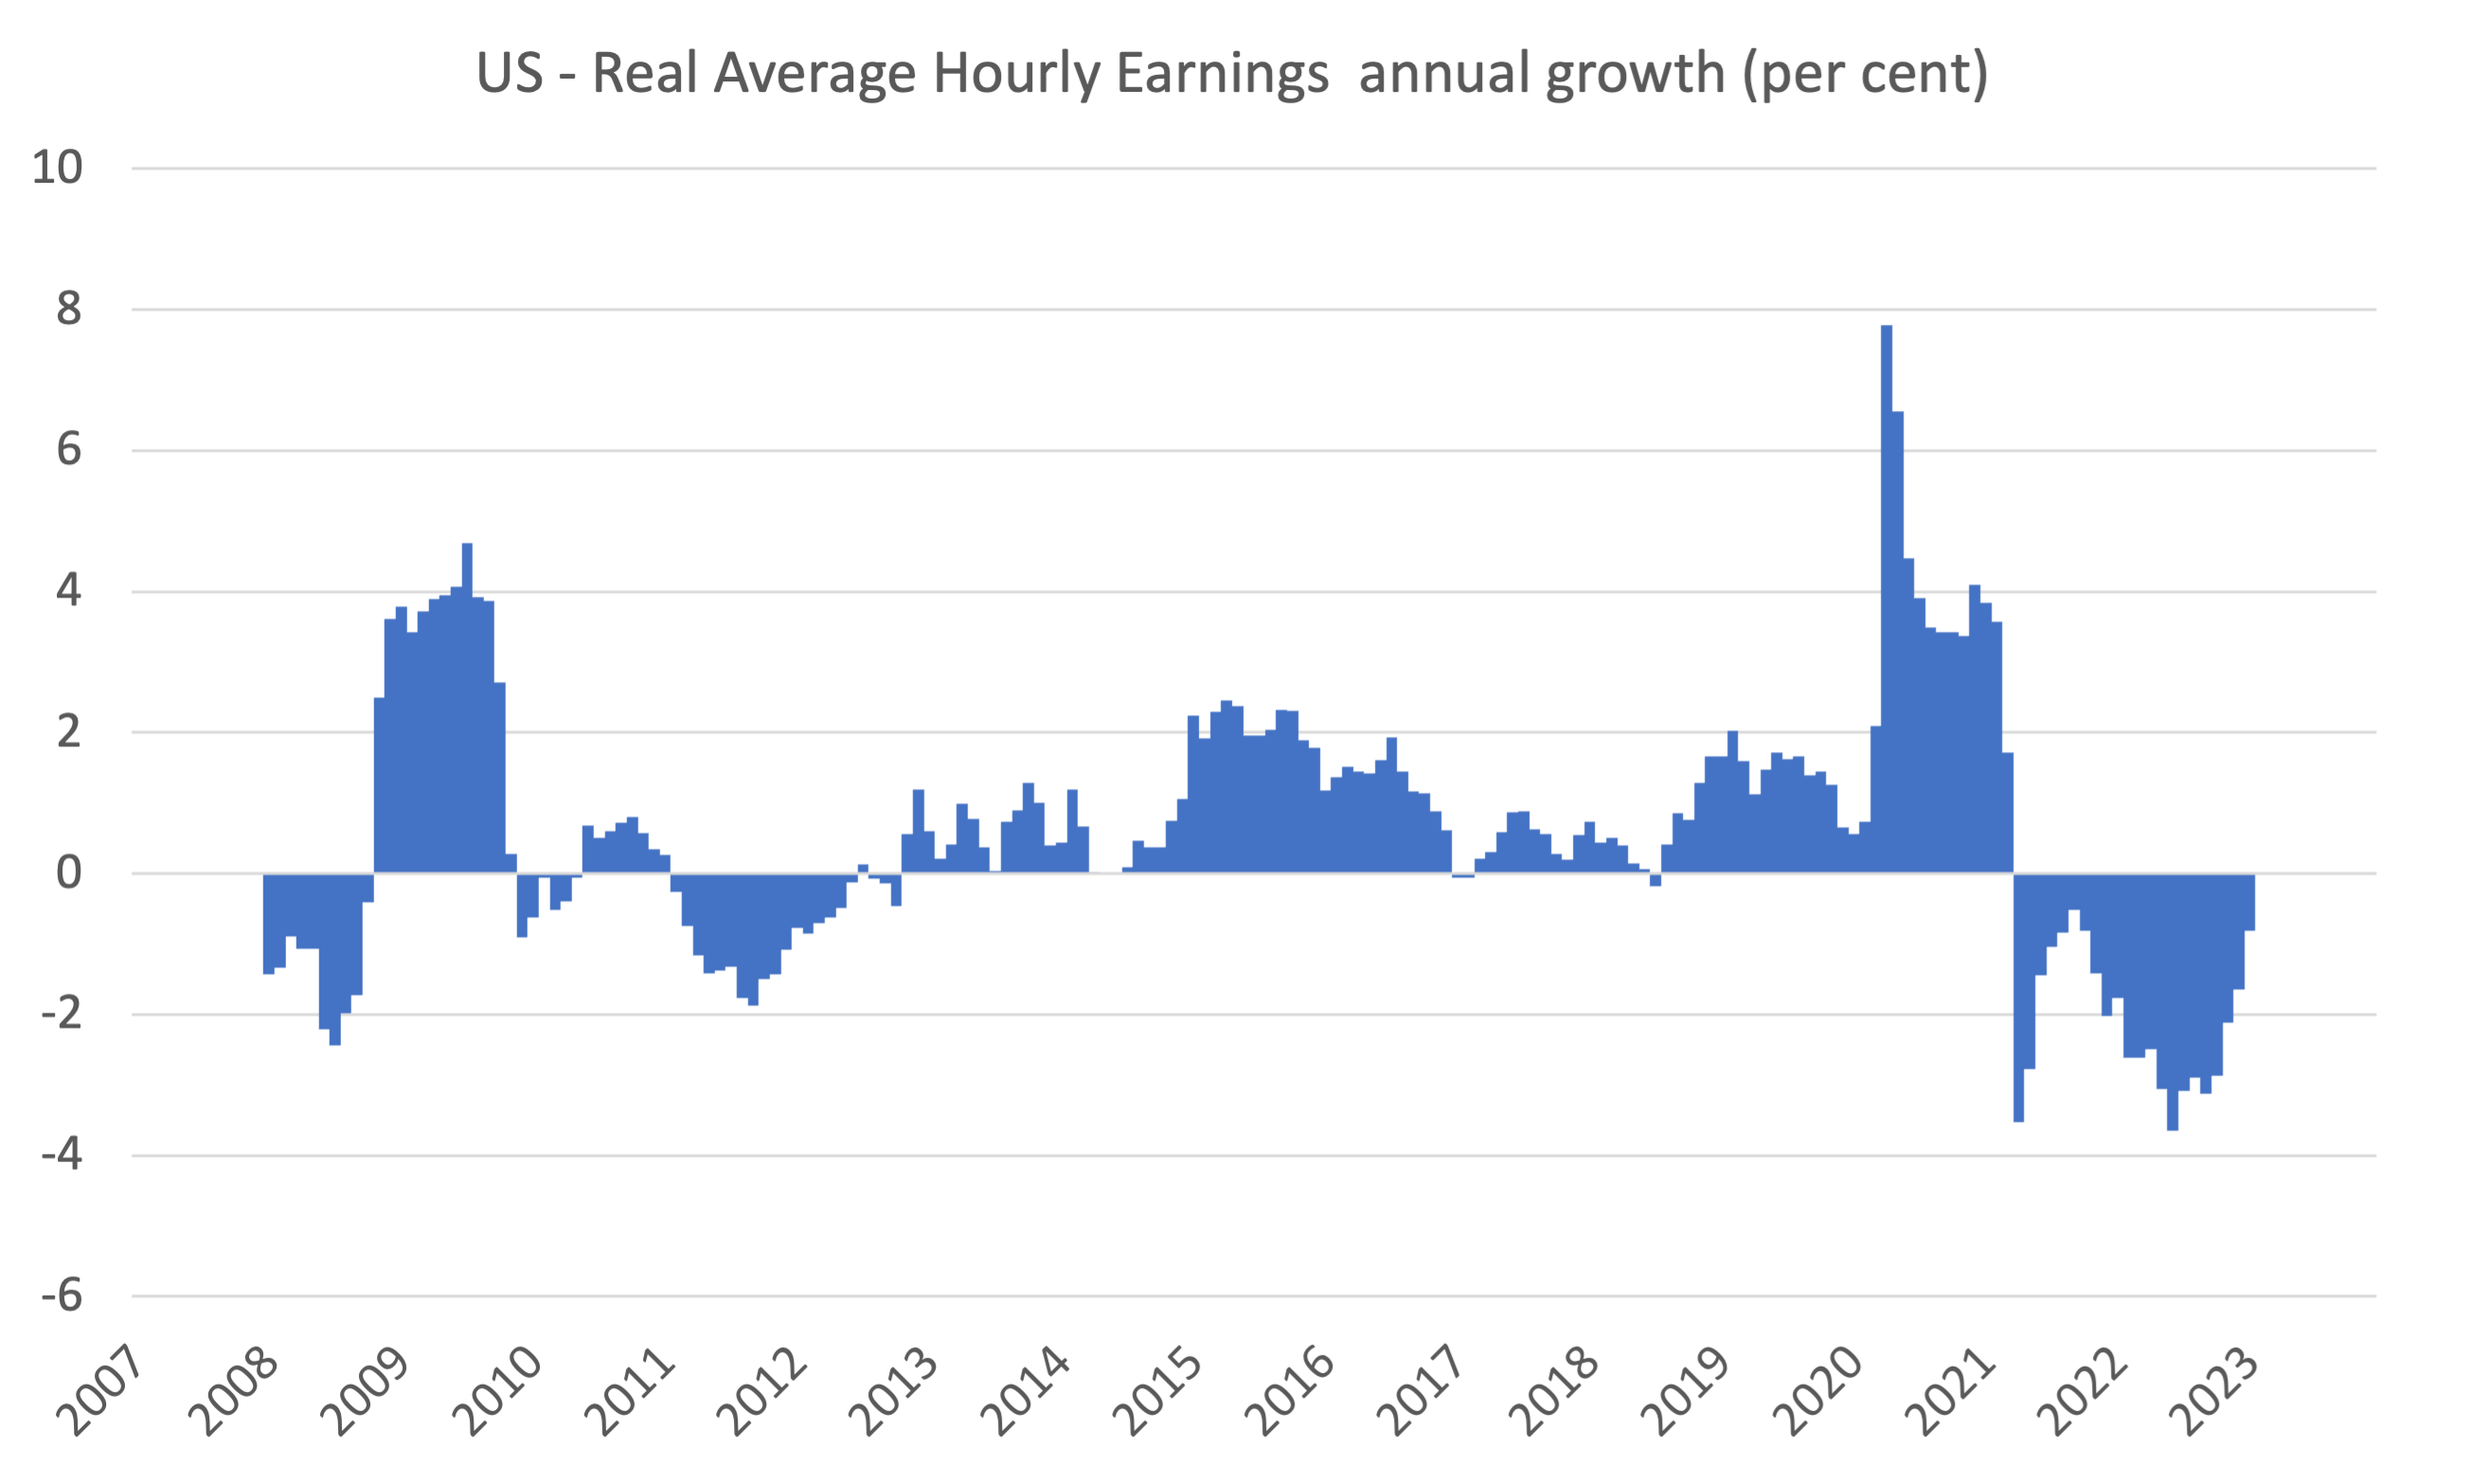
The following graph shows annual growth in real average hourly earnings from 2008 to January 2023.
The other indicator that tells us whether the labour market is turning in favour of workers is the quit rate.
The most recent BLS data – Job Openings and Labor Turnover Summary (released January 4, 2023) – shows that:
The number of job openings increased to 11.0 million on the last business day of December … Over the month, the number of hires and total separations changed little at 6.2 million and 5.9 million, respectively. Within separations, quits (4.1 million) and layoffs and discharges (1.5 million) changed little …
In December, the number of quits was little changed at 4.1 million, and the rate was unchanged at 2.7 percent..
If the US labour market was in retreat, then the quit rate would be falling. It has been steady for some time now.
Conclusion
In January 2023, the latest US labour market data showed strong employment growth, rising participation and falling unemployment.
These are good signs for American workers.
Further, as inflation is now in decline, most sectors recorded both modest nominal wages growth is some real wages growth – another virtuous sign.
The latest data is certainly not consistent with the Federal Reserve type narratives.
That is enough for today!
(c) Copyright 2023 William Mitchell. All Rights Reserved.
Bill, you wrote”… “its decisions are underpinned by an theoretical framework that suggests the unemployment rate is *above* what it thinks is the natural rate (the rate where inflation is stable).”
If the Fed thinks UE is above the NAIRU, why is it trying to raise the UE rate by raising interest rates?
Did you mean “below”?
Feel free to delete this either way.
Wouldn’t the quit rate decline as the labor market declined? That has been my understanding of it at least. Maybe it’s just a typo? Or have I got this wrong at some other level?
bill, I don’t think the job market is as strong as is being told. Of the 894000 jobs in the household survey for January, more than 800000 are there as a result of a revision to 2022. The BLS does not seem to say which months they belong to and it probably has something to do with changes to the birth death model and population moves. Lots of small businesses are struggling in America, and these do not feature in the establishment survey.
Interest rate hikes has another consequence: to lure investment to the US, and so keep demand for US dollars high – necessary to keep exchange rates on target.
That’s the reason why the ECB keeps following every move the FED does. It looks like a game – who will break first?
Anyway, now that climate change crisis is regarded as beeing solved (although it is not), now that the pandemic was forgotten (although it is not), now that democracy is dead in the EU, now that the US is pushing the EU for WW3 with Russia – it won’t be the US to break.
The level of stupidity in the EU has risen so much, that I doubt very much if it still exists.
Brexit may well be a symptom of desintegration, rather than a cause.
The creation of groups (visegard group, or the PIGS group, who are also increasingly working together) are a BIG symptom of desintegration as well.
So, you only need a missile landing in Moscow to start WW3.
Wait, the US is going to deliver long-range missiles to Ukraine.
@Paulo Rodrigues re: ‘Brexit may well be a symptom of desintegration, rather than a cause.’ It’s neither, though I might wish it were otherwise. ‘now that democracy is dead in the EU.’ Democracy is an ideal, which the EU doesn’t do well in meeting, maybe because it was never a founding concern, but it isn’t closely achieved in the US, China or Russia either. ‘now that the US is pushing the EU for WW3 with Russia.’ Now you’re lapsing into the stupidity that you accuse the EU of. ‘you only need a missile landing in Moscow to start WW3.’ Thank goodness the same isn’t true of missiles landing in Ukraine’s capital and the destruction of its second city Kharkiv eh.
Bill, It would be interesting to see what is happening in the American construction sector, in terms of construction investment growth and its relationship to construction employment growth. Has construction investment slowed over the last two quarters or has it grown? I find this measure with construction employment growth a good indicator of how the American economy is travelling. At the moment construction employment growth looks okay, but if construction investment growth declines, by a substantial amount in the next quarter, I would expect construction employment growth also to decline. This may then indicate a recession is on the horizon.
Jerry Brown:
“Wouldn’t the quit rate decline as the labor market declined?” vs “If the US labour market was in retreat, then the quit rate would be falling.” I think you and Bill are saying the same thing here, at least as I read it before finishing my first cup of coffee.
People quit for more reasons than just to find a better job though. In Canada we are losing even relatively young doctors at a rate that seems to defy logic and it’s very difficult to find replacements.
It’s frightening, there are people in their 90’s without doctors after theirs retires or quits.
For a poor country without an industry, is it possible to keep interest rate at zero or at least low?
“For a poor country without an industry, is it possible to keep interest rate at zero or at least low?”
In the abstract, I would think it possible. David Graeber’s _Debt_, and his _The Dawn of Everything_ with David Wengrow study finance through the ages and the variety of social arrangements through the ages. Even in the financially developed nation of Babylon (with nominal interest rates of 20%, IIRC) the debt Jubilees probably had the effect of making the actual long-term interest rate into something near zero.
But in modern international politics, a poor non-industrial nation would probably find somebody coming along with industrial-grade weapons, intent on finding something to squeeze out. The poor couldn’t exercise sovereignty. It would be the invaders who chose zero interest rates if anybody did.
@Patrick
«’now that the US is pushing the EU for WW3 with Russia.’ Now you’re lapsing into the stupidity that you accuse the EU of.»
In what way is it stupid? Supplying weapons is and always has been an act of war, even if a low level of armament has usually been allowed, and so is training and strategic planning (even an incompetent one). Both the US and the EU have told their own people they are at war, that it will be supported until the last Ukrainian, and even the Ukrainian defense minister has just said they are fighting for us.
I have no idea how you can read a desire for peace there, or the well being of any of the pawns, even without considering the massive profits extracted by American capital, still buying Russian dinosaur sludge and removing European supply. Or how much of a Pinochet aspirant is mister Vogue.
As is often the case, the only good side is the one that has no power, the people themselves.