I have received several E-mails over the last few weeks that suggest that the economics…
So we are the best are we?
There was an almost euphoric outlook for the Australian economy by Australia’s central bank yesterday as they raised interest rates once again. And earlier this week, the Federal Treasurer released the Mid-year Economic and Fiscal Outlook 2008-09 saying that “Australia is the strongest-performing advanced economy in the world …” Strongest is a superlative – the best. So you wonder what he is talking about when you consider that we have more than 14 per cent of our labour resources underutilised in one way or another. Then some bad news comes in today and you realise the government (both arms – central bank and treasury) are spinning away …
But the superlatives are reinforced at present by the repetitive strains from the conservative press (News Limited leading the charge) that the troubles are over … they never came … or whatever … and that the stimulus has to be wound back with all the scaremongering crammed into every article to justify that assertion.
Then there is the Federal Opposition spokespersons are now chanting “the recession we never had” … they struggle with anything very complex so I guess that is witty for them.
So this is the background for yesterday’s decision by the RBA to increase the target interest rate by 0.25 per cent, the second increase in consecutive months. We are now 3.5 per cent above the US funds rate.
Commentators in Australia are almost claiming it as some sort of badge of honour that we are leading the world into hiking rates again. I shake my head whenever I hear this nonsense.
The big four banks have all rushed in to push their lending rates up and I observe a marked asymmetry in their behaviour that should inform consumers that they are better off ditching their accounts with these organisations, and moving their funds to the smaller more reliable building societies. When the RBA was cutting rates and fearing the worst, our big 4 lagged well behind citing “increased funding costs” but refusing to disclose what they actually were.
The anecdotal evidence around the place is clear – their funding costs may have increased a bit at the height of the crisis but by nothing which would justify their behaviour. In other words, they were just being greedy as usual.
By the way, is there any person out there who has data on this (like someone who works in a bank and knows) who wants to send it to me (anonymously)?
The statement by the RBA Governor said:
The global economy has resumed growth … The expansion is generally expected to be modest in the major countries, due to the continuing legacy of the financial crisis … For Australia’s trading partner group, growth in 2010 is likely to be close to trend … Economic conditions in Australia have been stronger than expected and measures of confidence have recovered. Some spending has probably been brought forward by the various policy initiatives. With those effects now diminishing, these areas of demand may soften somewhat … There have been some early signs of an improvement in labour market conditions … Inflation has been declining for the past year.
So all of that justifies in their view a further rise. For an average mortgate of $300,000 the rate rise means an extra $45 on the monthly repayments. So already the RBA has added $90 per month to the average mortgage-holder’s commitments.
With Australian households still precariously holding record levels of debt (see more below) this squeeze will have negative effects. The RBA is trying to dress it up – aided an abetted by the mainstream economics commentators – that the monetary policy stance is still expansionary. This is based on their highly flawed notion of a neutral interest rate (which some say is between 5 and 6 per cent).
But I suspect there will now be increasing defaults as those families who are on the margin of insolvency and who have had dramatic cuts in hours of work as the downturn unfolded will be tipped over the edge.
This is a totally unnecessary policy change.
But any rate … how good are we?
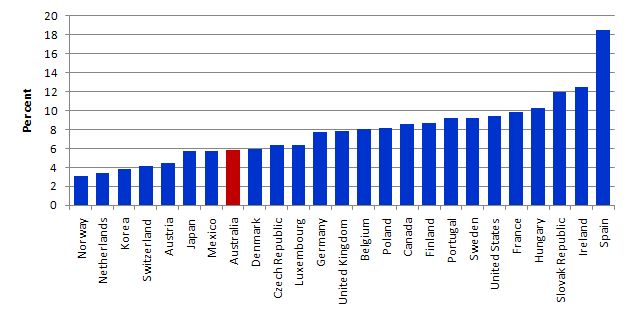
The following graph compares the Standardised unemployment rates (as at July 2009) from the OECD Main Economic Indicators for as many OECD economies as there is recent data available. You can see that Australia comes in 8th out of the 25 countries. The average for this sample was 7.7 per cent so the only thing you can reliably say is that Australia is a below-average unemployment nation at present.
But, of-course, official unemployment is a narrow indicator of labour wastage. Given that the labour force surveys use a very broad concept of employment (1 hour or more per week and you are counted as being employed under ILO guidelines), the other major source of labour wastage is underemployment. This concept captures part-time workers who want to work more hours but are unable to find them due to demand constraints (shortage of work).
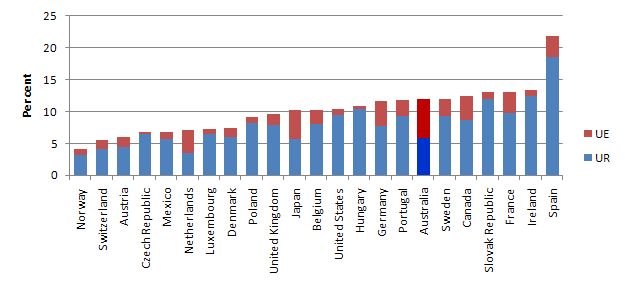
The available data for this across all the countries is somewhat limited but you can get annual data for most of the countries shown in the previous graph from the OECD StatsExtract – search for involuntary part-time work among part-time workers. The latest data is for 2008. So to make the point I just added the 2008 underemployment (denoted UE) to the July 2009 unemployment rates (UE), which is not perfect but won’t distort things too much. It will probably help Australia a little in the rankings.
The following graph then shows total labour underutilisation (in persons) ranked from low to high by country. The blue bars are the unemployment component and the red the underemployment component. Australia looks pretty ugly when you consider the situation from this broader lens – now 17th out of 23 countries.
When the first-quarter data was released for Japan (in May 2009), the economy had shrunk around 4 per cent on an annualised basis. Exports plunged by 26 percent in the first quarter of 2009. Yet they still manage to keep their total labour underutilisation rate well below Australia. Labour productivity overall is also higher in Japan relative to Australia.
In this context, I liked the article – Numbers just don’t add up– in the National Times yesterday (November 3, 2009) by economics editor, Tim Colebatch.
Here are some selected highlights from the article:
THERE’S a puzzle in the Government’s budget update. On one hand, it lifts the growth forecast for this year by 2 percentage points, which you’d think would reduce the deficit. Yet no. Somehow they end up with a worse deficit than they started with.
It sums up the weird debate we’re having. The Coalition, apparently unhappy that we’re doing better than expected, wants the Government to withdraw its stimulus so we can do worse.
The Government, already committed to what now looks like an excessive level of stimulus, has to convince us that it is still needed – while telling us at the same time that we are doing better than anyone else in the world.
“Australia is the strongest-performing advanced economy in the world,” Treasurer Wayne Swan declared yesterday.
I guess that’s why we’ve got unemployment up to 5.7 per cent now, forecast to rise to 6.75 per cent next year, whereas poor old Norway only has 3.2 per cent of its workforce unemployed, the Netherlands 3.5 per cent, Korea 3.8 per cent, and so on.
Perhaps the Treasurer thinks that the higher your unemployment is, the stronger your economy …
The Coalition should shift the debate from its futile attempt to demonise the stimulus to focus on the real victims of the recession: the unemployed, now condemned by the Rudd Government to survive on a dole benefit of just $32.57 a day, plus whatever the welfare agencies can give them. Why don’t we aim to lead the world on that?
Retail Trade
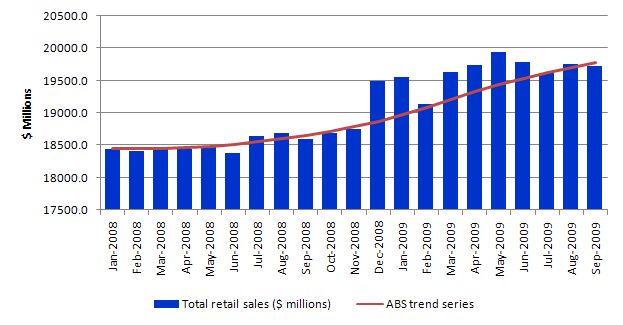
The ABS released the September Retail Trade data today and in “current price seasonally adjusted terms, Australian turnover decreased by 0.2% in September 2009 following a revised increase of 0.7% in August and a decrease of 0.9% in July 2009.”
The following graph plots the ABS data from January 2008 – both the actual series (blue columns) and the ABS trend series (red line).
Now this looks like we are on trend and the commentators are suggesting all is well. But the trend series that the ABS computes is really a path-dependent version of the actual series.
So what we would be predicting if there had been no economic crisis? Then the trend compilation would be somewhat different.
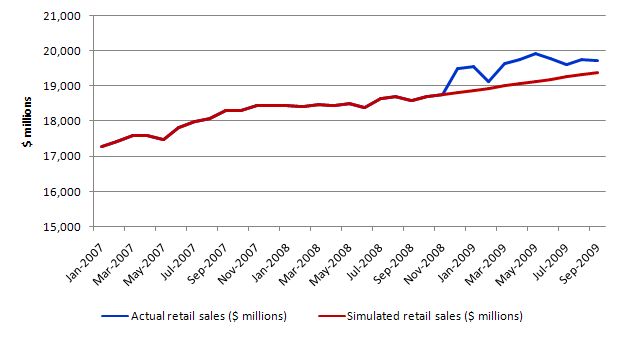
To give us an idea of what might have happened, I decided to create an alternative trend simulation. And before you write in accusing me of all manner of perfidy, I realise that trend estimates are highly dependent on the start- and end-points of the estimation process, the type of estimation used and many other things.
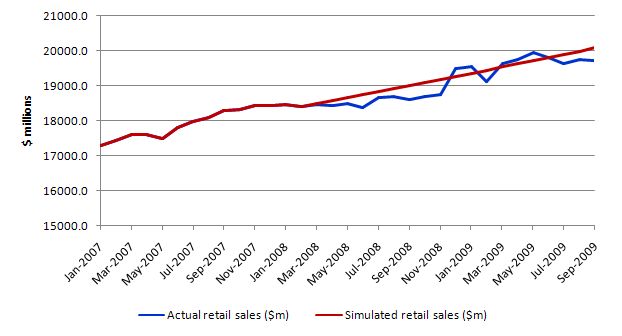
With that said, I proceeded as follows. I ran a regression for 62 monthly observations (January 2003 to February 2008) to extract a simple linear trend. I then computed the monthly growth in the trend series and averaged it. I then simulated the data from February 2008 assuming that the average trend growth between January 2003 to February 2008 was maintained.
The following graph compares the actual retail sales data ($ millions) (blue series) with the simulated series (red). The beginnings of the downturn are noticable with the actual data deviating quite sharply from the trend in early 2008. Then there is a jump in actual retail sales towards the end of 2008 and again in early 2009 which coincide with the two stimulus packages which put signicant volumes of cash into the hands of consumers.
The fiscal stimulus packages probably pushed retail sales back onto the earlier trend growth path. I think the fiscal effect is indisputable. But like all temporary injections of spending the effects wear off and you can see that the actual series is now dipping below the trend growth line.
While this might not impact significantly on GDP given that the second stimulus package contained infrastructure projects which will boost investment in the second half of 2009, the decline in retail sales is still a negative – if only because it portends a decline in consumer confidence.
A second trend construction incorporates a bit of the downturn prior to the stimulus. So the trend was estimated in the same way except the sample for which the growth averages were computed was January 2007 to November 2008 (which is a little short for really precision regression analysis). The following graph then compares the actual data (blue line) with the revised trend simulation (red line).
The difference between the previous two graphs is that the trend growth in the first is higher because it avoids the major early parts of the global downturn prior to the stimulus packages. The first graph is probably a more reasonable version of events because it attempts to tell us what might have happened in the event that the downturn had not have occurred.
The second graph might be helpful to understand just how significant the fiscal intervention was – in the context of an economy that was starting to falter given that the downturn had occurred.
The ABS trend series is not very meaningful as it stands because it mixes downturn with stimulus as a result of the path-dependent nature of its construction.
Have we been deleveraging?
There was one other bit of bad news today which confounds things even further. It came from a reported survey conducted by Loan Market Group, which is an Australian mortgage broker. If their information is accurate and representative then strange things have been happening out there in home mortgage debt land.
The Associated Press article said that:
MORE than 75 per cent of homeowners took advantage of low interest rates to add to their mortgage loan or take on other forms of debt … The poll by mortgage broker, Loan Market Group, found that 44 per cent of homeowners increased their home loan while interest rates were at their lowest in nearly 50 years. One in 10 added to their credit card debt, slightly fewer took on a personal loan, and the same number made a purchase on interest-free terms, while seven per cent borrowed from their relatives. Just 23 per cent were prudent in not taking on any more credit.
First, Australian households cajoled by a very aggressive financial engineering industry and squeezed by 10 years of increasing federal budget surpluses is now holding record levels of debt. Defaults have been rising. There was a very urgent need for the household sector to start deleveraging.
Second, with the RBA now starting to hike interest rates again because somehow a falling inflation rate is a sign of a pending rising inflation rate, the question of insolvency is going to re-enter the public debate very quickly.
The rate rises will probably hurt the most disadvantaged home buyers at this stage and may choke off a bit of “green shoot” investment plans although it is unclear (always) what the impacts of changing monetary policy are given the distributional complexity that drives the total impact.
A spokesperson for the survey noted above was quoted as saying:
Many Australians have borrowed more while the RBA reduced interest rates to near record lows of three per cent in response to the global financial crisis … Hundreds of thousands of Australians are in greater debt than they were a year ago so any increase in interest rates will hurt.
So when the sector should have been reducing debt it has been increasing it. This suggests that the low interest rates were somewhat expansionary (given some of the changes were probably refinancing at lower rates). But how much extra pain the extra debt will now cause as rates rise is unknown. That is one of the problems of relying on monetary policy for anything – it is too uncertain. There are no acceptable models that can telll us the distributional and timing effects of a rate change.
But with so much debt still being held by the household sector I fear we are setting ourselves up for another dive as fiscal policy contracts under the immense pressure that will be brought to bear leading up to the next federal election sometime in 2010.
Conclusion
Overall, there is a sense of deja vu in all of this. The missing concern in the media debate is unemployment. But then we haven’t cared about that for years now to our eternal shame (and inefficiency – massive lost income generating opportunities).
The next step – with a national election less than a year away – will be for the government to start cutting its fiscal stimulus and driving private saving back toward the zero line in concert with the central bank pushing rates up further – because somehow a falling inflation rate is a sign of a pending rising inflation rate and they have to get back to their holy grail – the unmeasurable and totally flawed in concept – neutral rate of interest.
I started writing earlier today about the latest attack on fiscal policy by Edmund Phelps but got sidetracked by current events. I will return to that essay tomorrow – perhaps.
But today all Australians should wallow in being the best. Our Treasurer told us that.
“MORE than 75 per cent of homeowners took advantage of low interest rates to add to their mortgage loan or take on other forms of debt … The poll by mortgage broker, Loan Market Group, found that 44 per cent of homeowners increased their home loan while interest rates were at their lowest in nearly 50 years. One in 10 added to their credit card debt, slightly fewer took on a personal loan, and the same number made a purchase on interest-free terms, while seven per cent borrowed from their relatives. Just 23 per cent were prudent in not taking on any more credit.”
A co-worker said to me a little while ago that she was more or less disappointed that the recession hadn’t been more severe because it means that no one has learned anything (in reference to ever balooning private debt). While I completely disagreed that we need a good million or more to lose their jobs in order to learn some kind of lesson, perhaps she does have something of a point. Australians it seems, are addicted to debt (if the above comment is accurate).
With surplus mania still running riot throughout all corners of government, Australians have little choice but to rack up record levels of personal debt.
That’s the thing though Alan – shouldn’t the current deficit spending be giving people the opportunity to repair their household balance sheets?
Perhaps people have been so conditioned to see debt as a first choice rather than a last resort that there exists a common perception that if you put $500 in a savings account and then immediately rack up an extra $1000 on credit cards or use home equity to buy a new home theatre, you are somehow “saving”.
Hmm. The bulk of the new debt consists of existing homeowners increasing the size of their mortgage.
An interesting trend, begging for an answer.
What falling inflation rate? Australia’s 3-month trailing inflation rate (graph) has been rising steadily since March. I’m not saying that raising rates is necessarily the right response, but I am curious if you have an explanation for the rising consumer price level over this period, especially given that price levels in many other countries have been falling.
Dear hbl
The CPI data for Australia is available at ABS. The All Groups CPI “rose 1.0% in the September quarter 2009, compared with a rise of 0.5% in the June quarter 2009” but on annualised basis it “rose 1.3% through the year to September quarter 2009, compared to an annual rise of 1.5% to June quarter 2009”. So over the year it has fallen.
The RBA considers the annual inflation rate and although the September quarter rise was larger than expected (see below) the fact remains that the annualised rate is falling.
For the September quarter – “The most significant price rises this quarter were for electricity (+11.4%), automotive fuel (+4.0%), water and sewerage (+14.1%), deposit and loan facilities (+3.0%) and house purchase (+1.1%)” whereas the “The most significant offsetting price falls were for other financial services (-2.3%), vegetables (-5.6%), fruit (-5.4%), pharmaceuticals (-4.4%) and audio, visual and computing equipment (-2.2%)”.
So power and gas plus government charges (water and sewerage) were the major drivers. I don’t see that any of that justifies an interest rate rise.
best wishes
bill
Bill,
Thanks for replying and providing some CPI details. The year on year rate of inflation has slowed because the price level was rising so rapidly through September 2008. But look at this chart of price level rather than rate of change. Australia’s advanced consistently until September 2008, then basically plateaued through May 2009 (it had a very small dip in there), and has since been marching higher again. I find it hard to believe that the RBA would consider ONLY the annual inflation rate when this view of the data seems to tell a different story than declining inflation!
I have no idea whether raising rates was an appropriate response to this type of inflation, so you could be right. But you did acknowledge the low rates may have been expansionary: “so when the sector should have been reducing debt it has been increasing it. This suggests that the low interest rates were somewhat expansionary… There are no acceptable models that can tell us the distributional and timing effects of a rate change.” Since price level trends have differed between countries it seems to me that domestic factors are playing a big part (despite electricity and gas being big contributors to the rise), and that changes in private debt levels could play a role, and could in turn be influenced partially by rates.
FYI, I really appreciate your blog in helping me expand my understanding of MMT.
hbl appears to have a point here.
If the chart is accurate then consumer price inflation has been consistently rising for almost 9 months now. Such a trend should not be dismissed. However, such strong price rises in basic utilities probably go quite a long way toward explaining it. The RBA hiking up rates seems unlikely to greatly affect consumer behaviour in these areas.